www.angelbroking.com
Technical & Derivatives Report
August 11, 2020
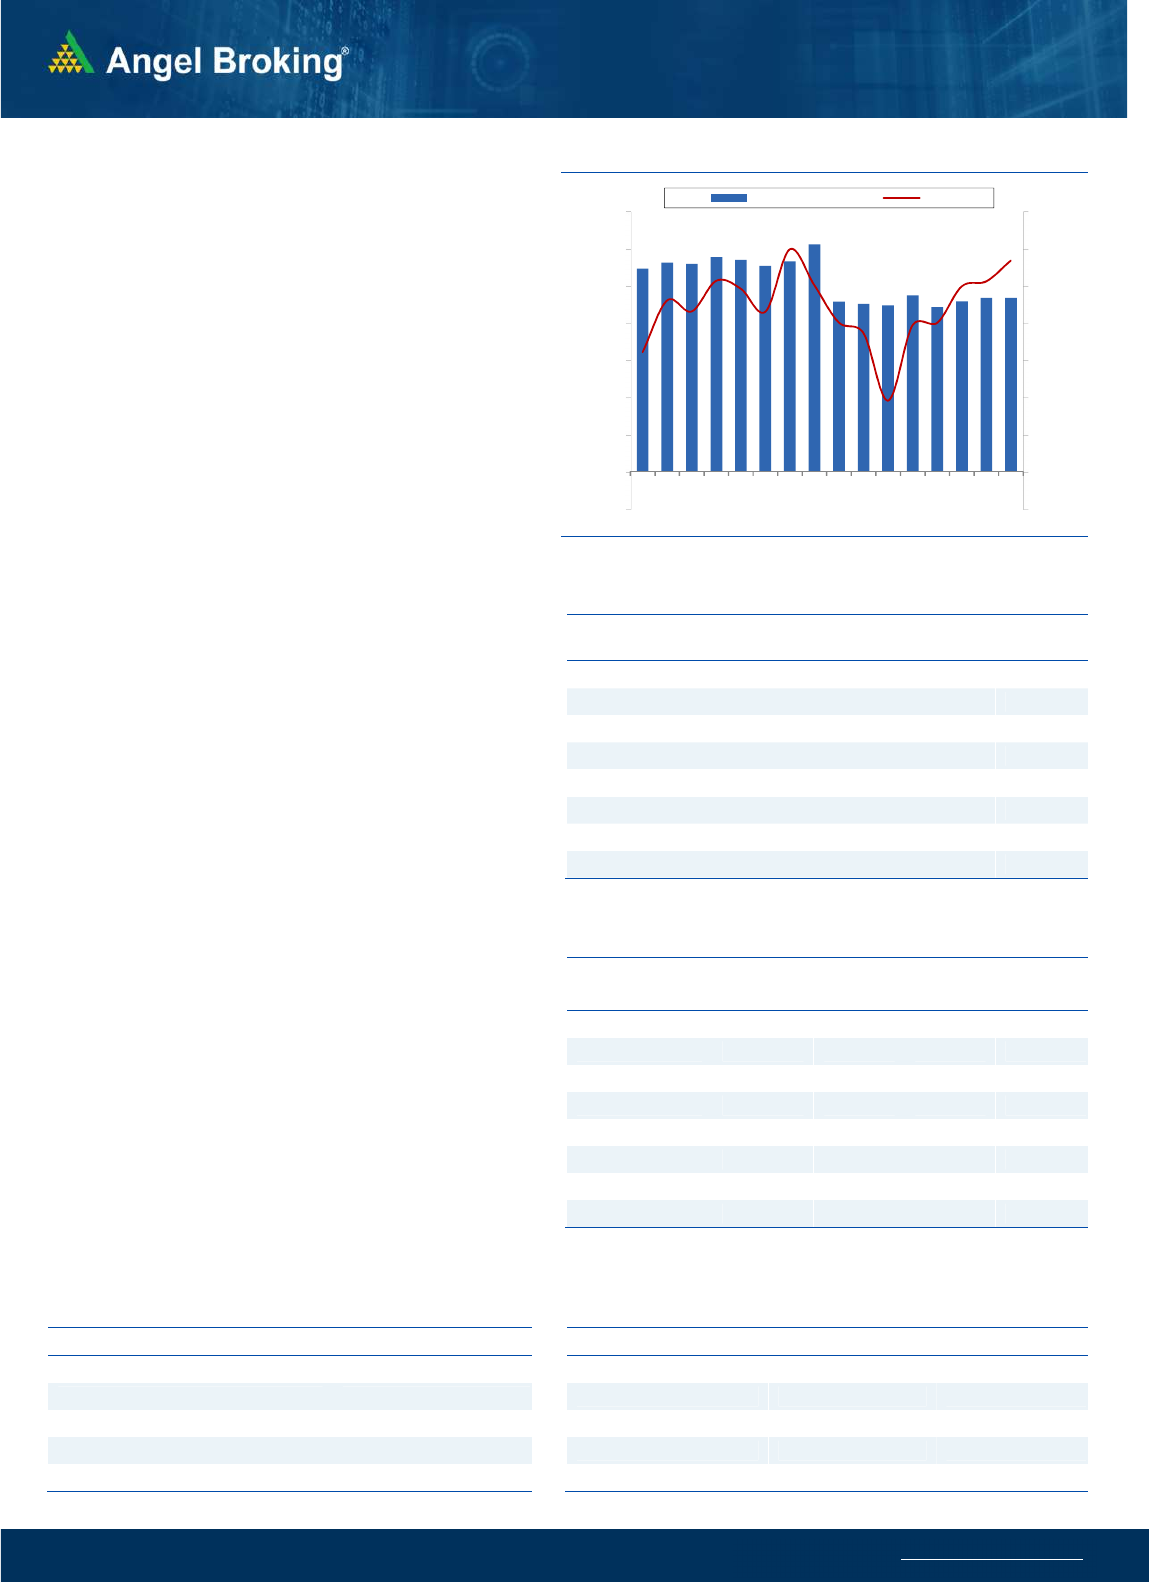
Nifty
Bank Out
look
-
(
21900
)
The banking index too opened on a positive note and surpassed
the 22000 mark. However, the index then consolidated and gave
up some of the gains to end at 21900.
The banking index has been consolidating within a range of
21000-22000 since last few sessions. A decisive breakout above
the higher end could then lead to an upmove in the short term in
this sector. Traders are advised to look for stock specific
opportunities and trade with proper risk management. Above
yesterday's high of 22070, intraday targets will be seen around
22200 and 22350. On the flipside, intraday supports are placed
around 21770 and 21650.
Key Levels
Support 1 – 21770 Resistance 1 – 22070
Support 2 – 21650 Resistance 2 – 22350
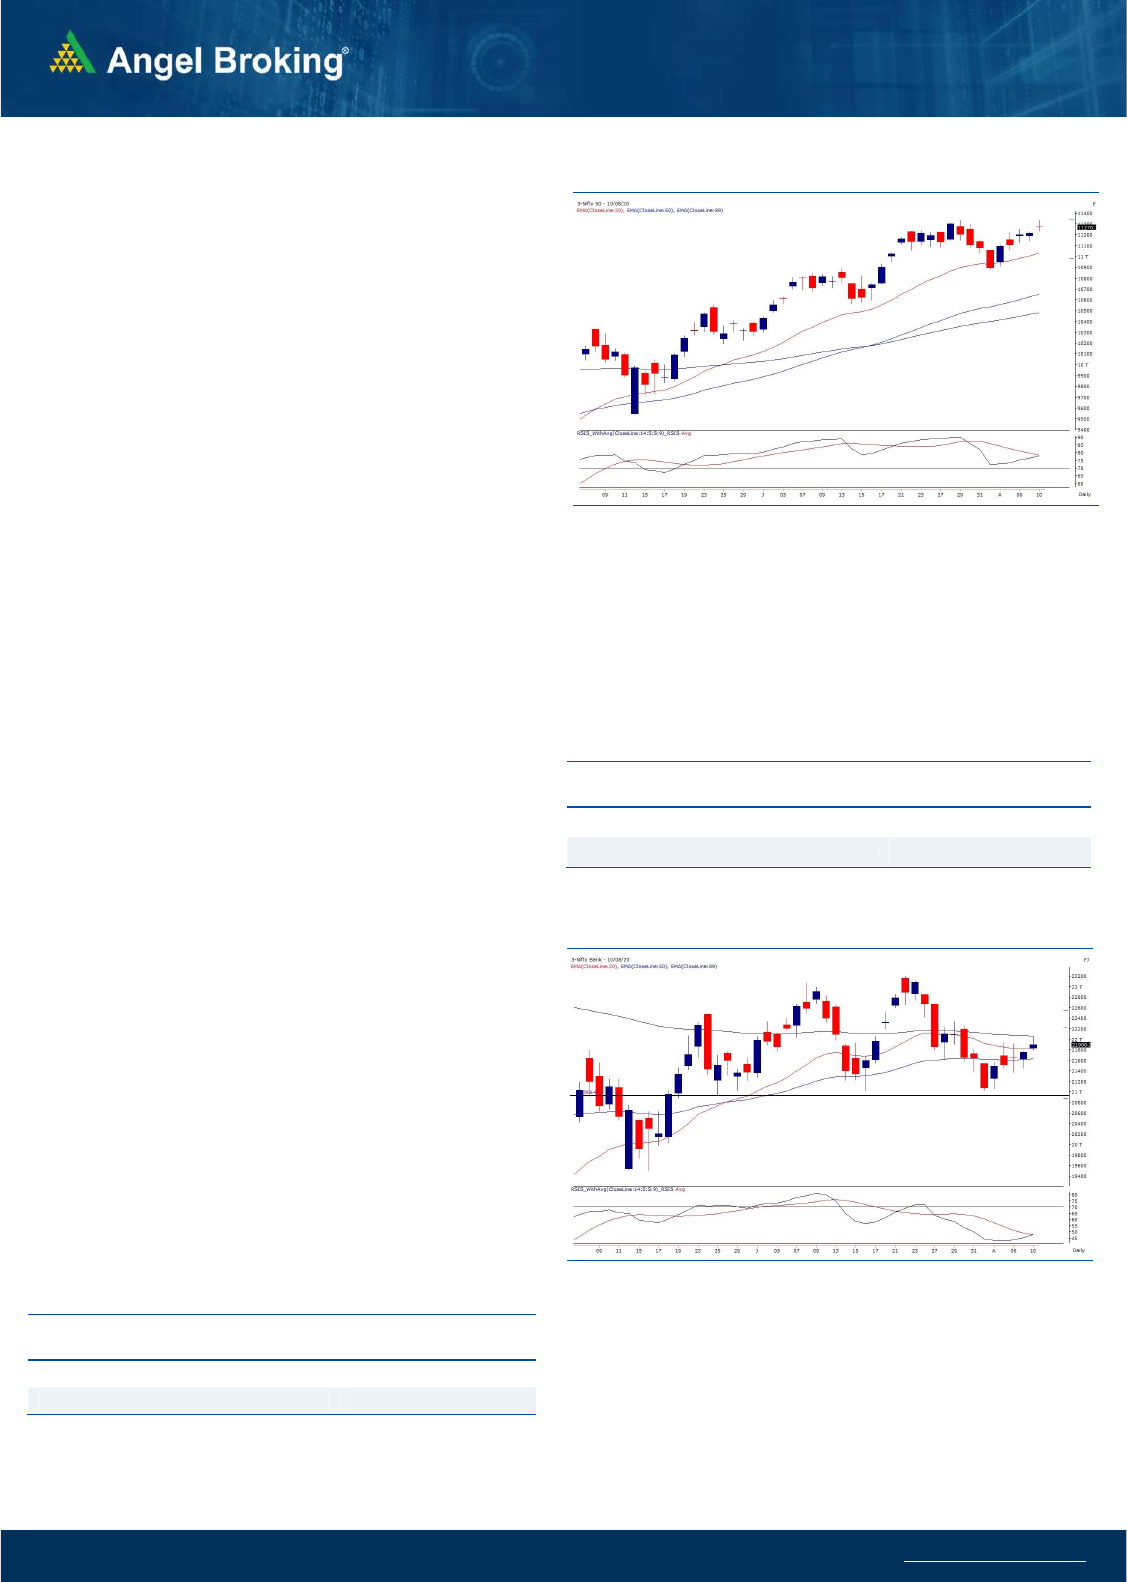
Exhibit 1: Nifty Daily Chart
Sensex (38182) / Nifty (11270)
We kickstarted the proceedings with a decent upside gap, owing to
cheerful global bourses. However, in the initial trades, our markets
extended gains rapidly and, in the process, not only hastened
towards 11300 but also surpassed it convincingly. However, post the
initial exuberance, benchmark slipped into a consolidation mode
since the verdict on Telecom’s AGR dues was awaited. In fact, during
the latter half, traders chose to take some money off the table to be
on the safer side. Despite all this, Nifty managed to close with
precisely half a percent gains to reclaim the 11250 mark.
Since the last couple of days, we have been advocating some
caution, because Nifty has approached a strong resistance zone of
11300-11350 and although there is no sign of weakness yet, it will
not be easy for the index to overcome this sturdy wall. Only a major
trigger on the global or domestic front would be required if we have
to unfold the next leg of the rally. Till then better to take some
money off the table and wait for further development. Now with
yesterday’s price action, the daily chart depicts a ‘Doji’ pattern. This
indicates some uncertainty and this clearly reflects what we
explained in the above section. But with such price behavior,
yesterday’s low has now earned some significance. Going ahead, if
we sneak and sustain below 11238, this will result in some
immediate decline towards 11175 – 11120 - 11064 levels.
Exhibit 2: Nifty Bank Daily Chart
On the sectoral front, Pharma stocks continue with their dream run
and clearly there is no stopping for it. Also, few counters from Auto
and Capital Goods showed tremendous strength. The Midcap space
which has been buzzing since the last few days, has been the centre
of attraction. Traders are advised to keep following such stock
centric moves; but we reiterate it is also important to keep booking
profits and avoid aggressive bets overnight.
Key Levels
Support 1 – 11238 Resistance 1 – 11300
Support 2 – 11120 Resistance 2 – 11350
www.angelbroking.com
Technical & Derivatives Report
August 11, 2020
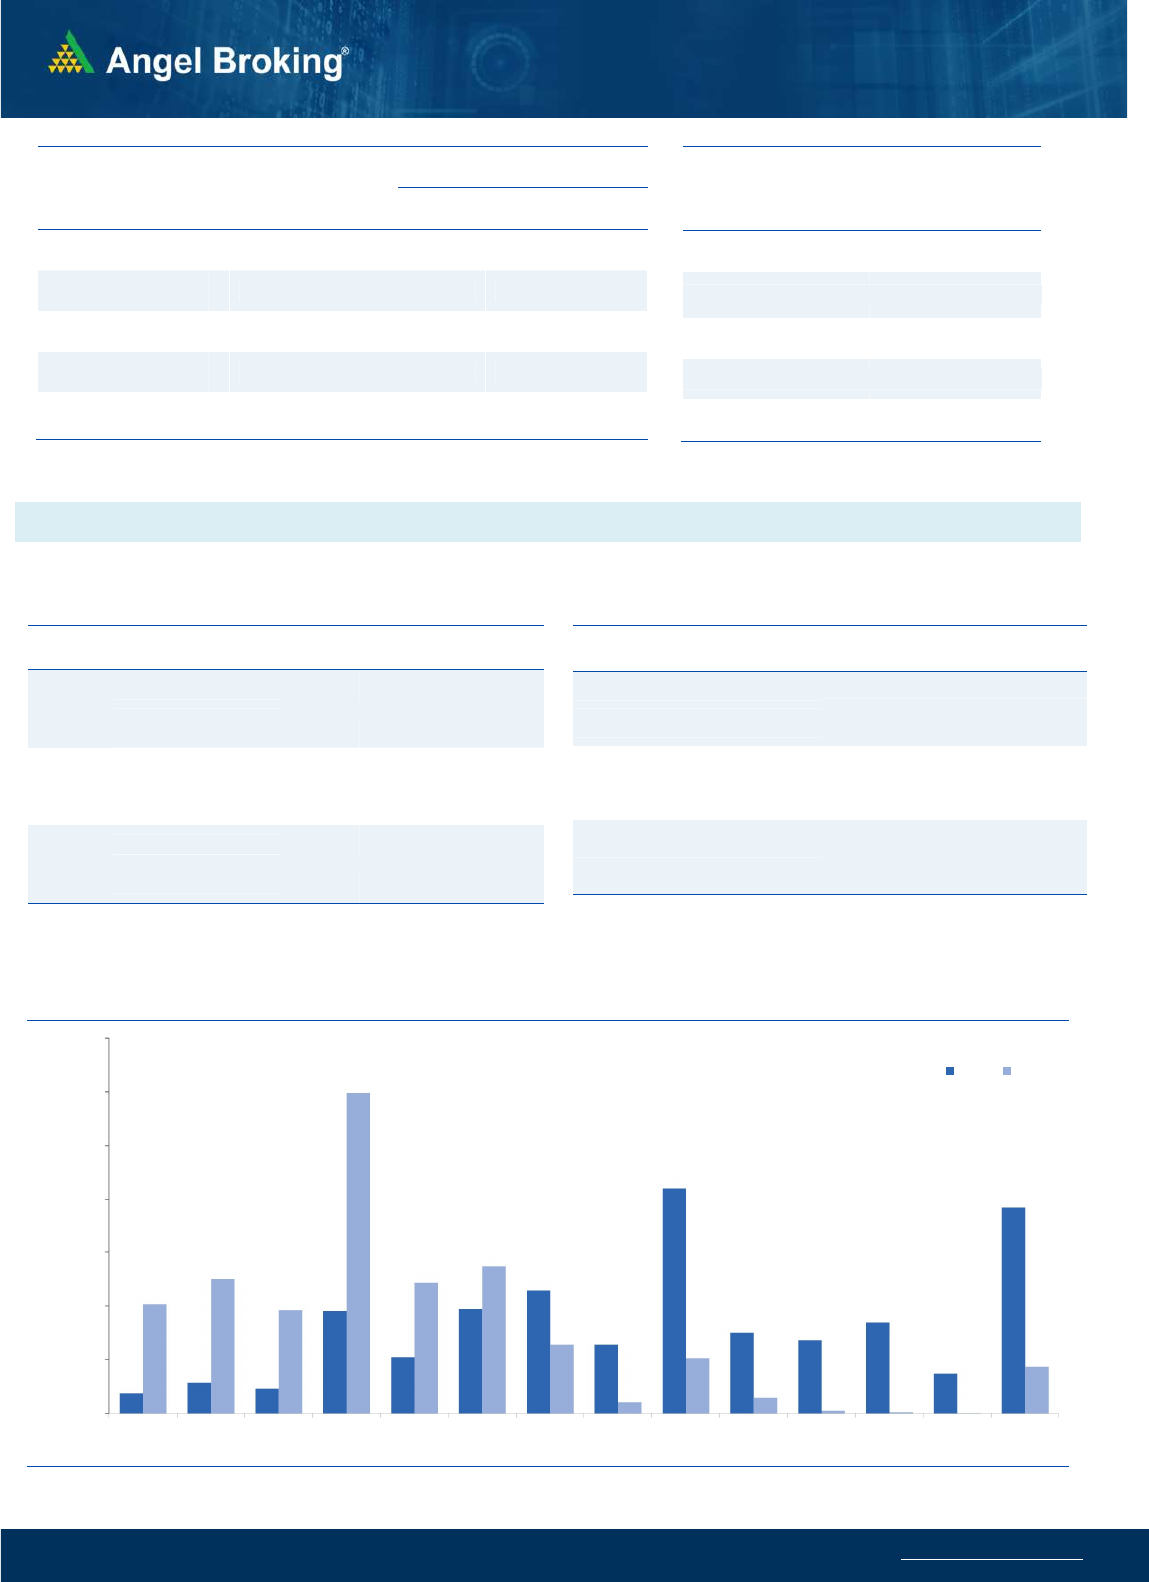
Nifty Vs OI
10600
10700
10800
10900
11000
11100
11200
11300
11400
,0
2,000
4,000
6,000
8,000
10,000
12,000
14,000
16,000
7/20 7/22 7/24 7/28 7/30 8/3 8/5 8/7
(`000)
Openinterest Nifty
View
s
After a gap up opening, Nifty consolidated with a range
of 100 points in yesterday's session with no significant
change in open interest.
FIIs were net buyers in the cash market segment to the
tune of Rs. 301 crores. In index futures, the activity was
muted as they bought worth 24 crores with decrease in
open interest
.
FII's were net buyers in the cash segment whereas their
net activity was muted in index futures. In options
segment, 11200 call saw unwinding of some positions
while addition was seen in 11300 and 11200 puts. On
the call side, open interest is scattered in 11300-11500
options indicating resistance at every 100 points
difference whereas immediate support is placed around
11200. Traders are advised to focus on a stock specific
approach where there are better trading opportunities
seen.
C
o
mme
n
t
s
The Nifty futures open interest has increased by 0.06%
Bank Nifty futures open interest has decreased by 1.64%
as market closed at 11270.15 levels.
The Nifty August future closed with a premium of 23.2
point against a premium of 12.15 point in last trading
session. The September series closed at a premium of
31.2 point.
The INDIA VIX has decreased from 22.58 to 22.51
At the same time, the PCR-OI of Nifty decreased from
1.60 to 1.59.
Few of the liquid counters where we have seen high cost
of carry are NATIONALUM, ZEEL, SAIL, BHARTIARTL AND
MUTHOOT FIN.
OI Gainers
SCRIP OI
OI
CHG. (%)
PRICE
PRICE
CHG. (%)
CONCOR 6473946 61.92 386.40 -14.53
MOTHERSUMI 26943000 16.53 104.90 5.40
AMARAJABAT 1519000 14.56 749.70 4.26
IBULHSGFIN 15292300 13.56 204.70 6.00
BHARATFORG 5689500 12.39 422.80 3.31
TITAN 8800500 12.31 1107.55 1.34
APOLLOHOSP 1319500 10.79 1785.15 2.00
RAMCOCEM 1864900 10.31 685.55 -0.25
OI Losers
SCRIP OI
OI
CHG. (%)
PRICE
PRICE
CHG. (%)
CENTURYTEX 3239600 -15.55 323.00 -0.51
IDEA 383040000 -9.49 9.10 2.25
UPL 13100100 -7.00 494.25 3.05
SRTRANSFIN 2851425 -6.00 674.30 -0.42
SHREECEM 166650 -5.71 22396.20 2.02
RBLBANK 24499800 -5.69 181.00 -5.73
CANBK 13445000 -5.68 101.85 0.39
BRITANNIA 1274400 -5.21 3942.35 0.26
Put-Call Ratio
SCRIP PCR-OI PCR-VOL
NIFTY 1.59 0.93
BANKNIFTY 0.95 0.78
RELIANCE 0.75 0.51
ICICIBANK 0.52 0.44
INFY 0.69 0.54
Historical Volatility
SCRIP HV
CONCOR 55.52
DIVISLAB 43.43
CIPLA 44.68
LUPIN 46.95
BEL 60.81
www.angelbroking.com
Technical & Derivatives Report
August 11, 2020
Note: Above mentioned Bullish or Bearish Spreads in Nifty (August Series) are given as an information and not as a recommendation.
Nifty Spot =
11270.15
FII Statistics for August 08, 2020
Detail Buy
Sell Net
Open Interest
Contracts
Value
(in Cr.)
Change
(%)
INDEX
FUTURES
2729.95
2705.47
24.48
109260
8481.38
(1.14)
INDEX
OPTIONS
119913.03
119494.42
418.61
603312
47790.95
1.00
STOCK
FUTURES
13983.05
14624.45
(641.40) 1296675
91228.62
1.55
STOCK
OPTIONS
4467.59
4504.73
(37.14) 74494
5137.59
6.90
Total 141093.62
141329.07
(235.45) 2083741
152638.54
1.43
Turnover on August 08, 2020
Instrument
No. of
Contracts
Turnover
( in Cr. )
Change
(%)
Index Futures 3,54,275 23416.99 -9.04
Index Options 1,26,44,580
8,79,077.12 5.47
Stock Futures 7,87,700 59790.40 4.80
Stock Options 10,91,566 86837.56 15.71
Total 1,48,78,121
10,49,122.07
5.83
Bull-Call Spreads
Action Strike Price Risk Reward BEP
Buy 11300 186.40
48.40 51.60 11348.40
Sell 11400 138.00
Buy 11300 186.40
88.15 111.85 11388.15
Sell 11500 98.25
Buy 11400 138.00
39.75 60.25 11439.75
Sell 11500 98.25
Bear-Put Spreads
Action Strike Price Risk Reward BEP
Buy 11200 149.70
33.85 66.15 11166.15
Sell 11100 115.85
Buy 11200 149.70
61.40 138.60 11138.60
Sell 11000 88.30
Buy 11100 115.85
27.55 72.45 11072.45
Sell 11000 88.30
Nifty Put-Call Analysis
,0
500,000
1000,000
1500,000
2000,000
2500,000
3000,000
3500,000
10700 10800 10900 11000 11100 11200 11300 11400 11500 11600 11700 11800 11900 12000
Call Put

www.angelbroking.com
Technical & Derivatives Report
August 11, 2020
Daily Pivot Levels for Nifty Constituents
Scrips
S2
S1
PIVOT
R1
R2
ADANIPORTS
322
327
330
335
339
ASIANPAINT 1,747 1,765
1,795
1,812
1,842
AXISBANK
425
428
432
436
440
BAJAJ-AUTO 2,943 2,968
2,997
3,022
3,051
BAJFINANCE 3,327 3,385
3,471
3,529
3,615
BAJAJFINSV 6,244 6,323
6,447
6,526
6,650
BPCL
407
411
418
422
429
BHARTIARTL
549
554
560
564
570
INFRATEL
189
193
196
199
202
BRITANNIA 3,883 3,913
3,959
3,989
4,035
CIPLA
724
760
787
823
850
COALINDIA
128
128
130
131
132
DRREDDY 4,531 4,611
4,685
4,765
4,838
EICHERMOT 20,772
21,062
21,531
21,821
22,290
GAIL
95
96
97
98
99
GRASIM
619
627
635
642
651
HCLTECH 681
686
691
696
701
HDFCBANK 1,033 1,042
1,053
1,062
1,073
HDFC
600
605
611
616
622
HEROMOTOCO
1,778
1,789
1,800
1,810
1,821
HINDALCO 2,654 2,678
2,698
2,722
2,742
HINDUNILVR
173
176
177
180
182
ICICIBANK 2,183 2,195
2,211
2,223
2,239
IOC
354
359
362
367
370
INDUSINDBK
86
86
87
88
89
INFY
500
505
511
516
522
ITC
940
946
951
957
963
JSW STEEL
195
197
198
200
202
KOTAKBANK
236
240
243
248
251
LT 1,328 1,344
1,362
1,378
1,396
M&M
907
933
952
978
997
MARUTI
589
609
625
645
661
NESTLEIND 6,485 6,547
6,638
6,700
6,791
NTPC 16,502
16,584
16,722
16,804
16,942
ONGC
85
87
88
89
90
POWERGRID
78
79
79
80
80
RELIANCE
175
176
177
179
180
SHREECEM 2,074 2,097
2,131
2,154
2,188
SBIN 21,685 22,0
41
22,295
22,651
22,906
SUNPHARMA
190
192
194
196
197
TCS
515
530
540
554
565
TATAMOTORS 2,246 2,264
2,295
2,313
2,344
TATASTEEL
118
121
123
126
128
TECHM
395
403
407
415
419
TITAN
653
667
677
692
702
ULTRACEMCO 1,071 1,090
1,102
1,120
1,133
UPL 3,905 3,937
3,992
4,024
4,079
VEDANTA
472
483
490
501
508
WIPRO
274
276
278
280
283
ZEEL
146
149
151
154
156

www.angelbroking.com
Technical & Derivatives Report
August 11, 2020
*
Research Team Tel: 022 – 39357600 (Extn. 6844) Website: www.angelbroking.com
For Technical & Derivatives Queries E-mail: technicalresearch-cso@angelbroking.com
DISCLAIMER
Angel Broking Limited (hereinafter referred to as “Angel”) is a registered Member of National Stock Exchange of India Limited, Bombay
Stock Exchange Limited and Metropolitan Stock Exchange Limited. It is also registered as a Depository Participant with CDSL and
Portfolio Manager and Investment Adviser with SEBI. It also has registration with AMFI as a Mutual Fund Distributor. Angel Broking
Limited is a registered entity with SEBI for Research Analyst in terms of SEBI (Research Analyst) Regulations, 2014 vide registration
number INH000000164. Angel or its associates has not been debarred/ suspended by SEBI or any other regulatory authority for
accessing /dealing in securities Market. Angel or its associates/analyst has not received any compensation / managed or co-managed
public offering of securities of the company covered by Analyst during the past twelve months.
This document is solely for the personal information of the recipient, and must not be singularly used as the basis of any investment
decision. Nothing in this document should be construed as investment or financial advice. Each recipient of this document should make
such investigations as they deem necessary to arrive at an independent evaluation of an investment in the securities of the companies
referred to in this document (including the merits and risks involved), and should consult their own advisors to determine the merits
and risks of such an investment.
Reports based on technical and derivative analysis center on studying charts of a stock's price movement, outstanding positions and
trading volume, as opposed to focusing on a company's fundamentals and, as such, may not match with a report on a company's
fundamentals. Investors are advised to refer the Fundamental and Technical Research Reports available on our website to evaluate the
contrary view, if any.
The information in this document has been printed on the basis of publicly available information, internal data and other reliable
sources believed to be true, but we do not represent that it is accurate or complete and it should not be relied on as such, as this
document is for general guidance only. Angel Broking Limited or any of its affiliates/ group companies shall not be in any way
responsible for any loss or damage that may arise to any person from any inadvertent error in the information contained in this report.
Angel Broking Limited has not independently verified all the information contained within this document. Accordingly, we cannot
testify, nor make any representation or warranty, express or implied, to the accuracy, contents or data contained within this document.
While Angel Broking Limited endeavors to update on a reasonable basis the information discussed in this material, there may be
regulatory, compliance, or other reasons that prevent us from doing so.
This document is being supplied to you solely for your information, and its contents, information or data may not be reproduced,
redistributed or passed on, directly or indirectly.
Technical and Derivatives Team:
Sameet Chavan Chief Analyst - Technical & Derivatives sameet.chavan@angelbroking.com
Ruchit Jain Senior Analyst - Technical & Derivatives ruchit.jain@angelbroking.com
Rajesh Bhosale Technical Analyst rajesh.bhosle@angelbroking.com
Sneha Seth Derivatives Analyst sneha.seth@angelbroking.com
