www.angelbroking.com
June 11, 2021
Technical & Derivatives Report
Exhibit 1: Nifty Daily Chart
Nifty
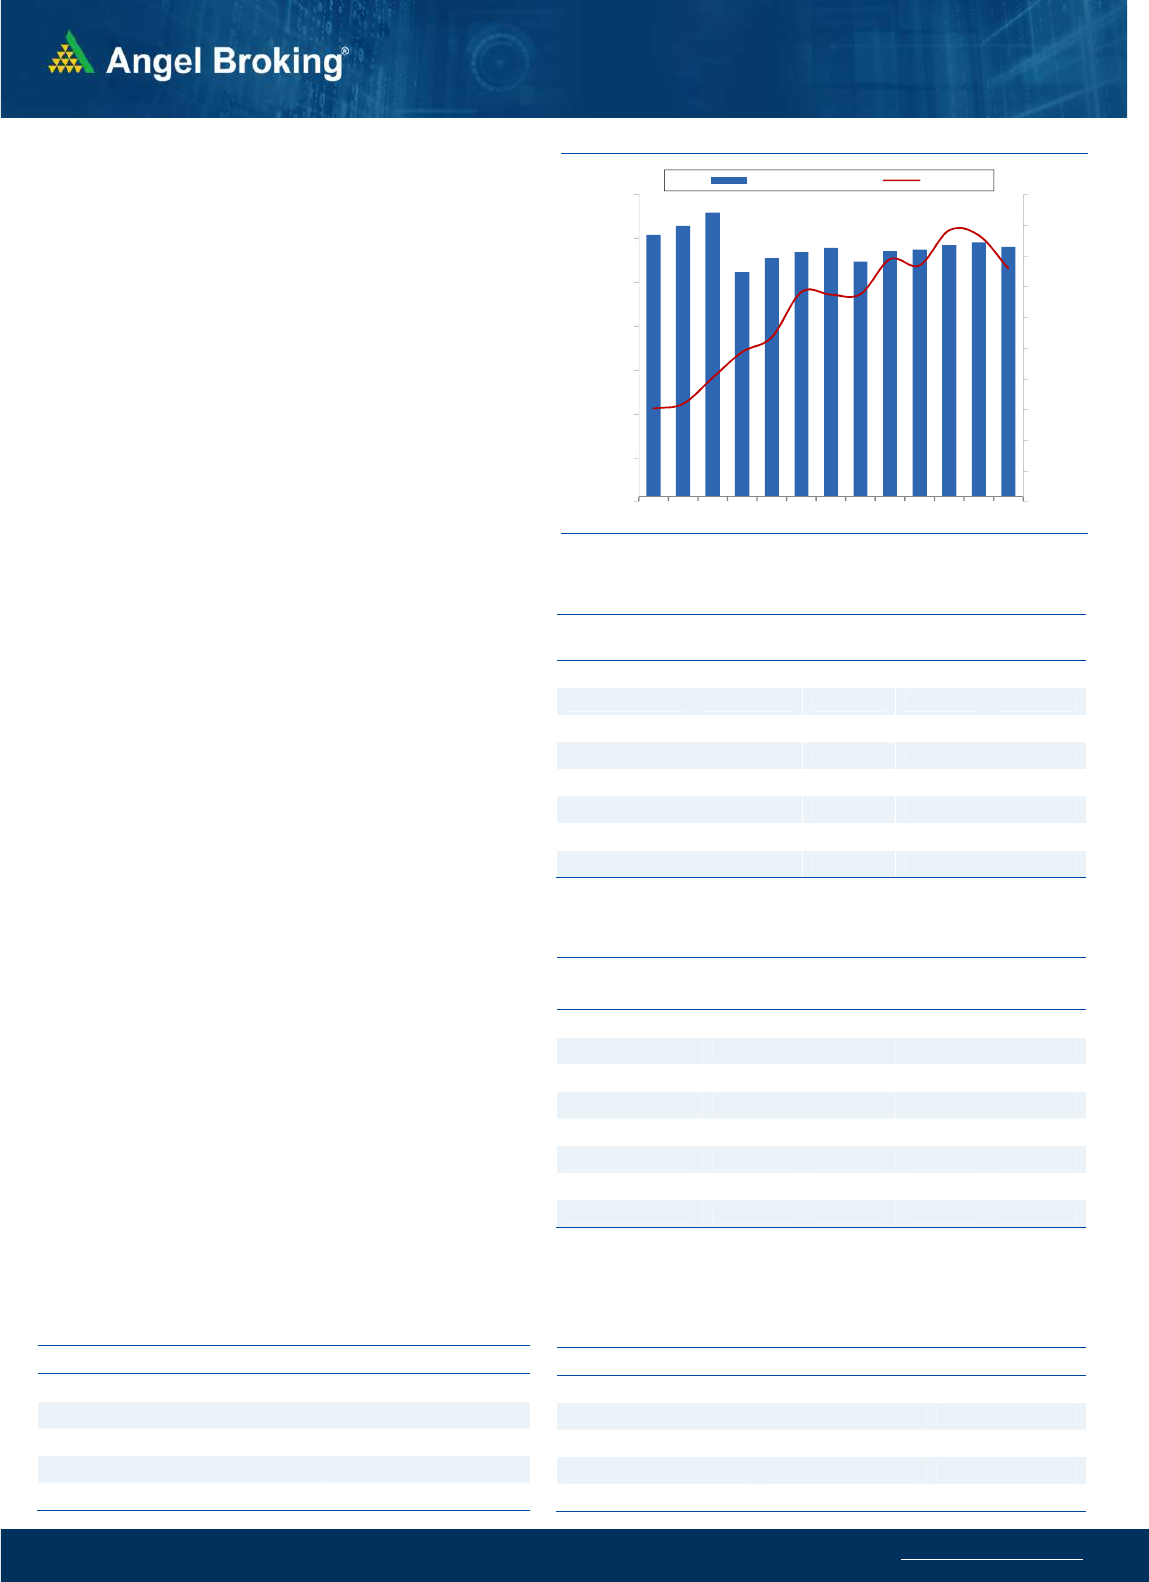
Bank Out
look
-
(
35131)
We had a flat to positive start yesterday after Wednesday’s
shakeout from the higher level. This was followed by some long
consolidation before it started moving higher at the stroke of the
penultimate hour. Due to this late surge in some of the
heavyweights, the BANKNIFTY reclaimed the 35000 mark
convincingly by adding nearly a percent gains.
Yesterday, it was good to see the weakest link financial space
outperforming the benchmark index. However, it is still not
completely out of the woods yet. If BANKNIFTY has to regain the
real strength, it needs to surpass the crucial intraday swing high
of 35400. If this happens then Wednesday’s decline should be
considered a running correction and going forward, 35800 –
36000 are the levels to watch out for. If it fails to do so and starts
correcting below 34800, this would be a sign of weakness. Hence,
it is advisable to keep a tab on these mentioned levels and trade
accordingly.
Key Levels
Support 1 – 35000 Resistance 1 – 35400
Support 2 – 34800 Resistance 2 – 35800
Exhibit 2: Nifty Bank Daily Chart
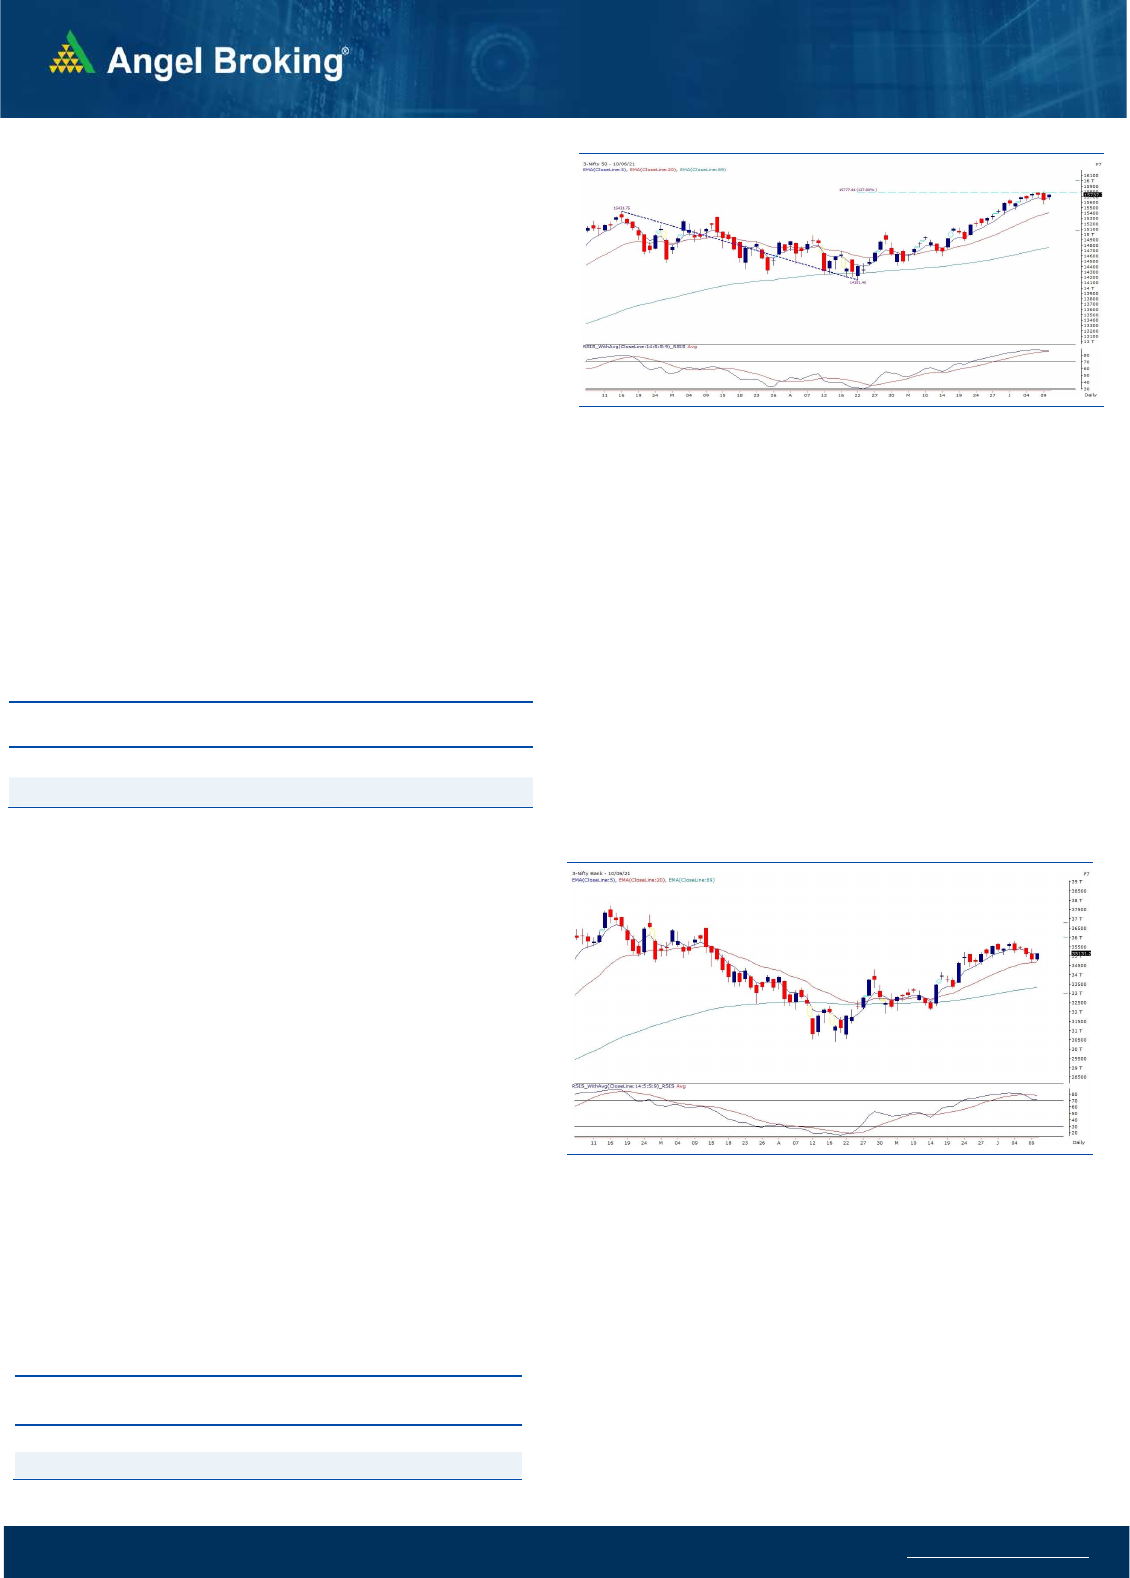
Sensex (52300) / Nifty (15738)
Post the volatility ahead of the weekly expiry session on Wednesday,
the indices showed some pullback in yesterday’s session and
managed to end the day tad below 15750 with gains of over 100
points.
Nifty started the day on a positive note and consolidated within a
range with a positive bias. The index retraced the previous day’s
losses and managed to end around 15750. The market breadth was
again positive as the mid-cap and the small-cap space
outperformed the benchmark. The support for Nifty is placed in
15600-15550 range while resistance is seen around 15800 mark. A
breakout above 15800 would then result into a continuation of the
uptrend towards 16000 and beyond while a breach below the
mentioned support would apply brakes to the optimism. Thus, it
would be interesting to see how the weekly close pans out today.
Although, a lot of stock specific activity could be seen and hence,
traders should look to focus on potential outperforming stocks from
a near term perspective.
Key Levels
Support 1 – 15600 Resistance 1 – 15800
Support 2 – 15550 Resistance 2 – 15870
www.angelbroking.com
Technical & Derivatives Report
June 11, 2021
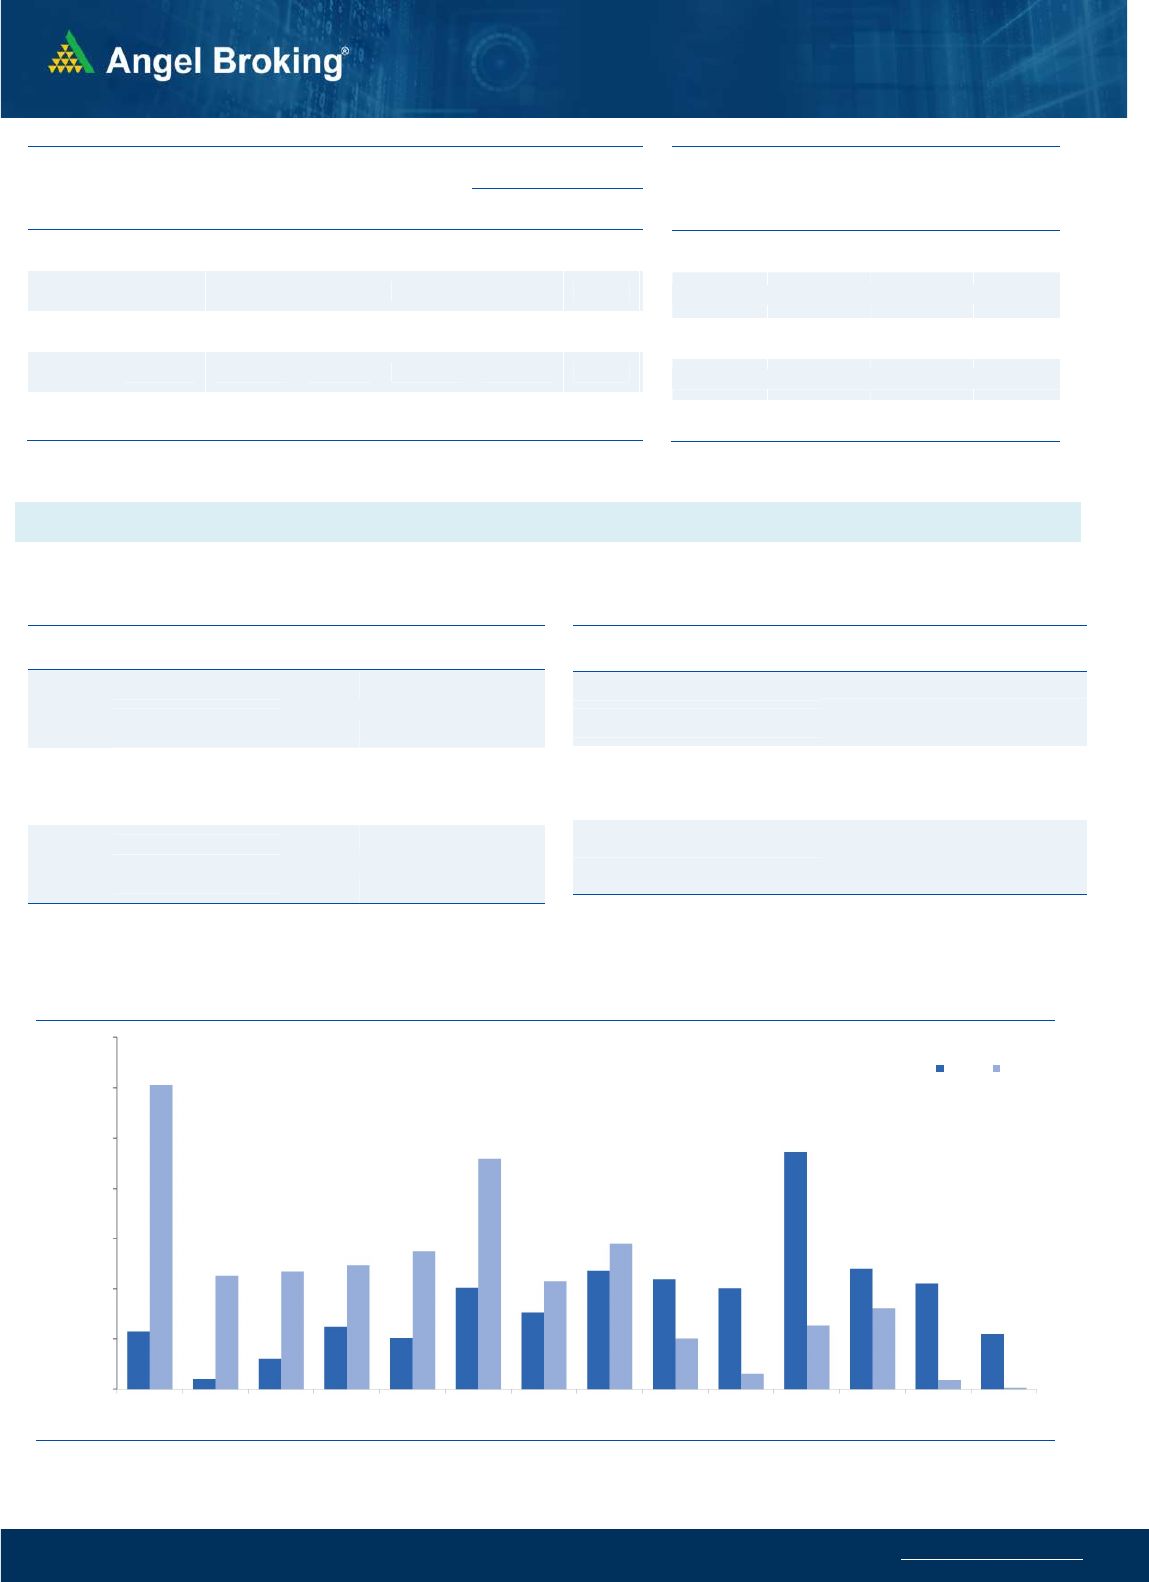
Nifty Vs OI
14900
15000
15100
15200
15300
15400
15500
15600
15700
15800
15900
,0
20,000
40,000
60,000
80,000
100,000
120,000
140,000
5/24 5/26 5/28 6/1 6/3 6/7 6/9
(`000)
Openinterest Nifty
View
Post Wednesday’s sell-off, we began the weekly expiry
day on a positive note and slowly inched higher during
the day to reclaim 15750 mark. Eventually, we
concluded the day in green with the gains of more than
100 points
FIIs were net buyers in the cash segment to the tune of
Rs. 1330 crores. In index futures front, they sold worth
Rs. 944 crores with some decline in open interest;
suggesting blend of long unwinding and short
formation in yesterday’s session.
Despite sharp sell-off on Wednesday, we hardly saw any
short formation in both the indices. Yesterday, Nifty
added good amount of fresh longs; whereas, short
covering was seen in banking index. In options front,
good amount of writing was seen in 15600 and 15700
put strikes. On the flip side, build-up was scattered
between 15700-16200 call options; wherein 16000 call
option added meaningful positions. Considering
yesterday’s development, we believe 15500-15600 is a
strong support zone and until we manage to hold same
traders are advised avoiding any bearish bets. On the
higher side, around 15800 is the immediate hurdle and
any upmove beyond this will open doors for next
psychological mark of 16000.
C
o
mme
n
t
s
The Nifty futures open interest has increased by 6.25%.
Bank Nifty futures open interest has decreased by 5.62%
as market closed at 15737.75 levels.
The Nifty June future closed with a premium of 15.50
point against a premium of 24.90 point in last trading
session. The July series closed at a premium of 77.05
point.
The INDIA VIX increased from 14.75 to 15.00.
At the same time, the PCR-OI of Nifty increased from
1.12 to 1.31.
Few of the liquid counters where we have seen high cost
of carry are IDEA, GMRINFRA, CADILAHC, DLF and
PIDILITIND
.
OI Gainers
SCRIP OI
OI
CHG. (%)
PRICE
PRICE
CHG. (%)
IBULHSGFIN 37745600 39.49 285.40 8.63
BATAINDIA 1361250 31.44 1632.15 4.91
NMDC 85498700 16.57 179.45 -0.28
EXIDEIND 14043600 15.96 192.20 -1.08
PNB 327936000 14.33 42.50 4.91
PIDILITIND 2615000 12.86 2132.25 2.78
DLF 33702900 11.89 313.65 5.64
HAVELLS 4595000 9.97 1023.80 -0.16
OI Losers
SCRIP OI
OI
CHG. (%)
PRICE
PRICE
CHG. (%)
MFSL 2542800 -11.41 1027.95 2.93
RBLBANK 25551900 -6.68 218.35 2.45
AARTIIND 1258850 -6.15 1827.80 1.76
BHEL 119857500 -5.96 75.80 1.54
TATACHEM 9019000 -5.51 748.20 1.31
CANBK 58498200 -5.24 156.95 0.38
MRF 52620 -4.81 82172.85 2.53
SAIL 155743000 -4.54 128.55 3.29
Put-Call Ratio
SCRIP PCR-OI PCR-VOL
NIFTY 1.31 1.00
BANKNIFTY 0.86 0.90
RELIANCE 0.45 0.31
ICICIBANK 0.49 0.41
INFY 0.51 0.44
Historical Volatility
SCRIP HV
LALPATHLAB 49.98
BATAINDIA 38.57
BAJFINANCE 58.19
IBULHSGFIN 91.24
GODREJCP 43.74
www.angelbroking.com
Technical & Derivatives Report
June 11, 2021
Note: Above mentioned Bullish or Bearish Spreads in Nifty (June Series) are given as an information and not as a recommendation.
Nifty Spot =
15737.75
FII Statistics for June 10, 2021
Detail Buy
Net Contracts
Open Interest
Sell
Value
(in Cr.)
Change
INDEX
FUTURES
2590.77 3535.04 (944.27) 118958 13340.05 (0.69)
INDEX
OPTIONS
882249.78 883234.59 (984.81) 670454 71993.45 (33.31)
STOCK
FUTURES
14201.29 12739.75 1461.54
1391237 111968.31 0.85
STOCK
OPTIONS
17792.28 17751.11 41.17
314792 24551.27 4.74
Total 916834.12
917260.49
(426.37) 2495441
221853.08
(11.04)
Turnover on June 10, 2021
Instru
ment
No. of
Contracts
Turnover
( in Cr. )
Change
(%)
Index Futures
2,27,936 22679.10 -33.89
Index Options
8,39,56,267 80,53,620.07 44.97
Stock Futures
7,81,588 63657.25 -25.50
Stock Options
24,94,419 2,06,762.66 -22.06
Total 8,74,60,210 83,46,719.08 40.51
Bull-Call Spreads
Action Strike Price Risk Reward BEP
Buy 15700 192.65
53.75 46.25 15753.75
Sell 15800 138.90
Buy 15700 192.65
98.30 101.70 15798.30
Sell 15900 94.35
Buy 15800 138.90
44.55 55.45 15844.55
Sell 15900 94.35
Bear-Put Spreads
Action Strike Price Risk Reward BEP
Buy 15700 143.90
36.35 63.65 15663.65
Sell 15600 107.55
Buy 15700 143.90
64.70 135.30 15635.30
Sell 15500 79.20
Buy 15600 107.55
28.35 71.65 15571.65
Sell 15500 79.20
Nifty Put-Call Analysis
,0
500,000
1000,000
1500,000
2000,000
2500,000
3000,000
3500,000
15000 15100 15200 15300 15400 15500 15600 15700 15800 15900 16000 16100 16200 16300
Call Put

www.angelbroking.com
Technical & Derivatives Report
June 11, 2021
Da
ily
Pivot Level
s for
Nifty Constituents
Scrips
S2
S1
PIVOT
R1
R2
ADANIPORTS
831
839
851
859
872
ASIANPAINT 2,905 2,928
2,944
2,966
2,982
AXISBANK
728
736
741
749
753
BAJAJ-AUTO 4,126 4,153
4,193
4,220
4,261
BAJFINANCE 5,521 5,804
5,959
6,242
6,397
BAJAJFINSV 11,193
11,593
11,900
12,301
12,608
BPCL
480
482
485
486
489
BHARTIARTL
537
541
544
549
552
BRITANNIA 3,524 3,550
3,581
3,607
3,638
CIPLA
955
964
970
979
985
COALINDIA
154
155
157
158
160
DIVISLAB 4,208 4,290
4,358
4,440
4,508
DRREDDY 5,207 5,250
5,275
5,317
5,342
EICHERMOT 2,653 2,679
2,717
2,743
2,781
GRASIM 1,469 1,481
1,499
1,511
1,529
HCLTECH
957
963
972
978
987
HDFCBANK 1,466 1,473
1,481
1,489
1,497
HDFCLIFE
681
685
688
693
696
HDFC 2,522 2,542
2,555
2,575
2,588
HEROMOTOCO 2,972 2,991
3,017
3,036
3,062
HINDALCO
381
383
387
389
392
HINDUNILVR 2,333 2,356
2,378
2,401
2,423
ICICIBANK
627
633
638
645
649
IOC
115
115
116
117
117
INDUSINDBK
997
1,011
1,020
1,033
1,042
INFY 1,414 1,419
1,424
1,429
1,434
ITC
206
207
209
211
213
JSW STEEL
689
698
708
717
727
KOTAKBANK 1,766 1,783
1,793
1,810
1,820
LT 1,504 1,512
1,523
1,531
1,542
M&M
799
803
807
811
815
MARUTI 7,112 7,156
7,218
7,262
7,323
NESTLEIND 17,389
17,472
17,574
17,657
17,759
NTPC
116
117
119
120
121
ONGC
121
123
124
125
126
POWERGRID
236
239
243
246
251
RELIANCE 2,144 2,164
2,197
2,216
2,249
SBILIFE
985
991
998
1,004
1,011
SHREECEM 27,486
27,856
28,490
28,860
29,494
SBIN
418
425
429
436
440
SUNPHARMA
669
672
677
680
685
TCS 3,180 3,199
3,211
3,230
3,242
TATACONSUM
695
702
710
716
725
TATAMOTORS
340
342
345
348
350
TATASTEEL 1,091 1,103
1,114
1,126
1,137
TECHM 1,048 1,056
1,065
1,074
1,083
TITAN 1,712 1,725
1,736
1,749
1,759
ULTRACEMCO 6,635 6,673
6,718
6,755
6,801
UPL
826
833
843
849
860
WIPRO
542
548
552
558
562

www.angelbroking.com
Technical & Derivatives Report
June 11, 2021
*
Research Team Tel: 022 – 39357600 (Extn. 6844) Website: www.angelbroking.com
DISCLAIMER
Angel Broking Limited (hereinafter referred to as “Angel”) is a registered Member of National Stock Exchange of India Limited,
Bombay Stock Exchange Limited and Metropolitan Stock Exchange Limited. It is also registered as a Depository Participant with CDSL
and Portfolio Manager and Investment Adviser with SEBI. It also has registration with AMFI as a Mutual Fund Distributor. Angel
Broking Limited is a registered entity with SEBI for Research Analyst in terms of SEBI (Research Analyst) Regulations, 2014 vide
registration number INH000000164. Angel or its associates has not been debarred/ suspended by SEBI or any other regulatory
authority for accessing /dealing in securities Market. Angel or its associates/analyst has not received any compensation / managed
or co-managed public offering of securities of the company covered by Analyst during the past twelve months.
This document is solely for the personal information of the recipient, and must not be singularly used as the basis of any investment
decision. Nothing in this document should be construed as investment or financial advice. Each recipient of this document should
make such investigations as they deem necessary to arrive at an independent evaluation of an investment in the securities of the
companies referred to in this document (including the merits and risks involved), and should consult their own advisors to determine
the merits and risks of such an investment.
Reports based on technical and derivative analysis center on studying charts of a stock's price movement, outstanding positions and
trading volume, as opposed to focusing on a company's fundamentals and, as such, may not match with a report on a company's
fundamentals. Investors are advised to refer the Fundamental and Technical Research Reports available on our website to evaluate
the contrary view, if any.
The information in this document has been printed on the basis of publicly available information, internal data and other reliable
sources believed to be true, but we do not represent that it is accurate or complete and it should not be relied on as such, as this
document is for general guidance only. Angel Broking Limited or any of its affiliates/ group companies shall not be in any way
responsible for any loss or damage that may arise to any person from any inadvertent error in the information contained in this
report. Angel Broking Limited has not independently verified all the information contained within this document. Accordingly, we
cannot testify, nor make any representation or warranty, express or implied, to the accuracy, contents or data contained within this
document. While Angel Broking Limited endeavors to update on a reasonable basis the information discussed in this material, there
may be regulatory, compliance, or other reasons that prevent us from doing so.
This document is being supplied to you solely for your information, and its contents, information or data may not be reproduced,
redistributed or passed on, directly or indirectly.
Technical and Derivatives Team:
Sameet Chavan Chief Analyst - Technical & Derivatives sameet.chavan@angelbroking.com
Ruchit Jain Senior Analyst - Technical & Derivatives ruchit.jain@angelbroking.com
Rajesh Bhosale Technical Analyst rajesh.bhosle@angelbroking.com
Sneha Seth Derivatives Analyst sneha.seth@angelbroking.com
