www.angelbroking.com
January
11
, 2021
Technical & Derivatives Report
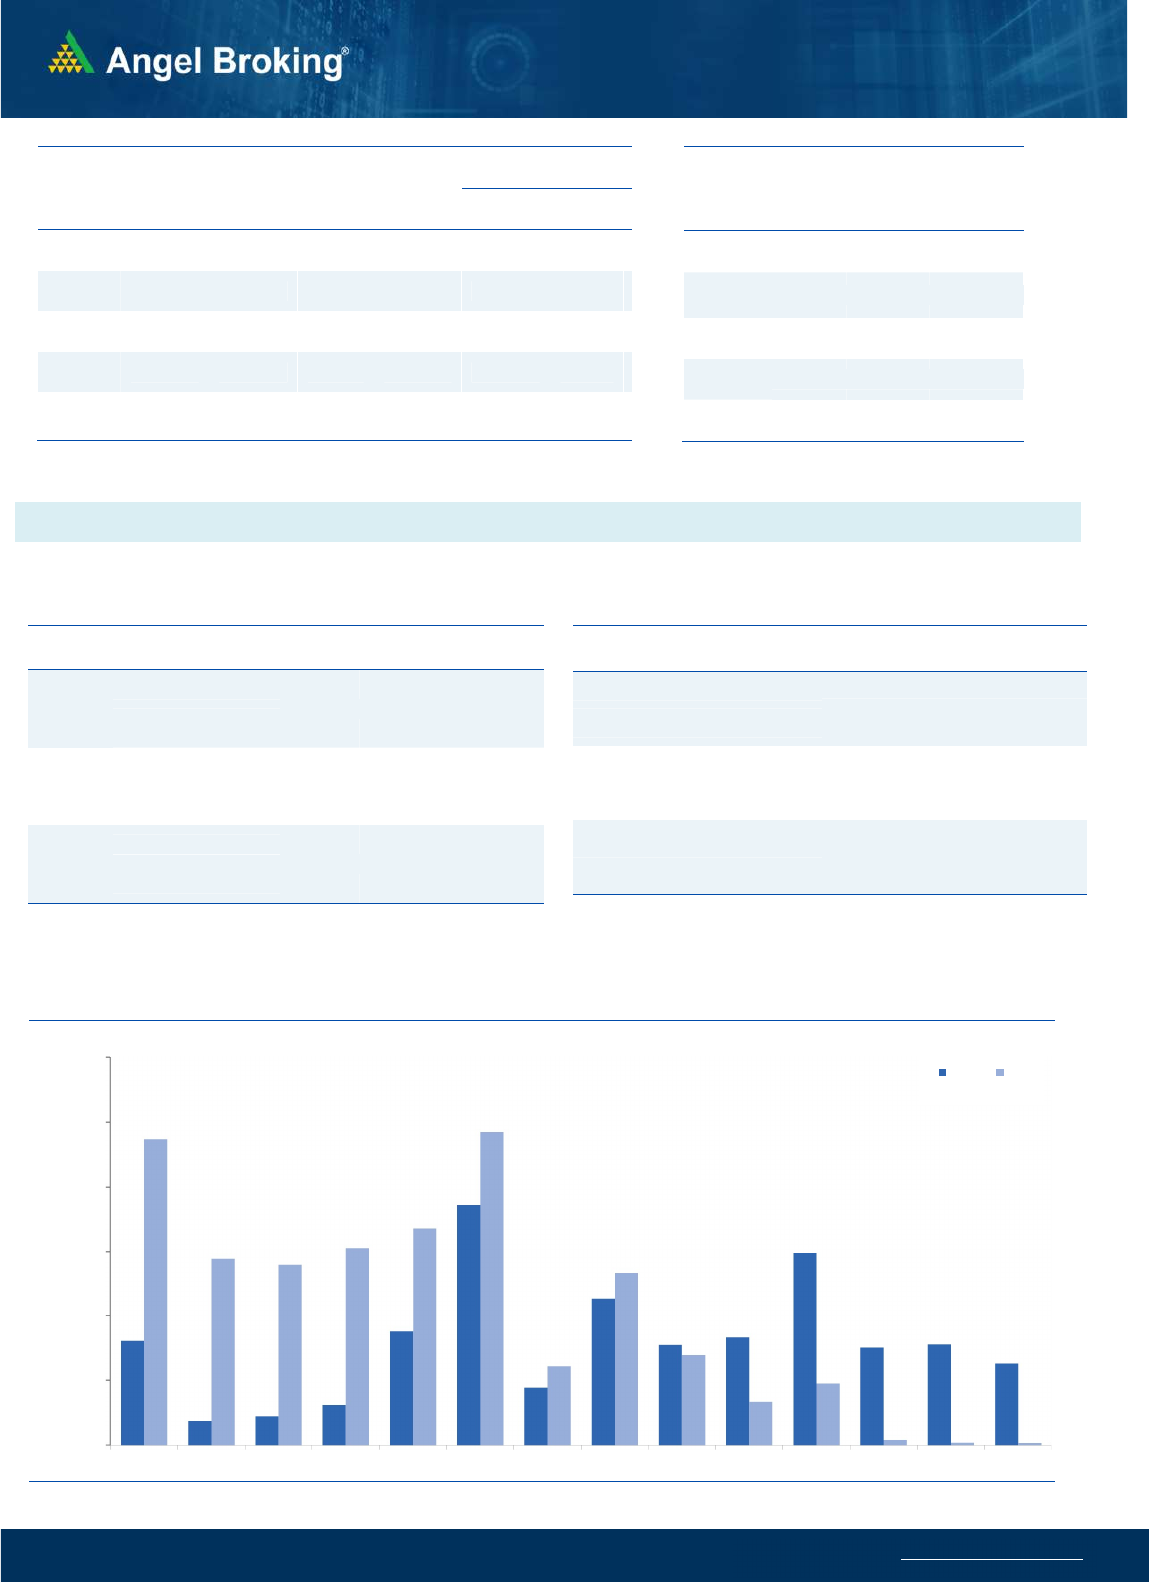
Nifty
Bank Out
look
-
(
32084
)
Along with the benchmark index Nifty, the bank index aswell
started with a huge gap up on Friday however unlike Nifty it lacked
follow-up buying and from the word go slipped lower to erase a
major part of opening gains. Bank Nifty eventually ended with
gains of 0.40% at 32084.
During the major part of the week, we
witnessed outperformance by the bank index however on Friday
we witnessed underperformance and this might be because the
bank index is approaching its crucial levels of the all-time high.
Throughout the week, we witnessed good stock-specific action on
both sides of the trend and this may remain the favor as the result
season kicks off. Traders are advised to follow the stock centric
levels are concerned, immediate support is placed around 31900
and 31550 levels whereas resistance is seen around 32350 and
32600 levels.
Key Levels
Support 1 – 31900 Resistance 1 – 32350
Support 2 – 31550 Resistance 2 – 32600
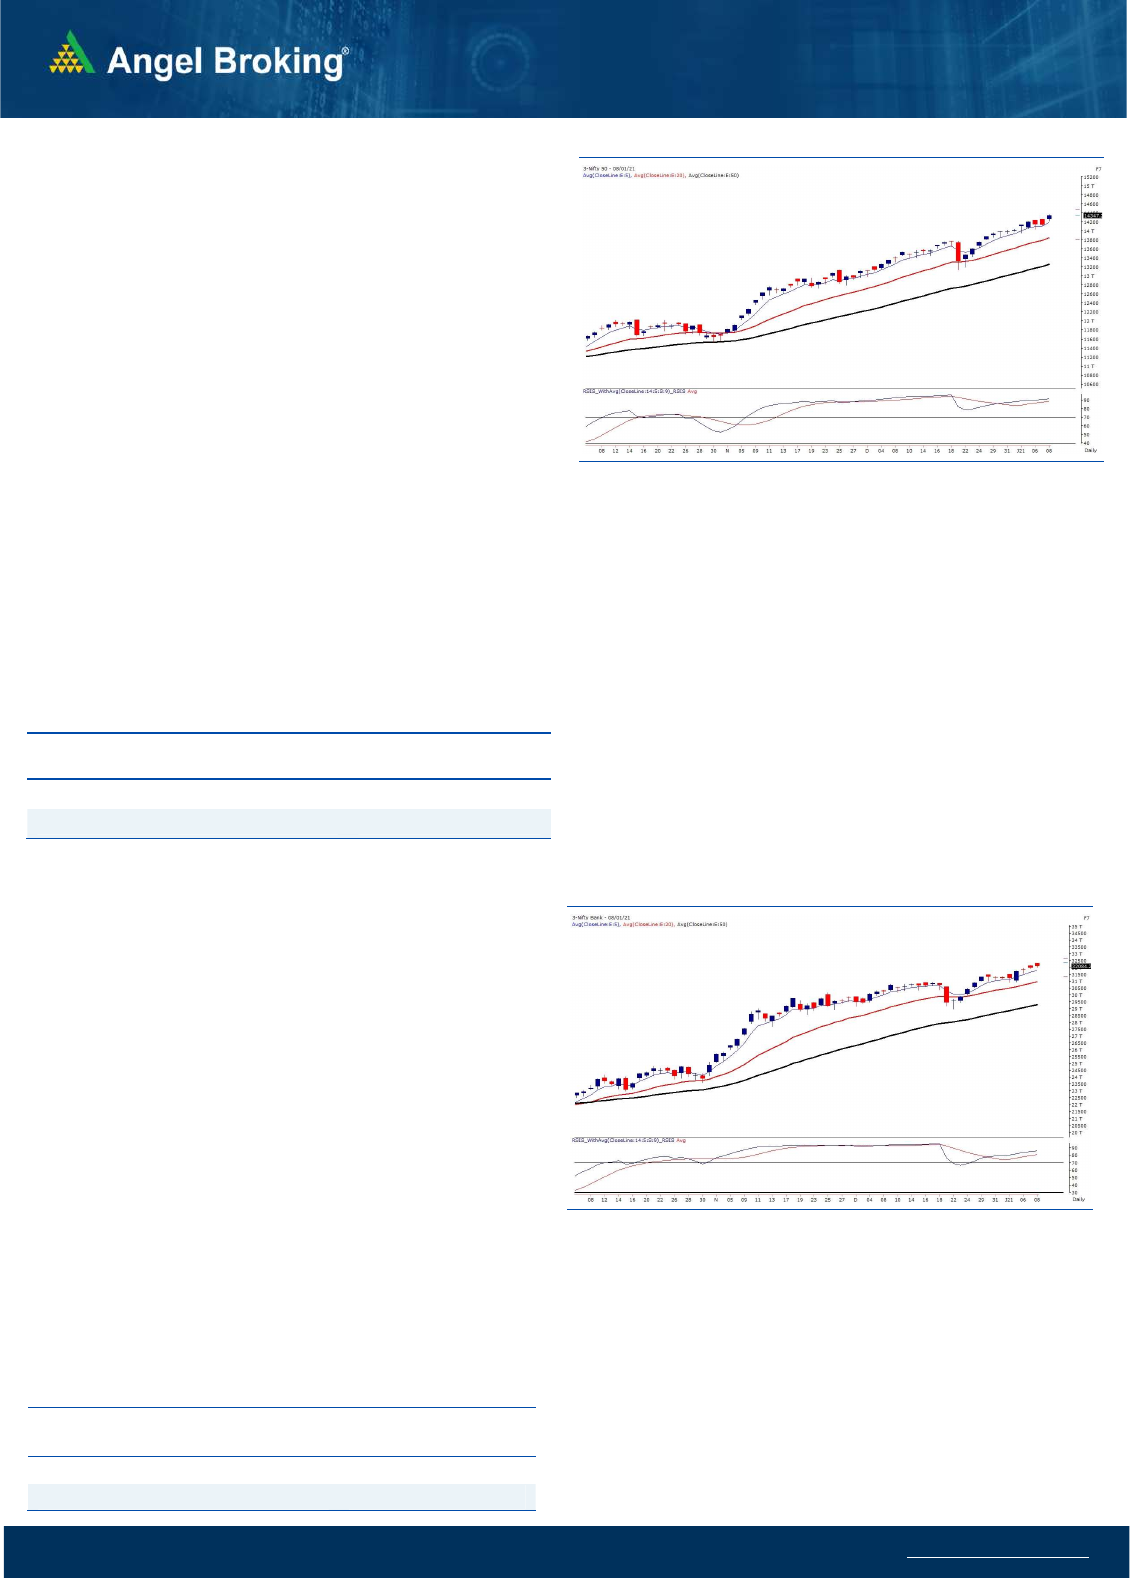
Exhibit 1: Nifty Daily Chart
Se
nsex
(
4878
3)
/ Nifty
(
1434
7
)
We had a head-start for the inaugural week of the calendar year 2021
mark and kept reaching new milestones as the week progressed.
During the mid-week, markets witnessed small intraday hiccups on
the back of some uncertainty with respect to the political
developments in United States. However, things settled down there
in the latter half of the week, which rejuvenated the US markets.
Hence, the smart rally in Nifty on Friday was mainly triggered by the
overall global optimism.
This has been one of the biggest as well as longest relentless rallies
in the history of Indian markets. Those who missed the bus, are
completely furious and at the same time, the set of contrarian traders
also must have gone for a toss. Honestly, as a momentum trader,
such rallies becomes extremely difficult to trade; because whenever
the short term tide reverses, it will catch lot of complacent traders
on the wrong foot. Nobody knows when it’s going to happen and till
the time we do not see any major reversal signs, better to be with
the flow by following strict money as well as risk management.
Key Levels
Support 1 – 14300 Resistance 1 – 14400
Support 2 – 14150 Resistance2 – 14550
As far as levels are concerned, we are in an uncharted territory and
hence, it’s better to go one step at a time. For this week, the
immediate levels can be seen around 14400 - 14550; whereas on
the lower side, the cluster of supports can be seen at 14300 - 14150
- 14000. The first sign of real weakness would come only below
14000 - 13900. At present, the ideal strategy for traders would be
to focus on individual stocks by following a strict exit strategy. We
would also advocate booking partial profits in this rally and avoiding
aggressive leveraged positions.
Exhibit 2: Nifty Bank Daily Chart

www.angelbroking.com
Technical & Derivatives Report
January 11
,
2021
Nifty Vs OI
12800
13000
13200
13400
13600
13800
14000
14200
14400
14600
,0
2,000
4,000
6,000
8,000
10,000
12,000
14,000
16,000
18,000
12/15 12/17 12/21 12/24 12/28 12/30 1/1 1/5 1/7
(`000)
Openinterest Nifty
View
Nifty continued to clock new records and ended the week
at its highest close ever around 14350.
FIIs were net buyers in the cash segment to the tune of Rs.
6030 crore. In index future segment, they bought worth Rs.
1133 crores with increase in open interest indicating long
formations on Friday.
Both Nifty as well as Bank Nifty witnessed addition of fresh
long positions during the week. FII’s continue with their
bullish positions in the index futures and added more long
positions during the week. Their ‘Long Short Ratio’ now
stands over 81 percent. In weekly options segment, we saw
unwinding of positions by call writers in 14200-14300
strikes whereas writing was seen in 14200 put option. The
above data continues to depict a bullish picture and hence,
traders are advised to continue to trade with a positive bias.
The immediate support on any declines in the coming week
will be seen around 14200 whereas we could see the index
approaching 14400-14500 zone.
C
o
mme
n
t
s
The Nifty futures open interest has increased by 8.43%
Bank Nifty futures open interest has decreased by 1.91%
as market closed at 14347.25 levels.
The Nifty January future closed with a premium of 23.65
point against a premium of 53.75 point in last trading
session. The February series closed at a premium of 54.35
point.
The INDIA VIX increased from 20.61 to 20.64.
At the same time, the PCR-OI of Nifty increased from 1.19
to 1.71.
Few of the liquid counters where we have seen high cost
of carry are IDEA, CANBK, PNB, AARTIIND AND ITC.
OI Gainers
SCRIP OI
OI
CHG. (%)
PRICE
PRICE
CHG. (%)
TORNTPOWER 5163000 42.58 335.95 1.06
CUMMINSIND 2474400 25.43 635.00 -1.00
COFORGE 594375 18.73 2804.10 2.24
LALPATHLAB 178750 16.07 2406.85 0.26
MINDTREE 1741600 9.45 1740.10 3.39
AARTIIND 372725 8.14 1280.40 0.03
SRTRANSFIN 4152000 7.54 1295.70 -0.58
GAIL 32384900 7.45 132.75 -0.60
OI Losers
SCRIP OI
OI
CHG. (%)
PRICE
PRICE
CHG. (%)
HINDALCO 22979200 -15.21 268.20 -1.68
GODREJCP 4934000 -14.12 750.35 1.83
ACC 2576000 -13.19 1761.25 3.14
MCDOWELL-N 10482500 -12.91 630.90 2.32
HDFCAMC 239000 -12.77 3137.75 1.96
BAJAJFINSV 790375 -11.52 9171.55 1.65
SIEMENS 765050 -9.14 1654.85 1.14
SBILIFE 5386500 -7.21 935.45 2.00
Put-Call Ratio
SCRIP PCR-OI PCR-VOL
NIFTY 1.71 0.85
BANKNIFTY 1.04 0.96
RELIANCE 0.51 0.33
ICICIBANK 0.62 0.51
INFY 0.47 0.29
Historical Volatility
SCRIP HV
WIPRO 42.85
TECHM 44.42
MARUTI 46.68
MRF 37.03
INFY 42.14
www.angelbroking.com
Technical & Derivatives Report
January 11
,
2021
Note: Above mentioned Bullish or Bearish Spreads in Nifty (January Series) are given as an information and not as a recommendation.
Nifty Spot =
14347.25
FII Statistics for January 08, 2020
Detail Buy
Net Contracts
Open Interest
Sell
Value
(in Cr.)
Change
INDEX
FUTURES
4145.78
3012.83
1132.95
140549
14319.13
7.34
INDEX
OPTIONS
178302.83
178305.08
(2.25) 728008
72839.53
22.42
STOCK
FUTURES
13553.16
12868.25
684.91
1204560
100588.00
0.29
STOCK
OPTIONS
8114.87
8237.23
(122.36) 125333
10248.04
8.90
Total 204116.64
202423.39
1693.25
2198450
197994.70
7.67
Turnover on January 08, 2020
Instrument
No. of
Contracts
Turnover
( in Cr. )
Change
(%)
Index Futures 2,88,876 27220.96 11.22
Index
Options
1,63,74,823
15,22,636.79
-73.86
Stock
Futures
8,61,954 73120.08 0.41
Stock
Options
17,10,561
1,50,002.15
16.22
Total
1,92,36,214
17,72,979.98
-70.70
Bull-Call Spreads
Action Strike Price Risk Reward BEP
Buy 14400 214.05
50.45 49.55 14450.45
Sell 14500 163.60
Buy 14400 214.05
91.55 108.45 14491.55
Sell 14600 122.50
Buy 14500 163.60
41.10 58.90 14541.10
Sell 14600 122.50
Bear-Put Spreads
Action Strike Price Risk Reward BEP
Buy 14300 204.10
34.00 66.00 14266.00
Sell 14200 170.10
Buy 14300 204.10
64.20 135.80 14235.80
Sell 14100 139.90
Buy 14200 170.10
30.20 69.80 14169.80
Sell 14100 139.90
Nifty Put-Call Analysis
,0
500,000
1000,000
1500,000
2000,000
2500,000
3000,000
13500 13600 13700 13800 13900 14000 14100 14200 14300 14400 14500 14600 14700 14800
Call Put

www.angelbroking.com
Technical & Derivatives Report
January 11
,
2021
Da
ily
Pivot Level
s for
Nifty Constituents
Scrips
S2
S1
PIVOT
R1
R2
ADANIPORTS
507
512
520
525
532
ASIANPAINT 2,767 2,806
2,828
2,867
2,889
AXISBANK
663
668
673
678
684
BAJAJ-AUTO 3,397 3,463
3,504
3,570
3,610
BAJFINANCE 4,991 5,036
5,088
5,133
5,184
BAJAJFINSV 8,811 8,991
9,128
9,308
9,445
BPCL
388
394
400
406
412
BHARTIARTL
530
535
542
548
555
BRITANNIA 3,509 3,542
3,566
3,599
3,623
CIPLA
819
829
837
847
856
COALINDIA
135
138
139
141
143
DIVISLAB 3,787 3,823
3,846
3,882
3,905
DRREDDY 5,245 5,292
5,326
5,373
5,407
EICHERMOT 2,621 2,691
2,731
2,801
2,841
GAIL
130
131
133
134
136
GRASIM
975
990
1,007
1,021
1,039
HCLTECH
956
975
989
1,009
1,023
HDFCBANK 1,413 1,423
1,432
1,441
1,451
HDFCLIFE
702
709
716
723
730
HDFC 2,611 2,634
2,654
2,678
2,698
HEROMOTOCO 3,027 3,094
3,130
3,197
3,233
HINDALCO
260
264
269
273
279
HINDUNILVR 2,345 2,368
2,384
2,407
2,423
ICICIBANK
531
537
542
547
553
IOC
94
95
96
97
97
INDUSINDBK
905
923
949
967
993
INFY 1,264 1,288
1,302
1,327
1,341
ITC
197
199
203
205
208
JSW STEEL
392
397
404
409
416
KOTAKBANK 1,935 1,953
1,964
1,982
1,994
LT 1,332 1,353
1,368
1,389
1,404
M&M
735
753
763
781
791
MARUTI 7,432 7,723
7,892
8,183
8,352
NESTLEIND 17,869
18,088
18,219
18,438
18,569
NTPC
96
98
99
101
102
ONGC
97
99
1
00
102
103
POWERGRID
195
199
202
206
208
RELIANCE 1,902 1,918
1,928
1,944
1,954
SBILIFE
900
918
936
954
973
SHREECEM 24,565
25,189
25,584
26,209
26,604
SBIN
281
284
288
290
294
SUNPHARMA
597
609
616
628
635
TCS 3,035 3,078
3,103
3,1
46
3,171
TATAMOTORS
195
196
199
201
203
TATASTEEL
690
702
715
726
739
TECHM
984
1,018
1,039
1,072
1,093
TITAN 1,508 1,528
1,542
1,562
1,576
ULTRACEMCO 5,345 5,468
5,541
5,664
5,737
UPL
477
490
498
512
519
WIPRO
398
414
423
439
449

www.angelbroking.com
Technical & Derivatives Report
January 11
,
2021
*
Research Team Tel: 022 – 39357600 (Extn. 6844) Website: www.angelbroking.com
For Derivatives Queries E-mail: derivatives.desk@angelbroking.com
DISCLAIMER
Angel Broking Limited (hereinafter referred to as “Angel”) is a registered Member of National Stock Exchange of India Limited, Bombay
Stock Exchange Limited and Metropolitan Stock Exchange Limited. It is also registered as a Depository Participant with CDSL and
Portfolio Manager and Investment Adviser with SEBI. It also has registration with AMFI as a Mutual Fund Distributor. Angel Broking
Limited is a registered entity with SEBI for Research Analyst in terms of SEBI (Research Analyst) Regulations, 2014 vide registration
number INH000000164. Angel or its associates has not been debarred/ suspended by SEBI or any other regulatory authority for
accessing /dealing in securities Market. Angel or its associates/analyst has not received any compensation / managed or co-managed
public offering of securities of the company covered by Analyst during the past twelve months.
This document is solely for the personal information of the recipient, and must not be singularly used as the basis of any investment
decision. Nothing in this document should be construed as investment or financial advice. Each recipient of this document should make
such investigations as they deem necessary to arrive at an independent evaluation of an investment in the securities of the companies
referred to in this document (including the merits and risks involved), and should consult their own advisors to determine the merits
and risks of such an investment.
Reports based on technical and derivative analysis center on studying charts of a stock's price movement, outstanding positions and
trading volume, as opposed to focusing on a company's fundamentals and, as such, may not match with a report on a company's
fundamentals. Investors are advised to refer the Fundamental and Technical Research Reports available on our website to evaluate the
contrary view, if any.
The information in this document has been printed on the basis of publicly available information, internal data and other reliable
sources believed to be true, but we do not represent that it is accurate or complete and it should not be relied on as such, as this
document is for general guidance only. Angel Broking Limited or any of its affiliates/ group companies shall not be in any way
responsible for any loss or damage that may arise to any person from any inadvertent error in the information contained in this report.
Angel Broking Limited has not independently verified all the information contained within this document. Accordingly, we cannot
testify, nor make any representation or warranty, express or implied, to the accuracy, contents or data contained within this document.
While Angel Broking Limited endeavors to update on a reasonable basis the information discussed in this material, there may be
regulatory, compliance, or other reasons that prevent us from doing so.
This document is being supplied to you solely for your information, and its contents, information or data may not be reproduced,
redistributed or passed on, directly or indirectly.
Technical and Derivatives Team:
Sameet Chavan Chief Analyst - Technical & Derivatives sameet.chavan@angelbroking.com
Ruchit Jain Senior Analyst - Technical & Derivatives ruchit.jain@angelbroking.com
Rajesh Bhosale Technical Analyst rajesh.bhosle@angelbroking.com
Sneha Seth Derivatives Analyst sneha.seth@angelbroking.com
