www.angelbroking.com
Technical & Derivatives Report
October 09, 2020
Nifty
Bank Out
look
-
(
23191
)
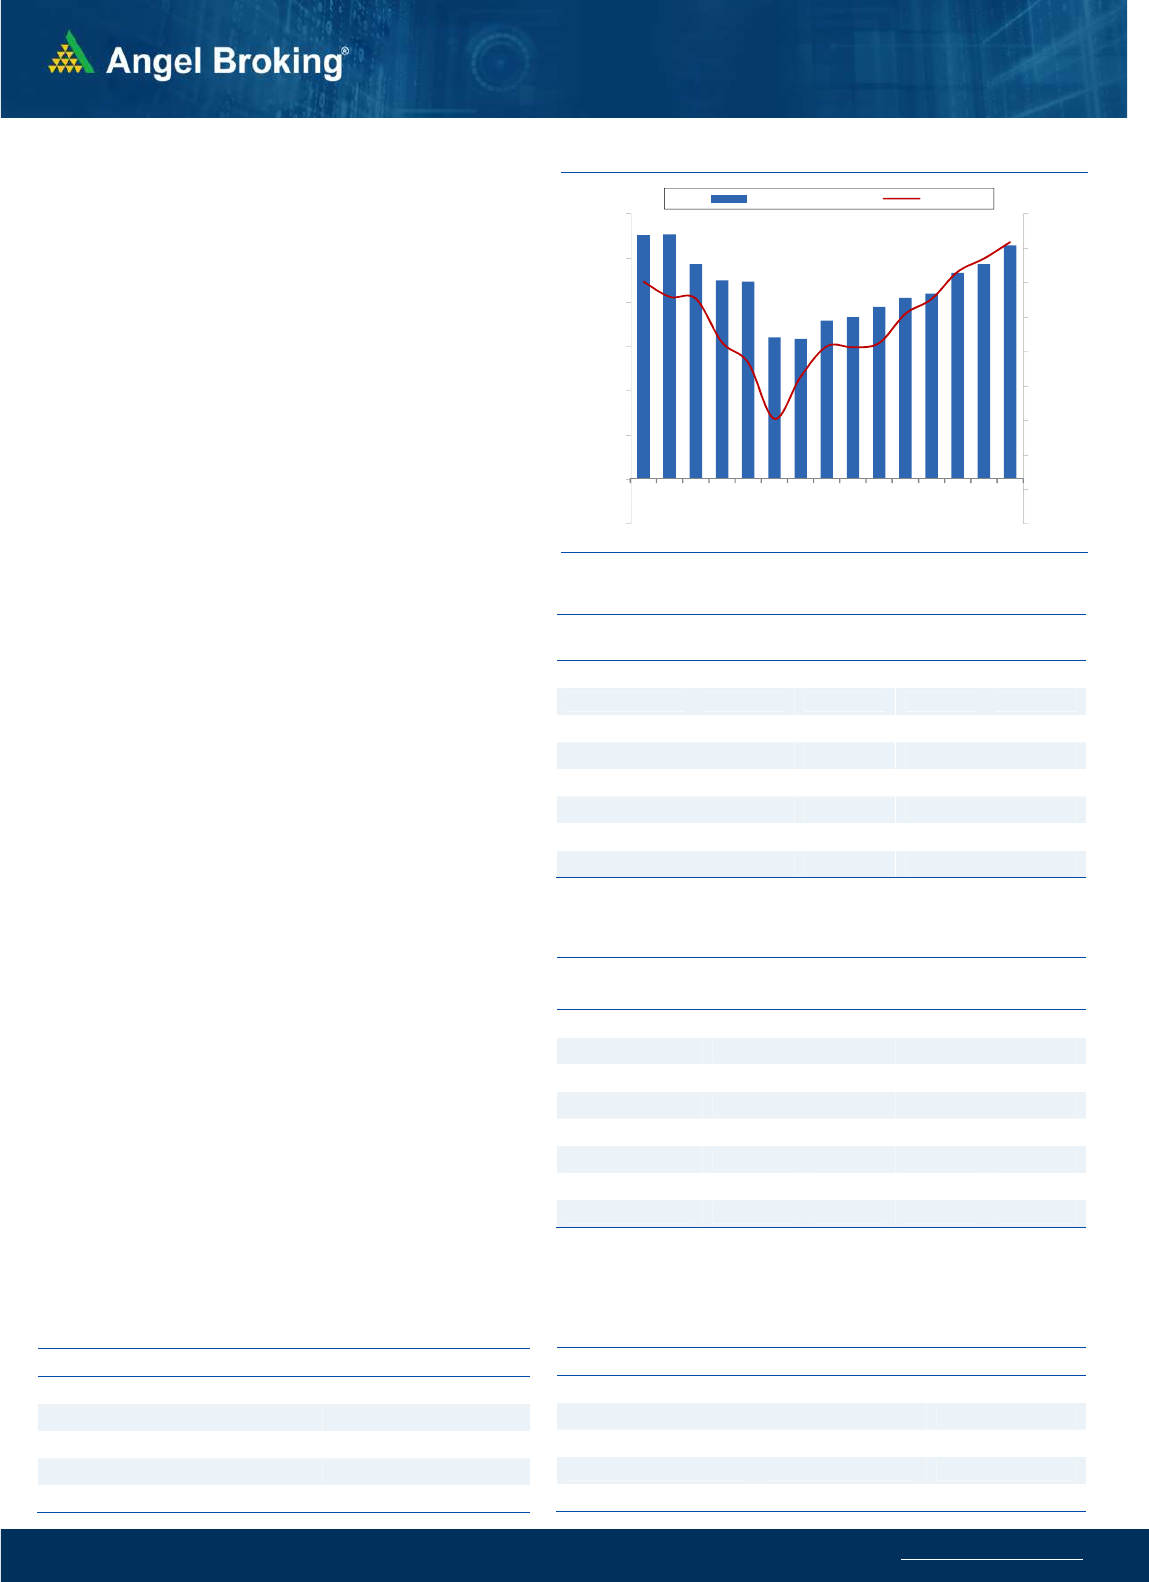
For the fifth straight session, the banking index opened higher in
tandem with the benchmark. Post the gap up opening, BANKNIFTY
consolidated with a positive bias and post the mid session, it started
moving higher to head towards the immediate zone of 23400-
23500. However, the expiry factor played out during the penultimate
hour as we witnessed a sudden nosedive in the market. Within a
blink of an eye, markets were significantly off highs. Eventually, due
to minor recovery towards the fag end, the index concluded the
weekly expiry at the 23200 mark.
Since the last week or so, we have been witnessing a relentless run in
the market and mostly the pessimistic traders were getting caught
on the wrong foot. But yesterday at one point, it appeared as if the
market is in no mood to correct and when everything looks hunky
dory, the market tends to surprise the complacent bulls. This is
exactly what we witnessed yesterday in the latter half. Now with
yesterday’s volatile swings, the daily chart depicts a ‘Shooting Star’
pattern precisely at the 61.8% retracement of the recent down move.
Key Levels
Support 1 – 23050 Resistance 1 – 23350
Support 2 – 22600 Resistance 2 – 23500
Exhibit 1: Nifty Daily Chart
Se
nsex
(
40183)
/ Nifty
(
11835
)
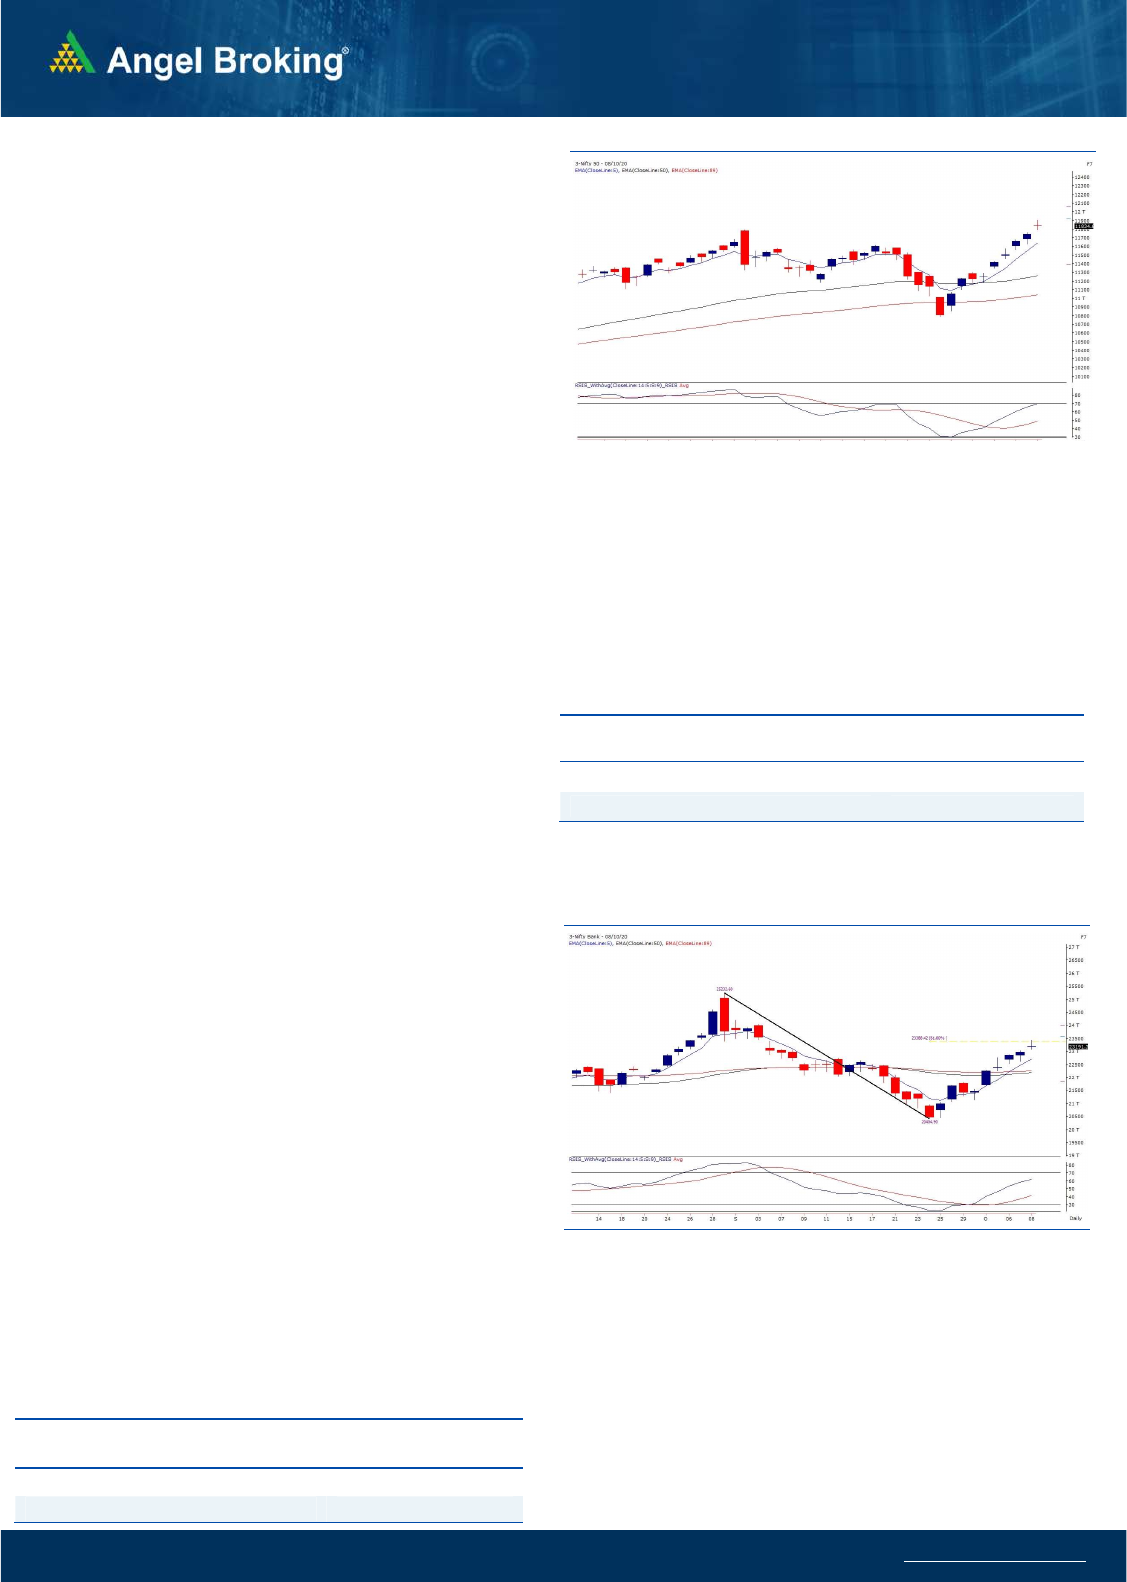
Nifty started the session with another gap up opening well above the
11800 mark. It continued the momentum and even tested 11900;
however, some profit booking was seen in the penultimate hour due to
which the index gave up some of the gains and ended around the
opening levels, up by almost 100 points.
The U.S. markets had a run up overnight and amongst our domestic
news flows, the IT giant TCS announced its quarterly results which
obliged the market participants. This resulted in optimism at the open
and hence, we witnessed another gap up opening. Although the index
rallied to test the 11900 mark, the participation from the broader
markets was missing as the midcap stocks had a quiet day. Infact, we
witnessed some decent profit booking in the later half which resulted
in formation of a ‘Doji’ (indecisive) candlestick on the daily chart of
Nifty. If we look at this week’s overall price action so far, the indices
have rallied due to participation from the heavyweights (especially IT)
while the midcap index has consolidated within a range. The Nifty
Midcap50 index is at its crucial point around a trendline resistance
which is arrived by joining recent intermediate highs. If the index
manages to surpass this hurdle which is placed around 4775, then only
we should see a continuation of the rally from the broader markets.
However, until then its better to avoid aggressive bets and rather look
for stock specific opportunities which are participating in this upmove.
As far as index levels are concerned, the 20 EMA on the hourly chart
has not been breached in the recent upmove which is placed around
11745 and is seen as important support whereas the immediate
resistances are seen around 11900 and 12000 mark.
Exhibit 2: Nifty Bank Daily Chart
While IT space took the leadership again at the open to take the
benchmark higher, the midcap stocks witnessed some profit booking
and the Pharma names were buzzing in the closing hour. This indicates
more of a stock specific action in the market and hence, traders are
advised to focus on such stock specific moves from a trading
perspective. As mentioned above, the Midcap index is at a crucial point
and hence, traders should look to participate in this space only on a
breakout above the mentioned resistance level.
.Key Levels
Support 1 – 11780 Resistance 1 – 11900
Support 2 – 11745 Resistance2 – 12000
Hence, a sustainable move below 23050 would probably apply
some brakes on the recent optimism; whereas on the upside,
23350 – 23500 are the levels to watch out for. Above 23500, the
bulls would be back in the driver’s seat.
www.angelbroking.com
Technical & Derivatives Report
October
09, 2020
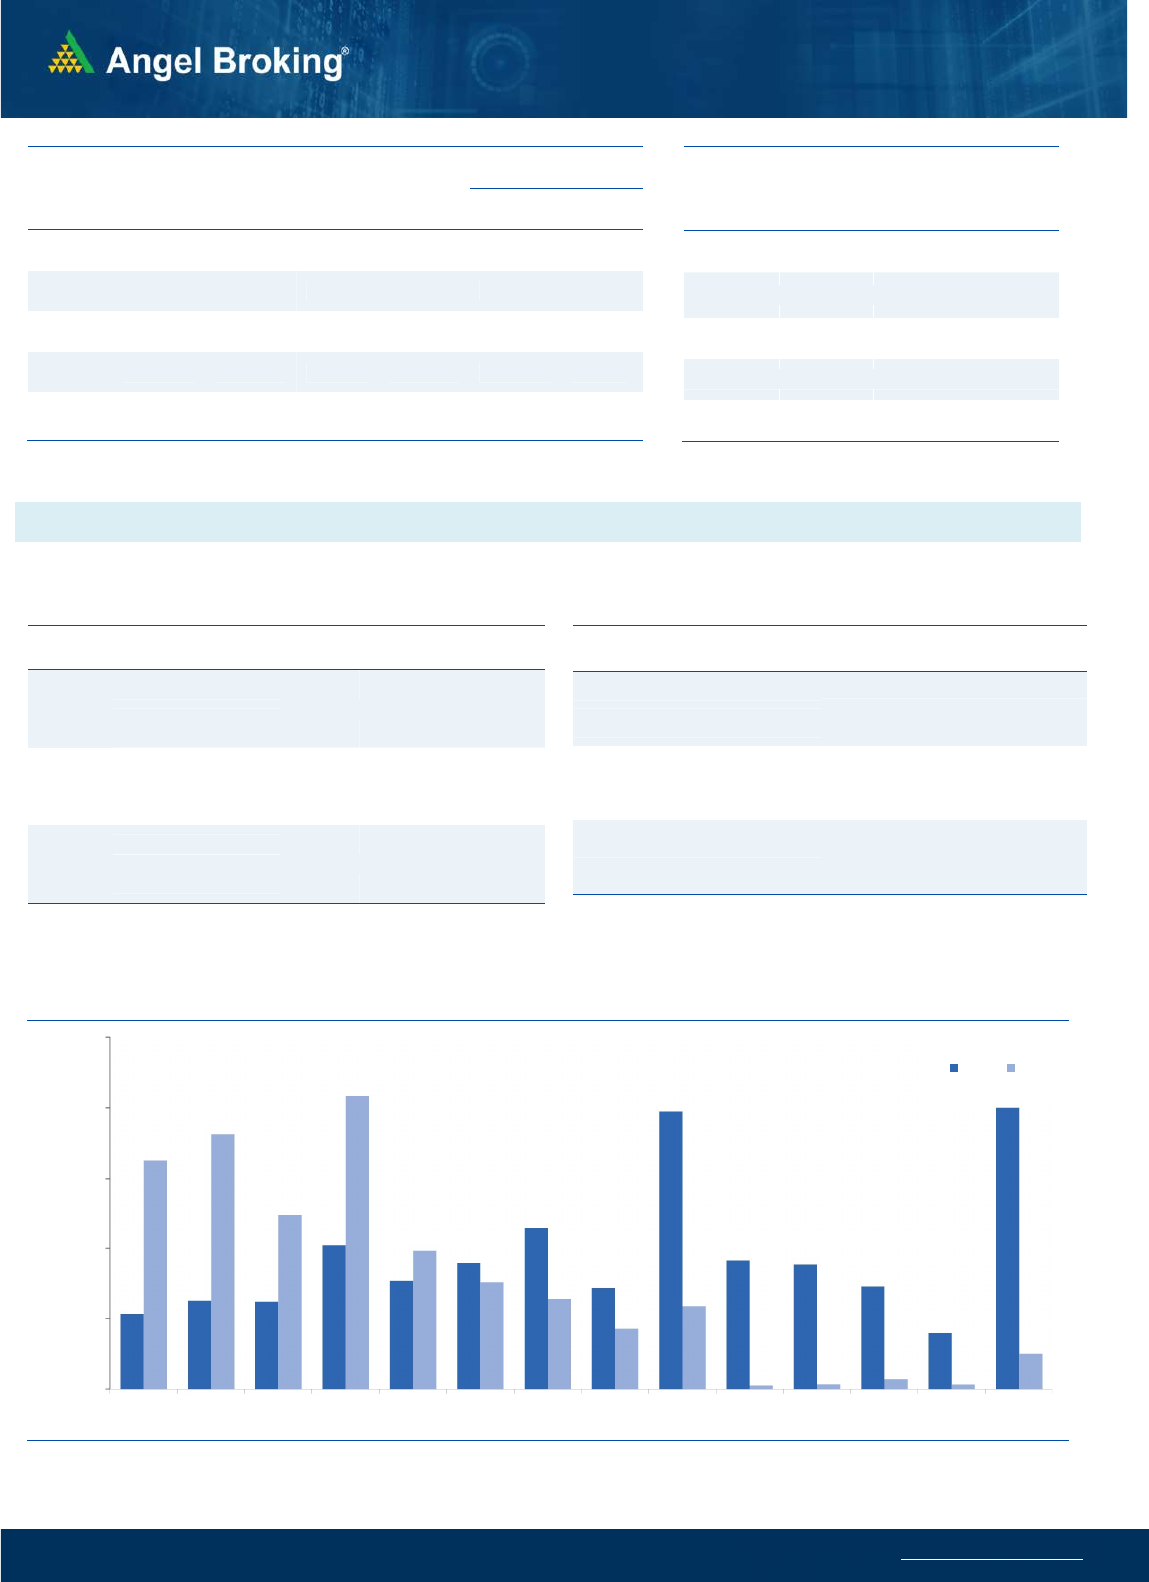
Nifty Vs OI
10200
10400
10600
10800
11000
11200
11400
11600
11800
12000
,0
2,000
4,000
6,000
8,000
10,000
12,000
14,000
9/16 9/18 9/23 9/25 9/29 10/1 10/6 10/8
(`000)
Openinterest Nifty
View
s
Once again we started off the session with an
upside gap
and saw follow up buying to rally almost
towards 11900 mark. In the latter half, some profit
booking was seen from the higher levels to drag index
slightly below 11800; however, some recovery in the
end led closing at 11834.60.
FIIs continued pouring liquidity in cash market; they
bought equities worth Rs. 978. In index future
segment, they bought worth Rs. 1399 crores with huge
amount of rise in open interest for the second
consecutive session, indicating formation of long
positions in yesterday’s trading session.
The recent upmove was supported by meaningful
longs in Nifty; whereas, banking index rallied mainly
due to short covering. In Nifty options front, the
overall build-up was scattered between 11900-12500
call and 11500-11900 put options. Maximum open
interest concentration in the coming weekly series is
now placed at 12500 call and 11500 put options. Due
to the profit booking in the latter half, the Nifty futures
traded in discount. The overall data remains positive;
we would advise traders to prefer trading in individual
counters for the better the risk and reward ratio.
C
o
mme
n
t
s
The Nifty futures open interest has increased by 7.30%
Bank Nifty futures open interest has increased by 2.50%
as market closed at 11834.60 levels.
The Nifty October future closed with a discount of 2.80
point against a premium of 12.05 point in last trading
session. The November series closed at a premium of
20.15 point.
The INDIA VIX has increased from 20.06 to 20.38.
At the same time, the PCR-OI of Nifty decreased from
1.58 to 1.46.
Few of the liquid counters where we have seen high
cost of carry are JINDALSTEL, SAIL, LUPIN, DIVISLAB
and IDEA.
OI Gainers
SCRIP OI
OI
CHG. (%)
PRICE
PRICE
CHG. (%)
MOTHERSUMI 25669000 12.00 120.15 2.72
GODREJPROP 758550 11.25 925.45 2.73
BIOCON 14301400 8.46 469.15 3.66
IBULHSGFIN 15503100 7.94 149.10 -0.96
DRREDDY 3020250 7.88 5194.45 1.84
RAMCOCEM 1499400 6.91 769.35 0.45
AMARAJABAT 1045000 6.20 735.40 -0.56
VEDL 91437600 5.51 117.90 -4.22
OI Losers
SCRIP OI
OI
CHG. (%)
PRICE
PRICE
CHG. (%)
TCS 7069800 -10.98 2825.70 2.71
WIPRO 26537600 -8.84 359.45 7.01
SUNTV 3873000 -7.85 466.60 0.70
IGL 6967125 -6.55 390.75 1.45
TECHM 10983600 -5.77 860.30 1.34
HINDUNILVR 6788400 -5.45 2160.80 0.74
COFORGE 550875 -5.16 2467.30 2.76
ADANIENT 19396000 -4.17 316.25 -4.23
Put-Call Ratio
SCRIP PCR-OI PCR-VOL
NIFTY 1.46 1.01
BANKNIFTY 1.02 0.91
RELIANCE 0.54 0.44
ICICIBANK 0.77 0.48
INFY 0.50 0.35
Historical Volatility
SCRIP HV
WIPRO 45.14
CADILAHC 43.73
CIPLA 44.71
MINDTREE 59.32
TCS 40.86
www.angelbroking.com
Technical & Derivatives Report
October
09, 2020
Note: Above mentioned Bullish or Bearish Spreads in Nifty (October Series) are given as an information and not as a recommendation.
Nifty Spot =
11834.60
FII Statistics for October 08, 2020
Detail Buy
Net Contracts
Open Interest
Sell
Value
(in Cr.)
Change
INDEX
FUTURES
4840.99 3442.15 1398.84
153525 12161.59 21.89
INDEX
OPTIONS
348948.78 347237.17 1711.61
753719 62367.72 (16.65)
STOCK
FUTURES
16096.54 16333.85 (237.31) 1124747 80333.87 0.99
STOCK
OPTIONS
6389.91 6437.50 (47.59) 81576 6319.17 7.12
Total 376276.22
373450.67
2825.55
2113567
161182.35
(4.80)
Turnover on October 08, 2020
Instrument
No. of
Contracts
Turnover
( in Cr. )
Change
(%)
Index Futures
4,47,144 31101.29 1.38
Index Options
6,46,23,189 44,02,488.99 104.15
Stock Futures
8,16,556 65882.59 14.57
Stock Options
12,94,313 1,10,380.60 12.44
Total 6,71,81,202 46,09,853.47 96.76
Bull-Call Spreads
Action Strike Price Risk Reward BEP
Buy 11800 217.15
53.55 46.45 11853.55
Sell 11900 163.60
Buy 11800 217.15
97.85 102.15 11897.85
Sell 12000 119.30
Buy 11900 163.60
44.30 55.70 11944.30
Sell 12000 119.30
Bear-Put Spreads
Action Strike Price Risk Reward BEP
Buy 11800 185.55
37.00 63.00 11763.00
Sell 11700 148.55
Buy 11800 185.55
68.45 131.55 11731.55
Sell 11600 117.10
Buy 11700 148.55
31.45 68.55 11668.55
Sell 11600 117.10
Nifty Put-Call Analysis
,0
500,000
1000,000
1500,000
2000,000
2500,000
11200 11300 11400 11500 11600 11700 11800 11900 12000 12100 12200 12300 12400 12500
Call Put

www.angelbroking.com
Technical & Derivatives Report
October
09, 2020
Da
ily
Pivot Level
s for
Nifty Constituents
Scrips
S2
S1
PIVOT
R1
R2
ADANIPORTS
353
356
360
363
366
ASIANPAINT 2,054 2,071
2,090
2,107
2,125
AXISBANK
439
446
454
460
468
BAJAJ-AUTO 3,019 3,047
3,079
3,107
3,139
BAJFINANCE 3,253 3,290
3,339
3,376
3,425
BAJAJFINSV 5,738 5,805
5,919
5,986
6,100
BPCL
333
337
341
344
348
BHARTIARTL
410
417
426
434
443
BRITANNIA 3,744 3,769
3,797
3,823
3,851
CIPLA
760
786
801
826
841
COALINDIA
111
112
114
115
116
DIVISLAB 3,137 3,184
3,220
3,267
3,302
DRREDDY 4,996 5,095
5,155
5,254
5,314
EICHERMOT 2,132 2,170
2,214
2,252
2,295
GAIL
82
83
85
86
88
GRASIM
752
761
768
777
784
HCLTECH
823
836
858
871
892
HDFCBANK 1,146 1,169
1,186
1,209
1,226
HDFCLIFE
573
578
582
587
592
HDFC 1,909 1,929
1,959
1,979
2,009
HEROMOTOCO 3,212 3,246
3,269
3,303
3,326
HINDALCO
169
172
174
177
179
HINDUNILVR 2,139 2,150
2,157
2,168
2,176
ICICIBANK
380
384
387
391
394
IOC
74
75
75
76
77
INDUSINDBK
599
608
623
633
648
INFY 1,066 1,080
1,102
1,116
1,138
ITC
165
166
168
169
172
JSW STEEL
282
288
293
298
304
KOTAKBANK 1,294 1,307
1,324
1,337
1,354
LT
870
875
885
890
900
M&M
621
628
634
641
648
MARUTI 6,961 7,021
7,080
7,140
7,199
NESTLEIND 15,951
16,128
16,229
16,406
16,507
NTPC
82
82
83
83
84
ONGC
66
67
69
70
72
POWERGRID
156
157
159
160
162
RELIANCE 2,197 2,218
2,243
2,264
2,289
SBILIFE
807
814
825
832
843
SHREECEM 20,332
20,534
20,692
20,894
21,052
SBIN
187
189
193
195
198
SUNPHARMA
506
515
521
529
535
TCS 2,752 2,789
2,837
2,874
2,922
TATAMOTORS
137
139
141
143
145
TATASTEEL
365
369
376
381
387
TECHM
839
849
869
879
898
TITAN 1,221 1,238
1,250
1,267
1,279
ULTRACEMCO 4,161 4,253
4,307
4,399
4,453
UPL
499
504
512
517
525
WIPRO
337
348
358
369
379

www.angelbroking.com
Technical & Derivatives Report
October
09, 2020
*
Research Team Tel: 022 – 39357600 (Extn. 6844) Website: www.angelbroking.com
For Technical Queries E-mail: technicalresearch-cso@angelbroking.com
DISCLAIMER
Angel Broking Limited (hereinafter referred to as “Angel”) is a registered Member of National Stock Exchange of India Limited,
Bombay Stock Exchange Limited and Metropolitan Stock Exchange Limited. It is also registered as a Depository Participant with CDSL
and Portfolio Manager and Investment Adviser with SEBI. It also has registration with AMFI as a Mutual Fund Distributor. Angel
Broking Limited is a registered entity with SEBI for Research Analyst in terms of SEBI (Research Analyst) Regulations, 2014 vide
registration number INH000000164. Angel or its associates has not been debarred/ suspended by SEBI or any other regulatory
authority for accessing /dealing in securities Market. Angel or its associates/analyst has not received any compensation / managed
or co-managed public offering of securities of the company covered by Analyst during the past twelve months.
This document is solely for the personal information of the recipient, and must not be singularly used as the basis of any investment
decision. Nothing in this document should be construed as investment or financial advice. Each recipient of this document should
make such investigations as they deem necessary to arrive at an independent evaluation of an investment in the securities of the
companies referred to in this document (including the merits and risks involved), and should consult their own advisors to determine
the merits and risks of such an investment.
Reports based on technical and derivative analysis center on studying charts of a stock's price movement, outstanding positions and
trading volume, as opposed to focusing on a company's fundamentals and, as such, may not match with a report on a company's
fundamentals. Investors are advised to refer the Fundamental and Technical Research Reports available on our website to evaluate
the contrary view, if any.
The information in this document has been printed on the basis of publicly available information, internal data and other reliable
sources believed to be true, but we do not represent that it is accurate or complete and it should not be relied on as such, as this
document is for general guidance only. Angel Broking Limited or any of its affiliates/ group companies shall not be in any way
responsible for any loss or damage that may arise to any person from any inadvertent error in the information contained in this
report. Angel Broking Limited has not independently verified all the information contained within this document. Accordingly, we
cannot testify, nor make any representation or warranty, express or implied, to the accuracy, contents or data contained within this
document. While Angel Broking Limited endeavors to update on a reasonable basis the information discussed in this material, there
may be regulatory, compliance, or other reasons that prevent us from doing so.
This document is being supplied to you solely for your information, and its contents, information or data may not be reproduced,
redistributed or passed on, directly or indirectly.
Technical and Derivatives Team:
Sameet Chavan Chief Analyst - Technical & Derivatives sameet.chavan@angelbroking.com
Ruchit Jain Senior Analyst - Technical & Derivatives ruchit.jain@angelbroking.com
Rajesh Bhosale Technical Analyst rajesh.bhosle@angelbroking.com
Sneha Seth Derivatives Analyst sneha.seth@angelbroking.com
