www.angelbroking.com
Technical & Derivatives Report
September 08, 2020
Nifty
Ba
nk Out
look
-
(
22945
)
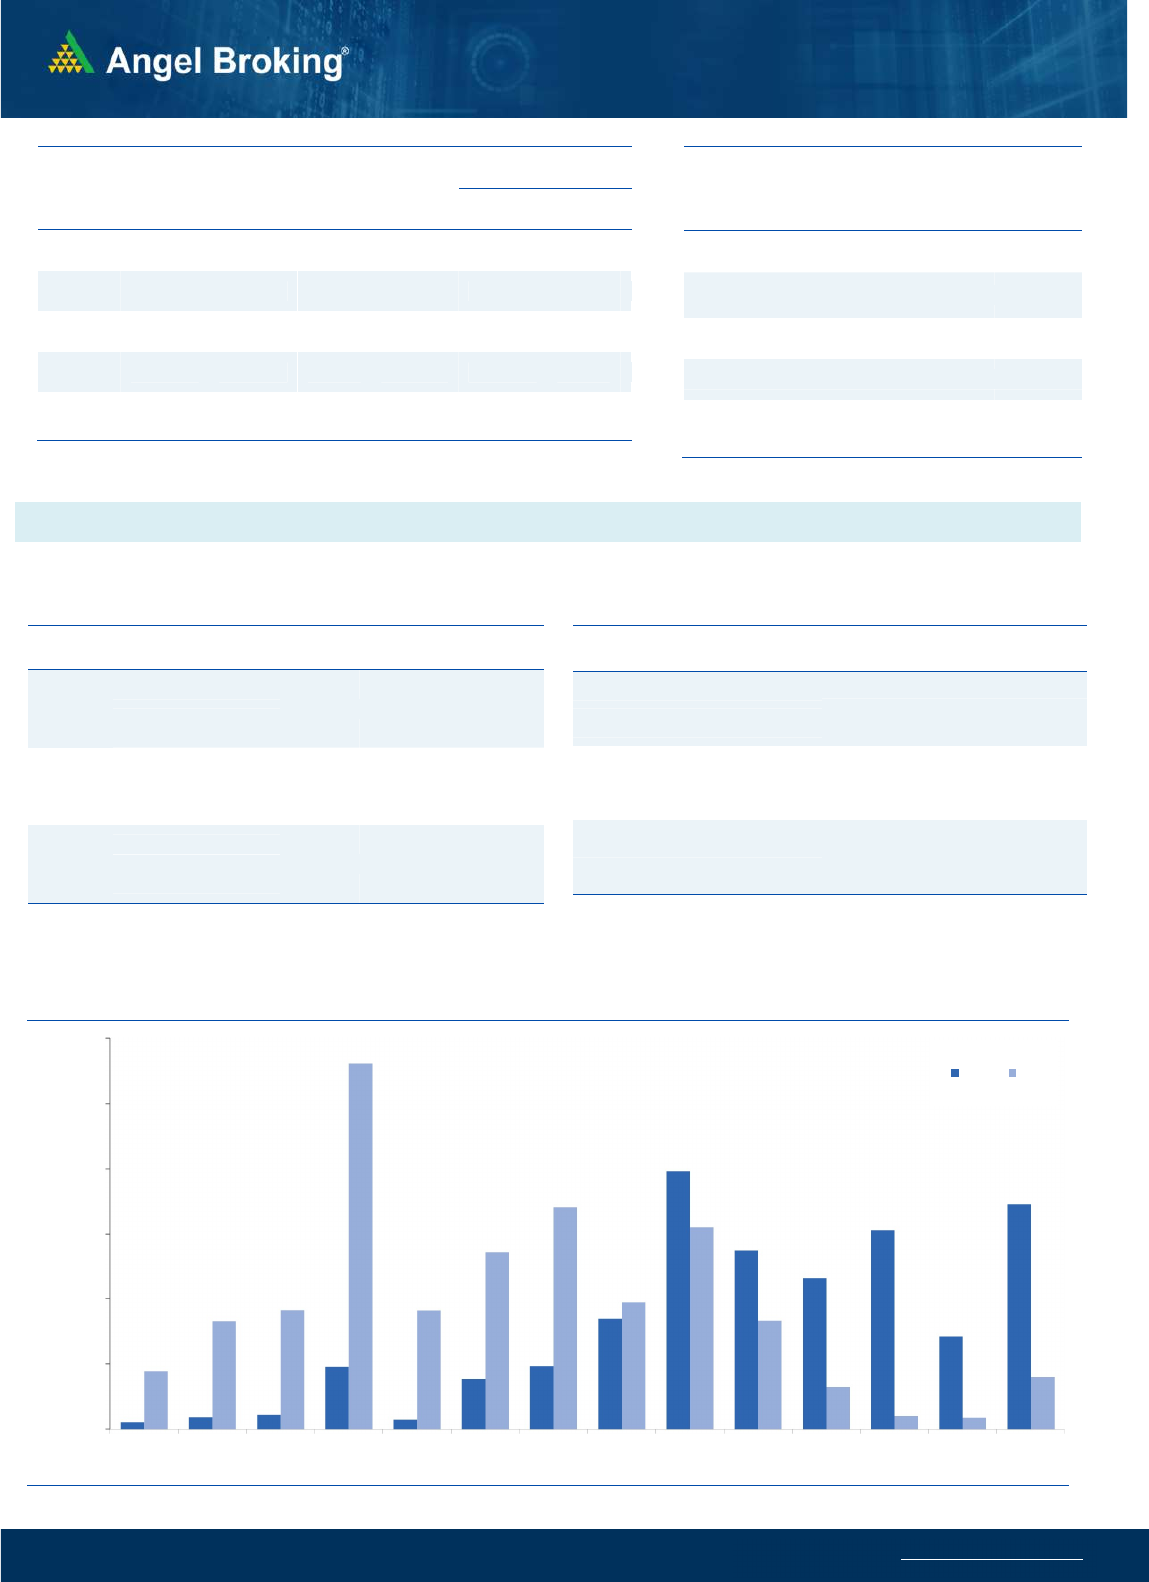
The banking index too opened on a flat note in line with our
benchmark. During the initial hour, the Bank Nifty corrected sharply
over a percent due to some nervousness in heavyweight banking
counters. However, the weakness was short lived as prices rebounded
sharply from lows. Such swings on both sides were witnessed on more
than a couple of occasions during the session. Eventually, the late
surge in banking conglomerates led to a flat close tad below the
23000 mark. Yesterday’s session was certainly not easy for traders as
the market itself looked quite unsure where it wants to go. The only
encouraging factor during the session was a smart recovery towards
the fag end in some of the heavyweights. Technically speaking, we are
trading around the cluster of multiple supports i.e. a pull back move
of the recent upmove towards breakout points and on hourly chart, a
sacrosanct support of ‘200-SMA’. Hence the coming session would be
quite interesting for Bank Nifty. If it stays beyond 23200, we are likely
to see an extended move towards 23400-23600 levels; whereas on
the lower side, 22850 followed by 22700 are likely to provide decent
support.
Key Levels
Support 1 – 22850 Resistance 1 – 23400
Support 2 – 22700 Resistance 2 – 23600
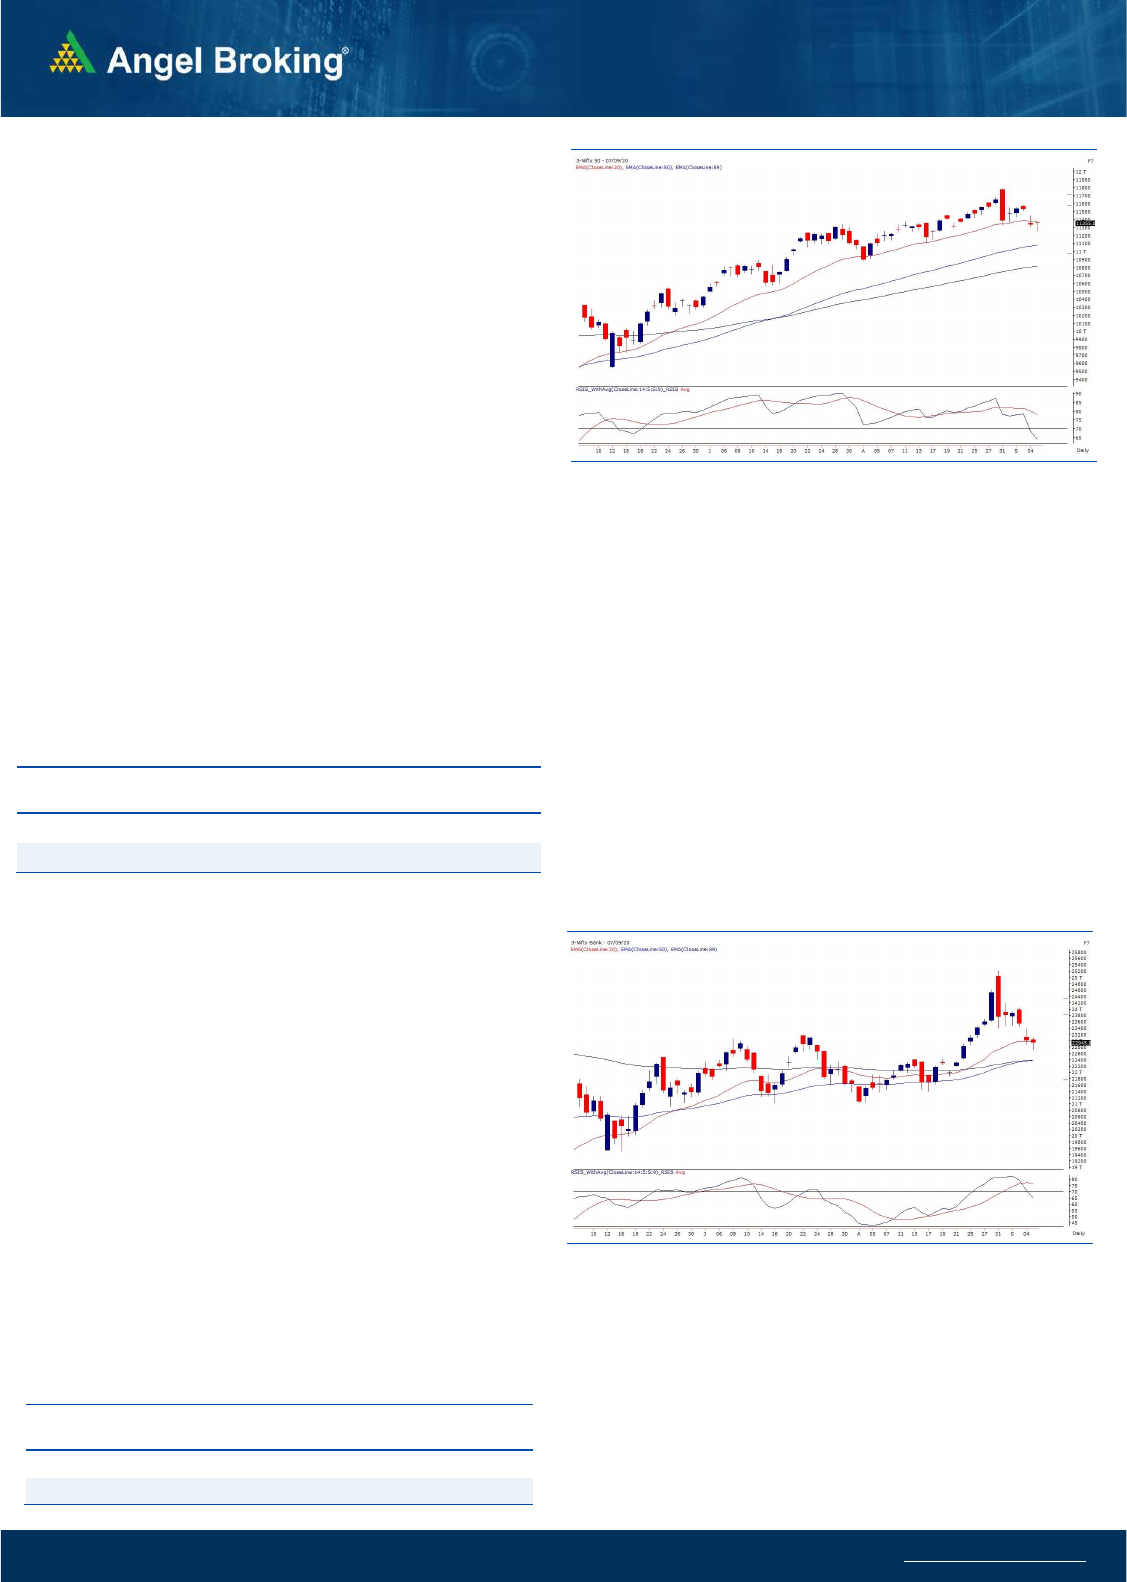
Exhibit 1: Nifty Daily Chart
Se
nsex
(
38417)
/ Nifty
(
11355
)
Nifty started trading for the week on a flat note, but it corrected in first
half an hour and registered a low around the 11250 mark. It then
recovered gradually and oscillated within a range throughout. An
upmove in the last half an hour resulted in the index closing tad below
the high point of the day with marginal gains.
It seems that the weak closing of the previous week had an impact on
the first half an hour of the trade yesterday. The index corrected as it
sneaked below the previous week’s low; however, it stabilized post that
half an hour and then we witnessed some consolidation during the day.
On the intraday chart, we observed a bullish ‘Wolfe Wave’ pattern on the
Nifty around 11250 and the index precisely recovered from that support.
As per the pattern on the weekly chart, the indices have probably entered
into a corrective phase which could be a price wise or a time wise
correction. However, since it is just a corrective phase within an uptrend,
there would be stock specific trading opportunities on both the sides of
the trade. Short-term traders are advised to capitalize on such
opportunities, but trade with a proper exit strategy as well. As far as index
levels are concerned, yesterday’s low of 11250 (Wolfe wave support)
followed by 11133 (potential reversal zone of ab=cd harmonic pattern
on the hourly chart) are the supports for Nifty, whereas immediate
resistances are seen around 11400 and 11450.
.Key Levels
Support 1 – 11250 Resistance 1 – 11400
Support 2 – 11133 Resistance 2 – 11450
Exhibit 2: Nifty Bank Daily Chart

www.angelbroking.com
Technical & Derivatives Report
September 08, 2020
Nifty Vs OI
11100
11200
11300
11400
11500
11600
11700
,0
2,000
4,000
6,000
8,000
10,000
12,000
14,000
16,000
8/20 8/21 8/24 8/25 8/26 8/27 8/28 8/31 9/1 9/2 9/3 9/4 9/7
(`000)
Openinterest Nifty
View
s
We began the week on a positive note but as the day
progressed index wipe-off all the early morning gains
to correct towards 11250 mark. However, some buying
interest from the lower level led recovery of more than
100 points to conclude the session tad above 11350
mark.
FIIs activity in cash market segment remained muted. In
index futures, they bought worth Rs. 653 crores with rise
in open interest which clearly suggests formation of
long positions.
On Monday, the overall open interest activity in Nifty
futures remained insignificant; however, the banking
index added good amount of positions. In options front,
build-up was scattered between 11300-11700 call and
10800-11300 put options. Stronger hands added
decent longs in index futures and considering BankNifty
open interest addition, it seems they forming bullish
bets on the banking space. At present, 11250-11300 is
an important support zone for the benchmark index;
whereas, strong resistance is placed around 11500-
11600 zone. Considering the above data points, trader’s
are advised to wait for fresh build-up in Nifty before
initating any directional trades and instead prefer
trading in individual counters where opportunities
could be there on both the sides.
C
o
mme
n
t
s
The Nifty futures open interest has decreased by 0.07%
Bank Nifty futures open interest has increased by 5.17%
as market closed at 11355.05 levels.
The Nifty September future closed with a premium of
10.85 point against a premium of 17.90 point in last
trading session. The October series closed at a premium
of 25.95 point.
The INDIA VIX has decreased from 22.15 to 22.01.
At the same time, the PCR-OI of Nifty decreased from
1.22 to 1.21.
Few of the liquid counters where we have seen high cost
of carry are PNB, RELIANCE, GODREJCP, NTPC and
NMDC.
OI Gainers
SCRIP OI
OI
CHG. (%)
PRICE
PRICE
CHG. (%)
IDEA 429380000 17.74 12.30 1.66
INFRATEL 15646400 10.50 231.00 5.74
TORNTPHARM 1211500 10.34 2782.55 0.48
ACC 2468000 7.07 1339.90 2.32
INDIGO 2581500 6.08 1229.35 -1.81
BAJAJFINSV 767875 4.74 6263.65 -0.40
TORNTPOWER 2349000 4.54 331.70 -0.54
PETRONET 11205000 4.39 236.90 0.55
OI Losers
SCRIP OI
OI
CHG. (%)
PRICE
PRICE
CHG. (%)
RAMCOCEM 1175550 -10.83 721.35 0.93
BALKRISIND 1675200 -9.90 1266.00 -1.87
GODREJCP 4498000 -8.48 651.70 -0.42
NTPC 44066700 -7.48 92.40 -2.36
MUTHOOTFIN 3373500 -7.01 1094.65 -2.58
SHREECEM 161750 -5.35 19783.30 -1.23
CONCOR 5195412 -4.70 385.65 -1.75
ESCORTS 2701600 -2.19 1145.95 -3.24
Put-Call Ratio
SCRIP PCR-OI PCR-VOL
NIFTY 1.22 0.83
BANKNIFTY 0.76 0.89
RELIANCE 0.54 0.46
ICICIBANK 0.47 0.52
INFY 0.48 0.37
Historical Volatility
SCRIP HV
INFRATEL 74.36
M&M 51.80
DRREDDY 36.93
NTPC 40.17
MANAPPURAM 75.06
www.angelbroking.com
Technical & Derivatives Report
September 08, 2020
Note: Above mentioned Bullish or Bearish Spreads in Nifty (September Series) are given as an information and not as a recommendation.
Nifty Spot =
11355.05
FII Statistics for September 07, 2020
Detail Buy
Net Contracts
Open Interest
Sell
Value
(in Cr.)
Change
INDEX
FUTURES
3912.47 3259.48 652.99
127505 10075.36 1.29
INDEX
OPTIONS
177589.05 177921.78 (332.73) 771241 59530.96 11.44
177589.05
STOCK
FUTURES
11255.08 11304.87 (49.79) 1201720 84822.62 0.62
STOCK
OPTIONS
4821.99 4868.22 (46.23) 87284 6140.92 4.50
Total 197578.59
197354.35
224.24
2187750
160569.86
4.39
197578.59
Turnover on September 07, 2020
Instrument
No. of
Contracts
Turnover
( in Cr. )
Change
(%)
Index Futures 4,14,893 28002.47 -23.19
Index Options 1,68,79,945 11,84,664.92 3.13
Stock Futures 6,23,052 45188.04 -23.02
Stock Options 9,06,408 70035.35 -16.11
Total 1,88,24,298 13,27,890.78 0.04
Bull-Call Spreads
Action Strike Price Risk Reward BEP
Buy 11300 237.30
55.00 45.00 11355.00
Sell 11400 182.30
Buy 11300 237.30
103.40 96.60 11403.40
Sell 11500 133.90
Buy 11400 182.30
48.40 51.60 11448.40
Sell 11500 133.90
Bear-Put Spreads
Action Strike Price Risk Reward BEP
Buy 11300 168.35
35.10 64.90 11264.90
Sell 11200 133.25
Buy 11300 168.35
60.40 139.60 11239.60
Sell 11100 107.95
Buy 11200 133.25
25.30 74.70 11174.70
Sell 11100 107.95
Nifty Put-Call Analysis
,0
500,000
1000,000
1500,000
2000,000
2500,000
3000,000
10700 10800 10900 11000 11100 11200 11300 11400 11500 11600 11700 11800 11900 12000
Call Put

www.angelbroking.com
Technical & Derivatives Report
September 08, 2020
Da
ily
Pivot Level
s for
Nifty Constituents
Scrips
S2
S1
PIVOT
R1
R2
ADANIPORTS
342
347
352
358
363
ASIANPAINT 1,922 1,952
1,978
2,008
2,034
AXISBANK
442
451
459
467
475
BAJAJ-AUTO 2,802 2,850
2,878
2,927
2,955
BAJFINANCE 3,386 3,446
3,537
3,597
3,689
BAJAJFINSV 6,138 6,201
6,275
6,338
6,412
BPCL
388
394
402
409
417
BHARTIARTL
500
508
518
526
536
INFRATEL
209
220
228
239
246
BRITANNIA 3,615 3,669
3,710
3,764
3,805
CIPLA
692
705
719
731
746
COALINDIA
129
131
132
134
135
DRREDDY 4,243 4,331
4,384
4,472
4,524
EICHERMOT 2,129 2,161
2,188
2,220
2,247
GAIL
92
94
96
98
100
GRASIM
677
689
705
716
732
HCLTECH
680
694
703
718
727
HDFCBANK 1,089 1,100
1,110
1,120
1,130
HDFC
562
577
586
601
609
HEROMOTOCO 1,743 1,767
1,784
1,808
1,826
HINDALCO 2,799 2,830
2,882
2,913
2,965
HINDUNILVR
184
186
189
190
193
ICICIBANK 2,077 2,120
2,147
2,190
2,217
IOC
365
369
373
377
381
INDUSINDBK
80
82
84
85
87
INFY
583
596
610
623
638
ITC
907
916
922
931
936
JSW STEEL
177
183
187
193
197
KOTAKBANK
275
281
284
290
293
LT 1,345 1,357
1,368
1,380
1,391
M&M
899
915
933
950
968
MARUTI
588
599
617
628
645
NESTLEIND 7,042 7,126
7,213
7,296
7,384
NTPC 15,754
16,079
16,297
16,622
16,840
ONGC
90
91
93
95
97
POWERGRID
75
75
77
78
79
RELIANCE
171
174
175
178
179
SHREECEM 2,016 2,049
2,078
2,111
2,139
SBIN 19,363
19,573
19,846
20,056
20,329
SUNPHARMA
203
206
208
210
212
TCS
498
506
512
520
526
TATAMOTORS 2,258 2,292
2,318
2,353
2,378
TATASTEEL
146
148
150
152
154
TECHM
413
418
423
428
433
TITAN
727
737
744
755
762
ULTRACEMCO 1,137 1,153
1,164
1,180
1,192
UPL 3,718 3,783
3,887
3,952
4,056
VEDANTA
479
487
499
506
518
WIPRO
269
274
277
282
285
ZEEL
212
218
222
228
232

www.angelbroking.com
Technical & Derivatives Report
September 08, 2020
*
Research Team Tel: 022 – 39357600 (Extn. 6844) Website: www.angelbroking.com
For Technical & Derivatives Queries E-mail: technicalresearch-cso@angelbroking.com
DISCLAIMER
Angel Broking Limited (hereinafter referred to as “Angel”) is a registered Member of National Stock Exchange of India Limited, Bombay
Stock Exchange Limited and Metropolitan Stock Exchange Limited. It is also registered as a Depository Participant with CDSL and
Portfolio Manager and Investment Adviser with SEBI. It also has registration with AMFI as a Mutual Fund Distributor. Angel Broking
Limited is a registered entity with SEBI for Research Analyst in terms of SEBI (Research Analyst) Regulations, 2014 vide registration
number INH000000164. Angel or its associates has not been debarred/ suspended by SEBI or any other regulatory authority for
accessing /dealing in securities Market. Angel or its associates/analyst has not received any compensation / managed or co-managed
public offering of securities of the company covered by Analyst during the past twelve months.
This document is solely for the personal information of the recipient, and must not be singularly used as the basis of any investment
decision. Nothing in this document should be construed as investment or financial advice. Each recipient of this document should make
such investigations as they deem necessary to arrive at an independent evaluation of an investment in the securities of the companies
referred to in this document (including the merits and risks involved), and should consult their own advisors to determine the merits
and risks of such an investment.
Reports based on technical and derivative analysis center on studying charts of a stock's price movement, outstanding positions and
trading volume, as opposed to focusing on a company's fundamentals and, as such, may not match with a report on a company's
fundamentals. Investors are advised to refer the Fundamental and Technical Research Reports available on our website to evaluate the
contrary view, if any.
The information in this document has been printed on the basis of publicly available information, internal data and other reliable
sources believed to be true, but we do not represent that it is accurate or complete and it should not be relied on as such, as this
document is for general guidance only. Angel Broking Limited or any of its affiliates/ group companies shall not be in any way
responsible for any loss or damage that may arise to any person from any inadvertent error in the information contained in this report.
Angel Broking Limited has not independently verified all the information contained within this document. Accordingly, we cannot
testify, nor make any representation or warranty, express or implied, to the accuracy, contents or data contained within this document.
While Angel Broking Limited endeavors to update on a reasonable basis the information discussed in this material, there may be
regulatory, compliance, or other reasons that prevent us from doing so.
This document is being supplied to you solely for your information, and its contents, information or data may not be reproduced,
redistributed or passed on, directly or indirectly.
Technical and Derivatives Team:
Sameet Chavan Chief Analyst - Technical & Derivatives sameet.chavan@angelbroking.com
Ruchit Jain Senior Analyst - Technical & Derivatives ruchit.jain@angelbroking.com
Rajesh Bhosale Technical Analyst rajesh.bhosle@angelbroking.com
Sneha Seth Derivatives Analyst sneha.seth@angelbroking.com
