www.angelbroking.com
June 08, 2021
Technical & Derivatives Report
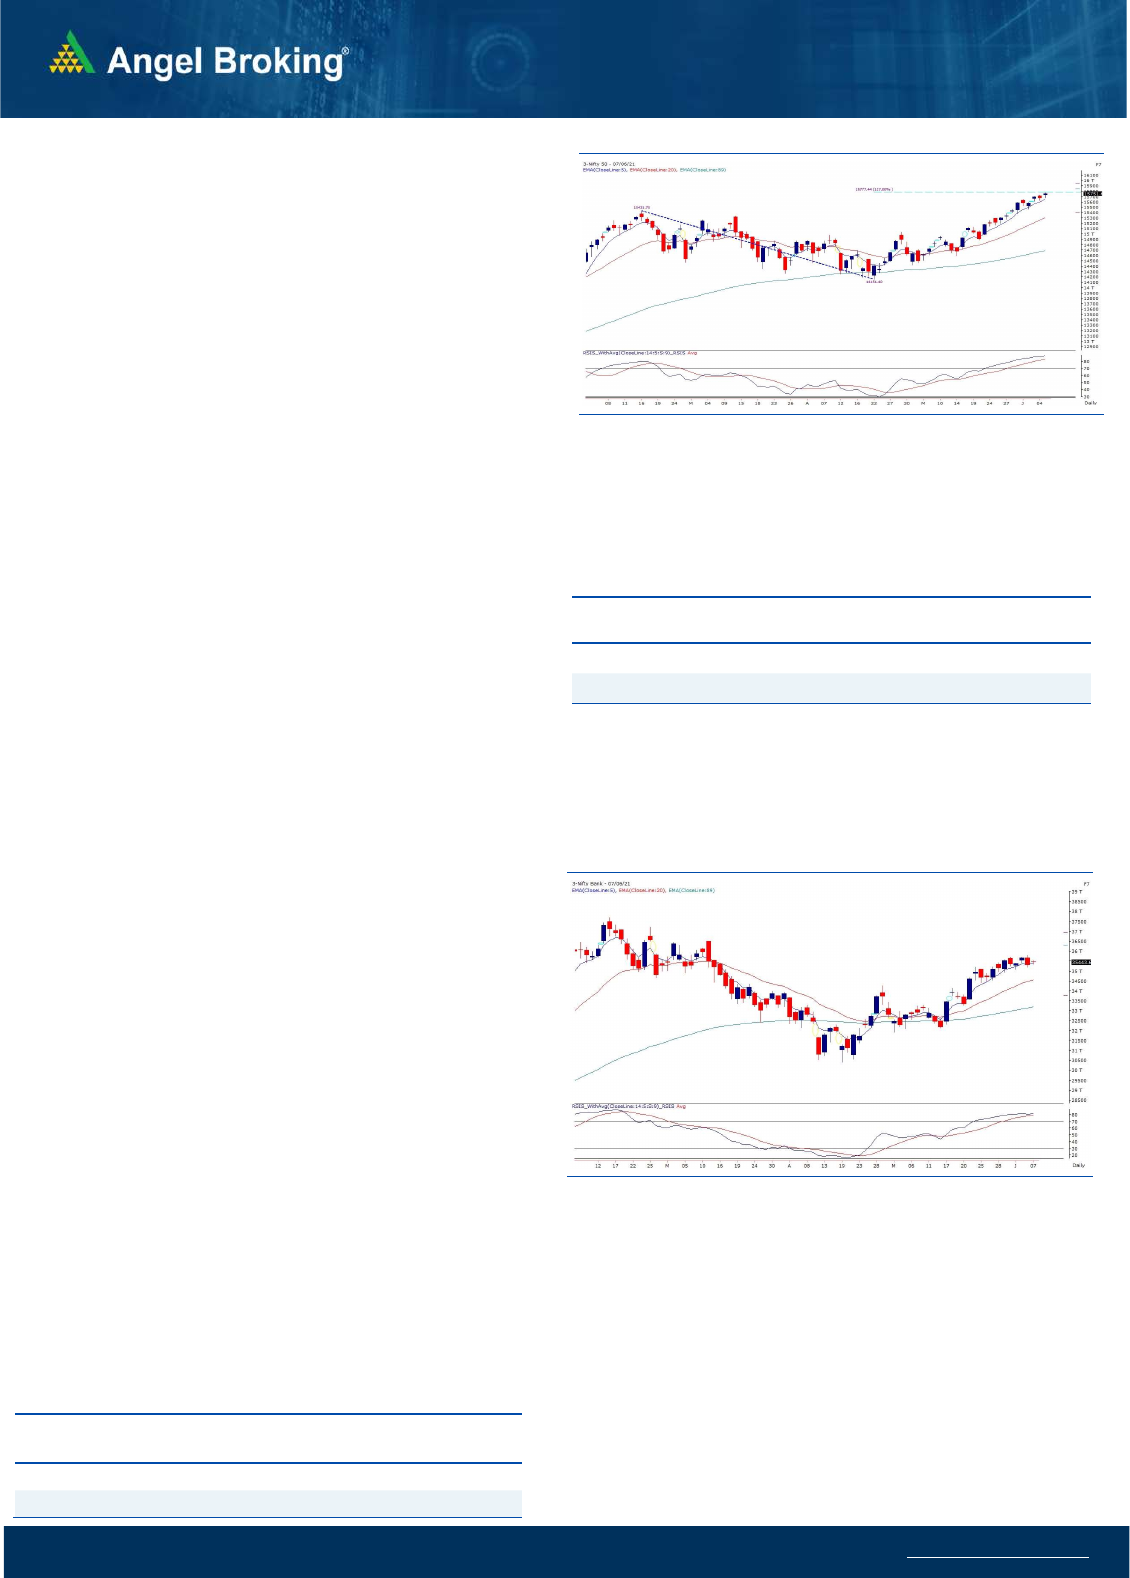
Exhibit 1: Nifty Daily Chart
Nifty
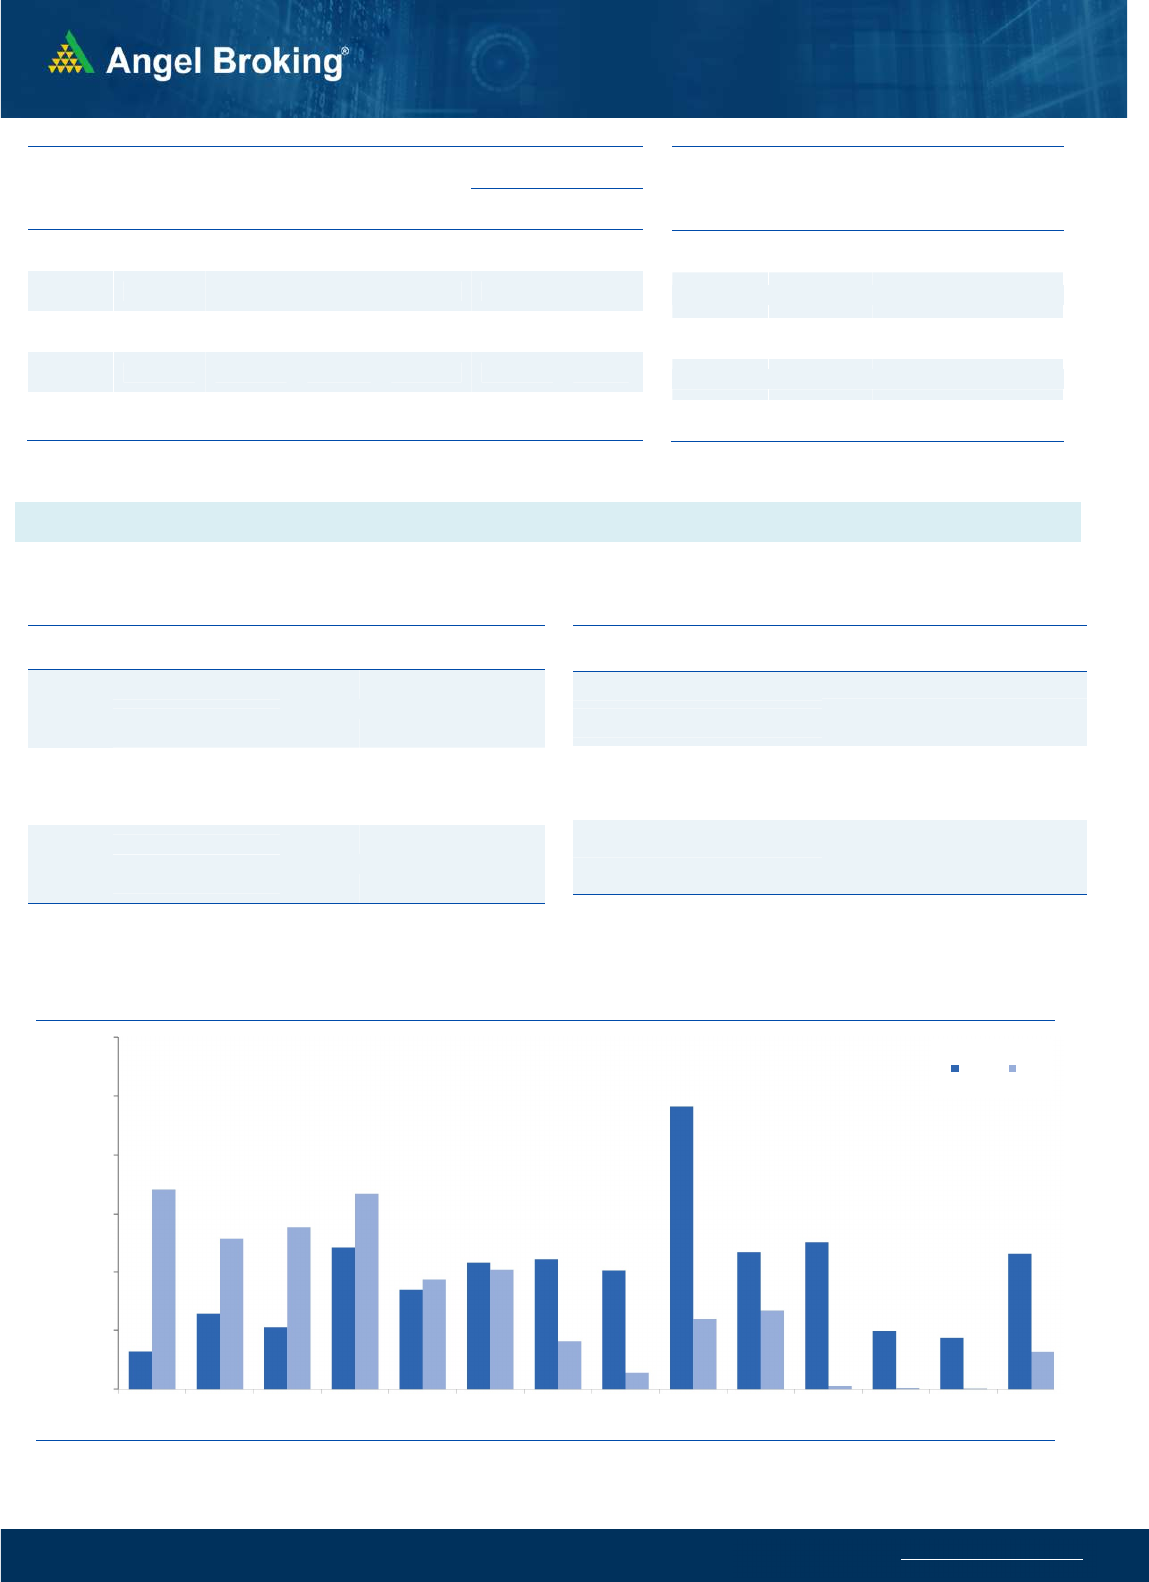
Bank Out
look
-
(
35444)
The new trading week started on a pleasant note as there was
some positivity seen across the globe. With this, our benchmark
registered a fresh record high but the banking space remained
muted from the opening tick itself. Although BANKNIFTY ended
the session with nominal gains, the momentum was missing in
banking counters.
Throughout the day, BANKNIFTY vacillated in a range of merely
120 – 150 points which is very unusual for such high beta traders’
favourite index. The Nifty is well above its previous highs and
banking index is still nearly 7% away from it, which is a clear sign
underperformance. Practically, it has lot of room if it starts
catching up with the benchmark; but if that has to happen, the
financial space will need some solid trigger which will propel it to
new highs. Till then expect this underperformance to continue.
For the coming session, 35600 – 35800 are to be seen as
immediate hurdles and only a sustainable move beyond this
would result in some trended move. On the flipside, 35100 is to
be considered a key support.
Key Levels
Support 1 – 35100 Resistance 1 – 35600
Support 2 – 35000 Resistance 2 – 35800
Exhibit 2: Nifty Bank Daily Chart
The market breadth continues to be robust which is a clear
indication that stock specific moves are providing good trading
opportunities for short term traders. Hence, one should continue to
trade with a stock specific approach and keep a tab on the above
mentioned levels on the index.
Key Levels
Support 1 – 15675 Resistance 1 – 15800
Support 2 – 15600 Resistance 2 – 16000
Sensex (52329) / Nifty (15752)
Nifty started the week on a positive note and continued its exercise
of making new records and marked a high of 15773 yesterday. The
trading range for the day was not much large and the index posted
gains of about half a percent and ended around 15750.
The uptrend continues for the Nifty as it inched higher to mark new
records everyday. However, with the momentum missing from the
banking space, the pace of upmove has slowed down a bit. Also,
Nifty is trading at some important levels where 15770-15800 is the
resistance zone. When prices are trading at all-time high, the
retracement levels usually work well in projecting the probable
targets/resistances in uncharted territory. Now, if we draw some
retracements on the recent corrective move of Nifty, then 127%
retracement of the correction from 15431 (Feb. 2021 high) to
14151 (April. 2021 low) comes in the range of 15770-15800. Hence,
it would be crucial to see how the index behaves around this range.
As of now, the market breadth continues to remain positive and
hence, there are no signs of reversal. On the flip side, the index has
been respecting the ‘20 EMA’ on the hourly chart on intraday dips
which is now placed around 15675. Thus, the above analysis
indicates resistance for Nifty in the range of 15770-15800 and
support around 15675 followed by 15600. A move above 15800
would then lead to a continuation of the trend towards the
psychological
16000
mark
.

www.angelbroking.com
Technical & Derivatives Report
June 08, 2021
Nifty Vs OI
14900
15000
15100
15200
15300
15400
15500
15600
15700
15800
15900
,0
20,000
40,000
60,000
80,000
100,000
120,000
140,000
5/24 5/26 5/28 6/1 6/3 6/7
(`000)
Openinterest Nifty
View
We began the week on a cheerful note and saw index
clocking fresh record highs during the day. The
benchmark index consolidated to conclude the day with
another half a percent gains to bull’s kitty.
FIIs were net sellers in the cash segment to the tune of
Rs. 186 crores. In index futures front, they bought worth
Rs. 515 crores with fall in open interest indicating short
covering took place in yesterday’s session.
Now in F&O space, we saw addition of fresh longs in
Nifty; whereas, short covering was seen in banking
index. In options front, call writers of 15700 covered
their positions and on the put side; same strikes added
fresh positions. Maximum open interest concentration
in the weekly series is now placed at 16000 call and
15500 put options. Stronger hands halted buying streak
in equities after three consecutive sessions and
preferred covering shorts in index futures segment. The
volatility index continued to fall which bodes well for
bull’s. Considering the above data points; we maintain
our optimistic stance on market and expect
continuation of ongoing move towards 15900-16000
mark.
C
o
mme
n
t
s
The Nifty futures open interest has increased by 1.82%.
Bank Nifty futures open interest has decreased by 2.78%
as market closed at 15751.65 levels.
The Nifty June future closed with a premium of 33.20
point against a premium of 30.60 point in last trading
session. The July series closed at a premium of 84.05
point.
The INDIA VIX decreased from 15.94 to 15.56.
At the same time, the PCR-OI of Nifty increased from
1.30 to 1.41.
Few of the liquid counters where we have seen high cost
of carry are ICICIGI, CHOLAFIN, IDFCFIRSTB, SRF and
COALINDIA
.
OI Gainers
SCRIP OI
OI
CHG. (%)
PRICE
PRICE
CHG. (%)
MRF 54200 33.30 82399.75 -3.24
SRTRANSFIN 4502800 28.78 1487.55 4.38
TORNTPOWER 2344500 15.78 461.20 7.08
BHEL 120046500 12.41 77.00 4.10
BATAINDIA 1012550 12.05 1575.40 0.77
RAMCOCEM 2026400 11.09 988.65 0.31
NMDC 72748600 10.53 182.30 -6.02
PVR 1731378 10.35 1431.05 3.58
OI Losers
SCRIP OI
OI
CHG. (%)
PRICE
PRICE
CHG. (%)
IBULHSGFIN 33368400 -15.18 247.80 -5.57
BHARATFORG 8856000 -13.19 750.00 -0.34
CHOLAFIN 8025000 -8.15 580.10 1.73
MARICO 5316000 -6.61 489.30 0.50
MOTHERSUMI 31941000 -6.47 253.35 0.73
APOLLOTYRE 15027500 -6.14 237.40 2.48
BAJFINANCE 3523375 -6.09 5729.65 -4.07
IOC 62517000 -6.00 114.70 0.13
Put-Call Ratio
SCRIP PCR-OI PCR-VOL
NIFTY 1.41 0.89
BANKNIFTY 0.68 0.77
RELIANCE 0.53 0.35
ICICIBANK 0.57 0.43
INFY 0.56 0.35
Historical Volatility
SCRIP HV
TORNTPOWER 41.60
POWERGRID 37.74
NTPC 37.40
NMDC 55.76
ADANIPORTS 50.15
www.angelbroking.com
Technical & Derivatives Report
June 08, 2021
Note: Above mentioned Bullish or Bearish Spreads in Nifty (June Series) are given as an information and not as a recommendation.
Nifty Spot =
15751.65
FII Statistics for June 07, 2021
Detail Buy
Net Contracts
Open Interest
Sell
Value
(in Cr.)
Change
INDEX
FUTURES
2619.86 2104.86 515.00
118852 13286.16 (1.94)
INDEX
OPTIONS
260340.70 257776.92 2563.78
1001431 104195.33 11.53
STOCK
FUTURES
16071.00 16824.93 (753.93) 1374441 110526.20 0.10
STOCK
OPTIONS
18175.48 18175.17 0.31
271091 21132.38 10.01
Total 297207.04
294881.88
2325.16
2765815
249140.07
4.82
Turnover on June 07, 2021
Instru
ment
No. of
Contracts
Turnover
( in Cr. )
Change
(%)
Index Futures
1,64,577 16369.31 -31.32
Index Options
2,31,32,389 23,17,758.11 -2.67
Stock Futures
8,64,421 72264.23 3.27
Stock Options
25,64,201 2,18,522.38 7.81
Total 2,67,25,588 26,24,914.03 -1.98
Bull-Call Spreads
Action Strike Price Risk Reward BEP
Buy 15800 175.85
49.90 50.10 15849.90
Sell 15900 125.95
Buy 15800 175.85
89.20 110.80 15889.20
Sell 16000 86.65
Buy 15900 125.95
39.30 60.70 15939.30
Sell 16000 86.65
Bear-Put Spreads
Action Strike Price Risk Reward BEP
Buy 15700 188.60
43.00 57.00 15657.00
Sell 15600 145.60
Buy 15700 188.60
77.10 122.90 15622.90
Sell 15500 111.50
Buy 15600 145.60
34.10 65.90 15565.90
Sell 15500 111.50
Nifty Put-Call Analysis
,0
500,000
1000,000
1500,000
2000,000
2500,000
3000,000
15200 15300 15400 15500 15600 15700 15800 15900 16000 16100 16200 16300 16400 16500
Call Put

www.angelbroking.com
Technical & Derivatives Report
June 08, 2021
Da
ily
Pivot Level
s for
Nifty Con
stituents
Scrips
S2
S1
PIVOT
R1
R2
ADANIPORTS
808
843
871
906
934
ASIANPAINT 2,889 2,911
2,926
2,948
2,963
AXISBANK
736
744
749
756
761
BAJAJ-AUTO 4,213 4,232
4,258
4,276
4,303
BAJFINANCE 5,591 5,660
5,752
5,822
5,913
BAJAJFINSV 11,517
11,673
11,841
11,997
12,165
BPCL
475
478
482
485
489
BHARTIARTL
529
533
537
541
545
BRITANNIA 3,449 3,496
3,525
3,572
3,602
CIPLA
929
934
943
949
957
COALINDIA
153
155
157
158
160
DIVISLAB 4,171 4,200
4,250
4,279
4,329
DRREDDY 5,174 5,197
5,235
5,258
5,296
EICHERMOT 2,713 2,734
2,766
2,787
2,819
GRASIM 1,474 1,487
1,509
1,523
1,545
HCLTECH
931
940
946
955
961
HDFCBANK 1,485 1,493
1,503
1,511
1,521
HDFCLIFE
670
675
680
685
689
HDFC 2,5
48
2,567
2,601
2,620
2,654
HEROMOTOCO 3,021 3,036
3,057
3,072
3,092
HINDALCO
390
392
397
400
404
HINDUNILVR 2,318 2,329
2,341
2,352
2,364
ICICIBANK
642
645
647
651
653
IOC
113
114
115
116
116
INDUSINDBK
999
1,012
1,022
1,035
1,046
INFY 1,372 1,381
1,386
1,395
1,401
ITC
209
210
211
213
214
JSW STEEL
702
709
720
727
738
KOTAKBANK 1,798 1,806
1,816
1,824
1,834
LT 1,527 1,543
1,556
1,571
1,585
M&M
797
800
806
810
815
MARUTI 7,154 7,215
7,272
7,333
7,390
NESTLEIND 17,256
17,394
17,492
17,631
17,729
NTPC
110
113
115
118
120
ONGC
123
124
126
127
128
POWERGRID
223
230
234
240
245
RELIANCE 2,161 2,194
2,218
2,251
2,275
SBILIFE
980
984
991
995
1,002
SHREECEM 27,769
28,462
28,904
29,597
30,038
SBIN
427
430
433
436
440
SUNPHARMA
668
672
675
678
682
TCS 3,112 3,148
3,169
3,205
3,226
TATACONSUM
678
689
698
709
718
TATAMOTORS
334
340
345
351
357
TATASTEEL 1,110 1,120
1,135
1,144
1,159
TECHM 1,011 1,023
1,031
1,042
1,050
TITAN 1,654 1,669
1,692
1,707
1,730
ULTRACEMCO 6,562 6,706
6,807
6,951
7,052
UPL
821
836
849
864
877
WIPRO
539
544
547
552
556

www.angelbroking.com
Technical & Derivatives Report
June 08, 2021
*
Research Team Tel: 022 – 39357600 (Extn. 6844) Website: www.angelbroking.com
For Technical Queries E-mail: technicalresearch-cso@angelbroking.com
For Derivatives Queries E-mail: derivatives.desk@angelbroking.com
DISCLAIMER
Angel Broking Limited (hereinafter referred to as “Angel”) is a registered Member of National Stock Exchange of India Limited,
Bombay Stock Exchange Limited and Metropolitan Stock Exchange Limited. It is also registered as a Depository Participant with CDSL
and Portfolio Manager and Investment Adviser with SEBI. It also has registration with AMFI as a Mutual Fund Distributor. Angel
Broking Limited is a registered entity with SEBI for Research Analyst in terms of SEBI (Research Analyst) Regulations, 2014 vide
registration number INH000000164. Angel or its associates has not been debarred/ suspended by SEBI or any other regulatory
authority for accessing /dealing in securities Market. Angel or its associates/analyst has not received any compensation / managed
or co-managed public offering of securities of the company covered by Analyst during the past twelve months.
This document is solely for the personal information of the recipient, and must not be singularly used as the basis of any investment
decision. Nothing in this document should be construed as investment or financial advice. Each recipient of this document should
make such investigations as they deem necessary to arrive at an independent evaluation of an investment in the securities of the
companies referred to in this document (including the merits and risks involved), and should consult their own advisors to determine
the merits and risks of such an investment.
Reports based on technical and derivative analysis center on studying charts of a stock's price movement, outstanding positions and
trading volume, as opposed to focusing on a company's fundamentals and, as such, may not match with a report on a company's
fundamentals. Investors are advised to refer the Fundamental and Technical Research Reports available on our website to evaluate
the contrary view, if any.
The information in this document has been printed on the basis of publicly available information, internal data and other reliable
sources believed to be true, but we do not represent that it is accurate or complete and it should not be relied on as such, as this
document is for general guidance only. Angel Broking Limited or any of its affiliates/ group companies shall not be in any way
responsible for any loss or damage that may arise to any person from any inadvertent error in the information contained in this
report. Angel Broking Limited has not independently verified all the information contained within this document. Accordingly, we
cannot testify, nor make any representation or warranty, express or implied, to the accuracy, contents or data contained within this
document. While Angel Broking Limited endeavors to update on a reasonable basis the information discussed in this material, there
may be regulatory, compliance, or other reasons that prevent us from doing so.
This document is being supplied to you solely for your information, and its contents, information or data may not be reproduced,
redistributed or passed on, directly or indirectly.
Technical and Derivatives Team:
Sameet Chavan Chief Analyst - Technical & Derivatives sameet.chavan@angelbroking.com
Ruchit Jain Senior Analyst - Technical & Derivatives ruchit.jain@angelbroking.com
Rajesh Bhosale Technical Analyst rajesh.bhosle@angelbroking.com
Sneha Seth Derivatives Analyst sneha.seth@angelbroking.com
