www.angelbroking.com
Technical & Derivatives Report
June 08, 2020
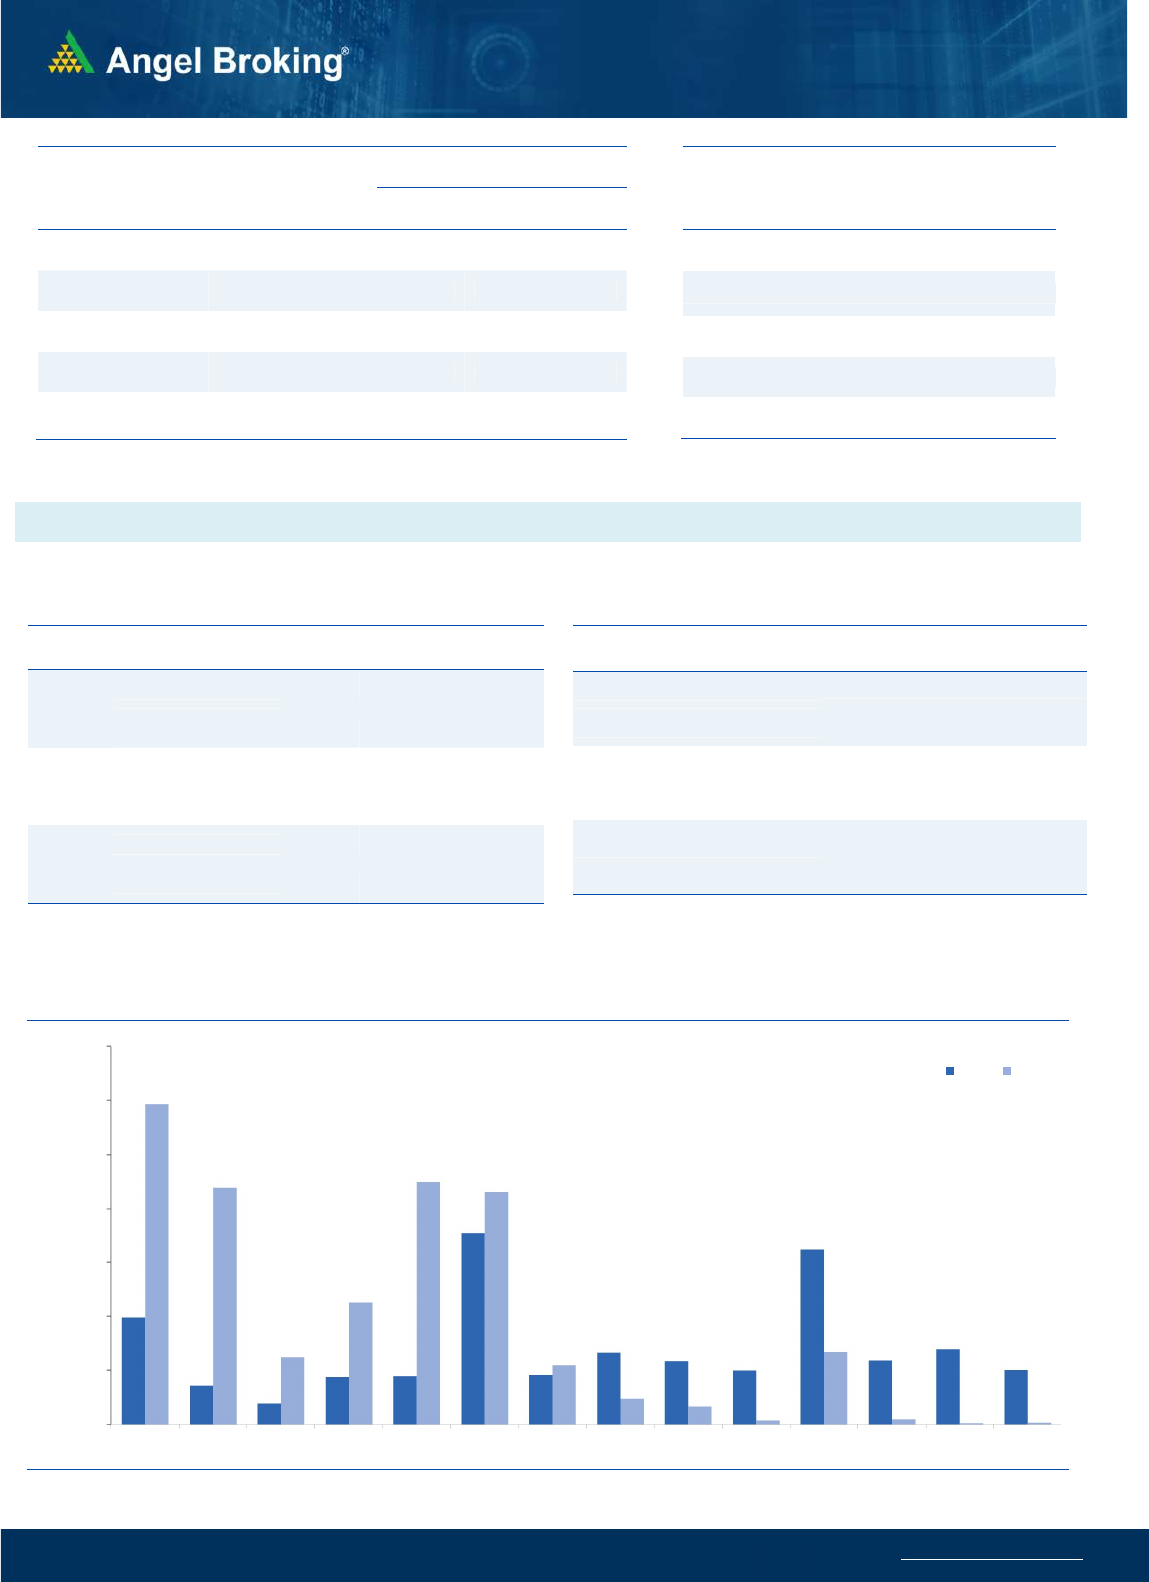
Nifty Bank Outlook - (21034)
During last week, Bank Nifty started the session with a gap up
opening and rallied sharply to register high over 21600 during
mid-week. Although the index gave up some of the gains on
Thursday, the momentum resumed on the last trading session of
the week and the index posted whopping gains of 9 percent. Post
a minor intra week correction, Bank Nifty resumed its momentum
on Friday's session with a broad participation from stocks within
the sector. After a long time, the PSU Banking space too witnessed
a sharp price upmove with good volumes and the way banking
space has seen participation in the last couple of weeks, it
indicates that the index is showing a catch up rally to the
recent underperformance. SGX Nifty is indicating a gap up
opening for our markets this week too which should lead to a
continuation of the short term trend. Hence, traders are advised
to continue to trade with a positive bias for near term targets
around 21970 followed by 22700. The immediate support for the
index is placed around 20600.
Key Levels
Support 1 – 20750 Resistance 1 – 21970
Support 2 – 20600 Resistance 2 – 22700
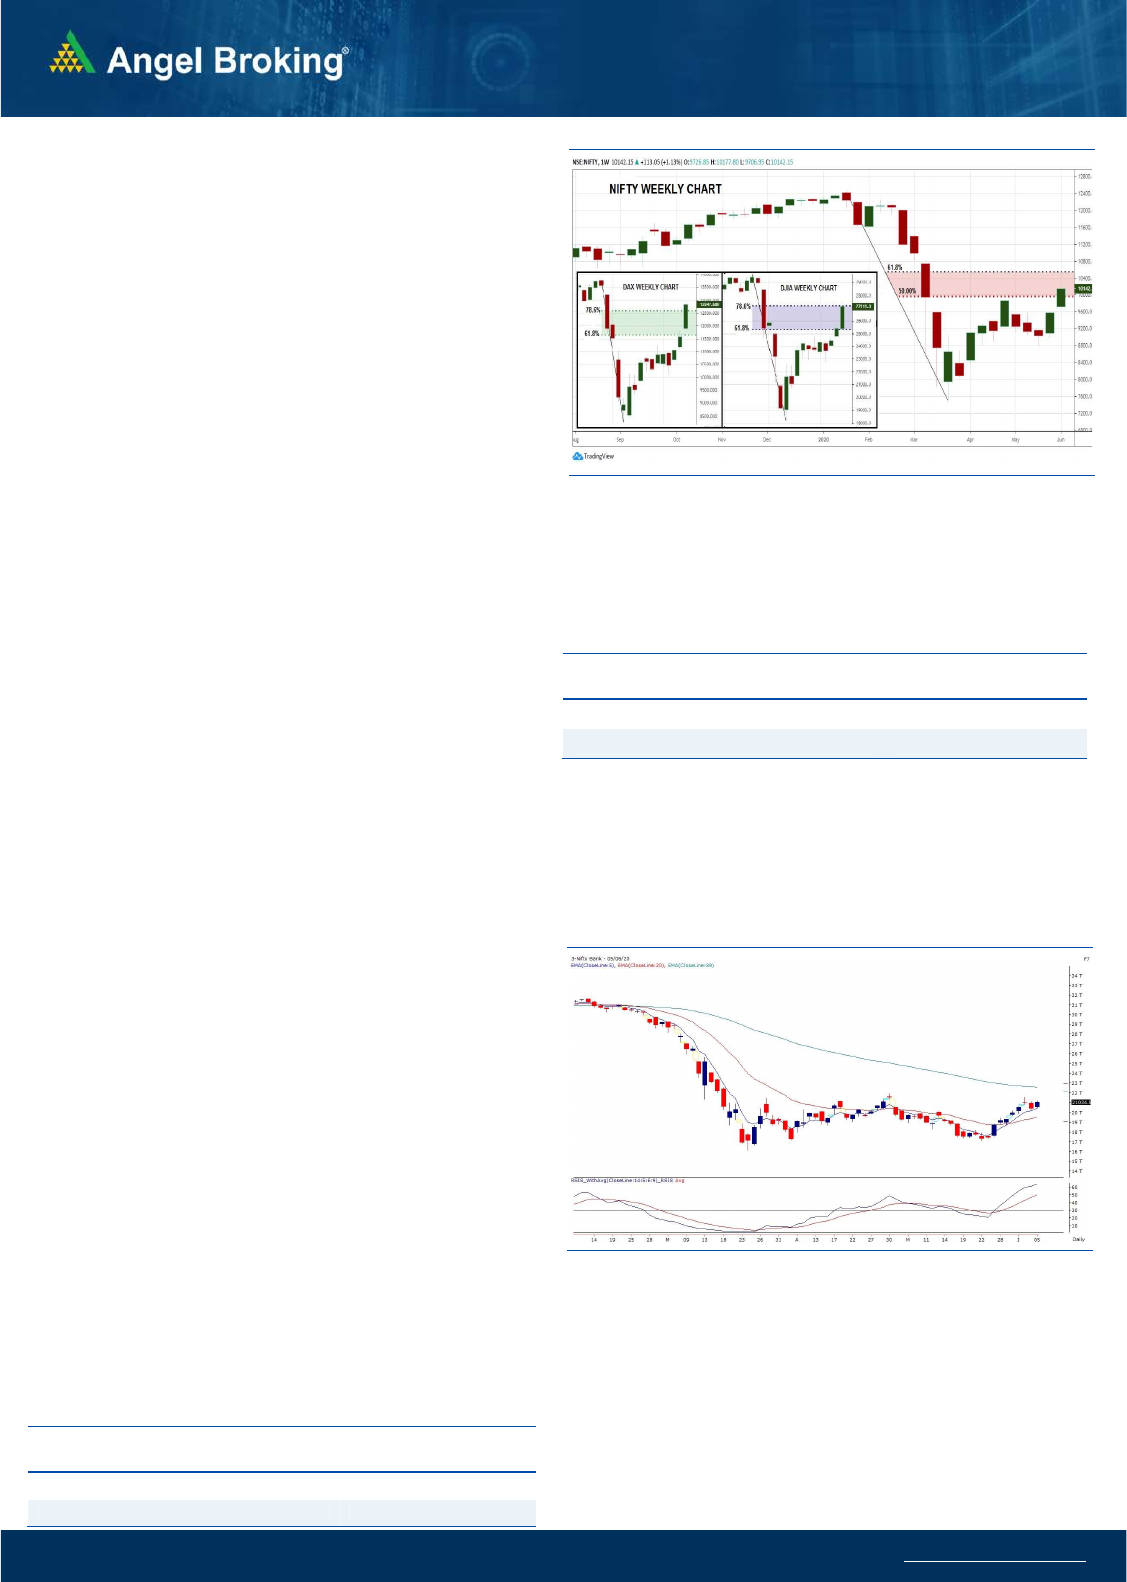
Exhibit 1: Nifty Weekly Chart
Sensex (34287) / Nifty (10142)
It was certainly a great start for the new trading week as well as
the June month. Last month, there was a gap down opening at the
inaugural day and on Monday, precisely that downside gap area
was filled to kick off the new month. Our markets continued their
upwards trajectory to enter a five digit territory beyond 10000
after nearly three months. After a good head start, markets took a
pause and saw some profit booking for couple of days. But
without much damage, the buying re-emerged at lower levels on
Friday to conclude the week with whopping 6% gains from the
previous weekly close.
Technically speaking, Monday’s gap up opening turned out to be
a game changer for the bulls. Because After the April month
ecstatic move, May started with some negativity and the same
precisely got reversed with such bump up. Since the previous gap
was filled by yet another gap, this time bears got caught
completely on the wrong foot. Now looking at the current set up,
we remain upbeat as long as 9900 holds on a sustainable basis
and this is what we alluded post Thursday’s close as well. Since the
recent move was mainly propelled by the banking space, we were
convinced of the rally in last couple of weeks. Now along with
banking, we could see contribution from the broader market too,
indicating sign of a robust move. Last week, although we
struggled at 10200, the positioning of RSI-Smoothened indicates
possibility of extending this move towards 10500-10700 levels.
Hence traders are continuously advised to stay on the positive
side as long as 9900 is being held.
Exhibit 2: Nifty Bank Daily Chart
Apart from this, we take this opportunity to highlight some notable
observations. If we look at two major global indices, DOW JONES
and DAX, both have retraced almost 78% from the March lows but
we are trading tad above 50%. Hence, if we have to see the catch up
move, mentioned levels are very much on cards now.
Key Levels
Support 1 – 10040 Resistance 1 – 10250
Support 2 – 10000 Resistance 2 – 10335

www.angelbroking.com
Technical & Derivatives Report
June 08, 2020
Nifty Vs OI
8200
8400
8600
8800
9000
9200
9400
9600
9800
10000
10200
10400
,0
2,000
4,000
6,000
8,000
10,000
12,000
14,000
5/195/205/215/225/265/275/285/29 6/1 6/2 6/3 6/4 6/5
(`000)
Openinterest Nifty
V
iew
s
During last week, Nifty started with a gap up opening
and post an intra-week hiccup resumed its positive
momentum on Friday to end with gains of 6% percent
agains the previous week close.
FIIs were net buyers in the cash market segment to the
tune of Rs. 98 crores. In index futures, they sold worth
345 crores with increase in open interest indicating
shorts as well as some longs created on Friday.
During last week, indices rallied higher with formation
of long positions in Nifty and a combination of short
covering and long formation in Bank Nifty. We
witnessed good open interest addition in 10000-9700
put options indicating support base shifting higher. FII’s
bought equities in the cash segment during the week
while they formed marginal short positions in index
futures. If we look at stock specific build up, many stocks
from the derivatives space witnessed long formations
while the broader markets too witnessed good
momentum. The options data hints good support at
10000 mark for the near term whereas on the higher
side the momentum could lead the index towards
10300 and 10500 mark. Hence, traders are advised to
continue to trade with a positive bias.
C
o
mme
n
t
s
The Nifty futures open interest has increased by 2.85%
Bank Nifty futures open interest has increased by 9.49%
as market closed at 10142.15 levels.
The Nifty June future closed with a premium of 3.35 point
against a discount of 11.45 point in last trading session.
The July series closed at a premium of 0.10 point.
The INDIA VIX has decreased from 29.69 to 28.68
At the same time, the PCR-OI of Nifty increased from 1.36
to 1.50.
Few of the liquid counters where we have seen high cost
of carry are NCC, BHEL, GMRINFRA, JINDALSTEL and PNB.
OI Gainers
SCRIP OI
OI
CHG. (%)
PRICE
PRICE
CHG. (%)
TORNTPOWER 2289000 24.27 344.55 4.33
UBL 1486800 22.00 1017.05 7.48
CUMMINSIND 1503000 18.78 384.30 1.66
NCC 34443000 16.15 30.35 13.12
CANBK 13087000 15.70 104.30 7.33
PVR 1624000 13.34 1242.15 9.58
SRTRANSFIN 3252300 12.65 614.95 0.14
APOLLOTYRE 11381000 11.03 104.70 2.09
OI Losers
SCRIP OI
OI
CHG. (%)
PRICE
PRICE
CHG. (%)
UJJIVAN 3245700 -15.45 184.85 2.98
CADILAHC 6182000 -10.82 359.65 -1.09
INFRATEL 8473200 -9.89 236.25 7.98
TORNTPHARM 1367500 -8.25 2367.75 0.00
BHARTIARTL 84749886 -8.13 584.35 1.89
LUPIN 7457050 -7.82 902.35 -0.45
MGL 1459800 -7.56 1012.65 -1.22
CHOLAFIN 5760000 -7.28 145.40 1.89
Put-Call Ratio
SCRIP PCR-OI PCR-VOL
NIFTY 1.50 0.88
BANKNIFTY 1.01 0.71
RELIANCE 0.81 0.45
ICICIBANK 0.85 0.74
INFY 0.55 0.37
Historical Volatility
SCRIP HV
PVR 65.51
TATAMOTORS 77.37
UBL 47.63
PNB 60.64
IDEA 148.25
www.angelbroking.com
Technical & Derivatives Report
June 08, 2020
Note: Above mentioned Bullish or Bearish Spreads in Nifty (June Series) are given as an information and not as a recommendation.
Nifty Spot =
10142.20
FII Statistics for June 05, 2020
Detail Buy Sell Net
Open Interest
Contracts
Value
(in Cr.)
Change
(%)
INDEX
FUTURES
5753.19
6098.28
(345.09) 126389
8523.05
10.70
INDEX
OPTIONS
152232.01
151570.33
661.68
683330
45561.86
19.84
STOCK
FUTURES
18895.56
18440.74
454.82
1512665
81076.08
(0.14)
STOCK
OPTIONS
4834.24
4807.13
27.11
75494
4381.34
11.46
Total 181715.00
180916.48
798.52
2397878
139542.33
5.78
Turnover on June 05, 2020
Instrument
No. of
Contracts
Turnover
( in Cr. )
Change
(%)
Index Futures 6,54,507 34579.06 -8.45
Index Options 1,27,46,508
7,09,009.95 -65.78
Stock Futures 11,45,756 61873.36 6.76
Stock Options 12,40,751 73747.23 26.31
Total 1,57,87,522
8,79,209.60 -60.50
Bull-Call Spreads
Action Strike Price Risk Reward BEP
Buy 10200 221.85
45.50 54.50 10245.50
Sell 10300 176.35
Buy 10200 221.85
84.25 115.75 10284.25
Sell 10400 137.60
Buy 10300 176.35
38.75 61.25 10338.75
Sell 10400 137.60
Bear-Put Spreads
Action Strike Price Risk Reward BEP
Buy 10100 233.20
40.65 59.35 10059.35
Sell 10000 192.55
Buy 10100 233.20
73.15 126.85 10026.85
Sell 9900 160.05
Buy 10000 192.55
32.50 67.50 9967.50
Sell 9900 160.05
Nifty Put-Call Analysis
,0
500,000
1000,000
1500,000
2000,000
2500,000
3000,000
3500,000
9500 9600 9700 9800 9900 10000 10100 10200 10300 10400 10500 10600 10700 10800
Call Put

www.angelbroking.com
Technical & Derivatives Report
June 08, 2020
Daily Pivot Levels for Nifty Constituents
Scrips
S2
S1
PIVOT
R1
R2
ADANIPORTS
332
337
342
346
352
ASIANPAINT 1,601 1,620
1,640
1,658
1,678
AXISBANK
383
394
402
413
421
BAJAJ-AUTO 2,713 2,745
2,794
2,825
2,875
BAJFINANCE 2,224 2,307
2,358
2,441
2,492
BAJAJFINSV 5,017 5,127
5,206
5,316
5,395
BPCL
344
357
365
377
385
BHARTIARTL
558
571
581
594
603
INFRATEL
216
226
233
243
250
BRITANNIA 3,360 3,413
3,456
3,509
3,551
CIPLA
636
643
657
664
677
COALINDIA
138
142
144
147
149
DRREDDY 3,965 3,
995
4,022
4,053
4,080
EICHERMOT 17,165
17,330
17,475
17,640
17,785
GAIL
96
97
98
99
100
GRASIM
601
614
622
635
644
HCLTECH
564
570
579
585
593
HDFCBANK
987
1,010
1,026
1,050
1,066
HDFC 1,717 1,742
1,765
1,790
1,814
HEROMOTOCO
2,2
82
2,311
2,338
2,367
2,393
HINDALCO
140
145
148
152
155
HINDUNILVR 2,057 2,072
2,100
2,115
2,143
ICICIBANK
342
349
355
362
368
IOC
85
87
89
91
92
INDUSINDBK
404
413
420
429
436
INFY
694
699
705
710
716
ITC
197
198
200
202
204
JSW STEEL
189
193
198
202
206
KOTAKBANK 1,302 1,320
1,339
1,357
1,376
LT
927
941
951
965
974
M&M
469
477
483
491
497
MARUTI 5,620 5,683
5,734
5,797
5,848
NESTLEIND 16,668
16,882
17,171
17,386
17,675
NTPC
93
95
97
99
101
ONGC
83
8
5
87
89
91
POWERGRID
160
166
170
176
180
RELIANCE 1,547 1,564
1,591
1,609
1,635
SHREECEM 21,077
21,583
22,007
22,513
22,937
SBIN
171
179
185
193
198
SUNPHARMA
480
487
499
506
518
TCS 2,004 2,026
2,062
2,084
2,120
TATAMOTORS
94
102
107
116
121
TATASTEEL
317
328
336
347
354
TECHM
564
572
583
591
601
TITAN
956
974
984
1,002
1,012
ULTRACEMCO 3,744 3,807
3,868
3,930
3,991
UPL
414
427
436
449
459
VEDANTA
101
103
105
107
108
WIPRO
213
216
218
221
223
ZEEL
198
202
206
210
214

www.angelbroking.com
Technical & Derivatives Report
June 08, 2020
*
Research Team Tel: 022 – 39357600 (Extn. 6844) Website: www.angelbroking.com
For Technical & Derivatives Queries E-mail: techn[email protected]
DISCLAIMER
Angel Broking Limited (hereinafter referred to as “Angel”) is a registered Member of National Stock Exchange of India Limited, Bombay
Stock Exchange Limited and Metropolitan Stock Exchange Limited. It is also registered as a Depository Participant with CDSL and
Portfolio Manager and Investment Adviser with SEBI. It also has registration with AMFI as a Mutual Fund Distributor. Angel Broking
Limited is a registered entity with SEBI for Research Analyst in terms of SEBI (Research Analyst) Regulations, 2014 vide registration
number INH000000164. Angel or its associates has not been debarred/ suspended by SEBI or any other regulatory authority for
accessing /dealing in securities Market. Angel or its associates/analyst has not received any compensation / managed or co-managed
public offering of securities of the company covered by Analyst during the past twelve months.
This document is solely for the personal information of the recipient, and must not be singularly used as the basis of any investment
decision. Nothing in this document should be construed as investment or financial advice. Each recipient of this document should make
such investigations as they deem necessary to arrive at an independent evaluation of an investment in the securities of the companies
referred to in this document (including the merits and risks involved), and should consult their own advisors to determine the merits
and risks of such an investment.
Reports based on technical and derivative analysis center on studying charts of a stock's price movement, outstanding positions and
trading volume, as opposed to focusing on a company's fundamentals and, as such, may not match with a report on a company's
fundamentals. Investors are advised to refer the Fundamental and Technical Research Reports available on our website to evaluate the
contrary view, if any.
The information in this document has been printed on the basis of publicly available information, internal data and other reliable
sources believed to be true, but we do not represent that it is accurate or complete and it should not be relied on as such, as this
document is for general guidance only. Angel Broking Limited or any of its affiliates/ group companies shall not be in any way
responsible for any loss or damage that may arise to any person from any inadvertent error in the information contained in this report.
Angel Broking Limited has not independently verified all the information contained within this document. Accordingly, we cannot
testify, nor make any representation or warranty, express or implied, to the accuracy, contents or data contained within this document.
While Angel Broking Limited endeavors to update on a reasonable basis the information discussed in this material, there may be
regulatory, compliance, or other reasons that prevent us from doing so.
This document is being supplied to you solely for your information, and its contents, information or data may not be reproduced,
redistributed or passed on, directly or indirectly.
Technical and Derivatives Team:
Sameet Chavan Chief Analyst - Technical & Derivatives sameet.chavan@angelbroking.com
Ruchit Jain Senior Analyst - Technical & Derivatives ruchit.jain@angelbroking.com
Rajesh Bhosale Technical Analyst rajesh.bhosle@angelbroking.com
Sneha Seth Derivatives Analyst sneha.seth@angelbroking.com