1
1
www.angelbroking.com
Technical & Derivatives Report
September 07, 2020
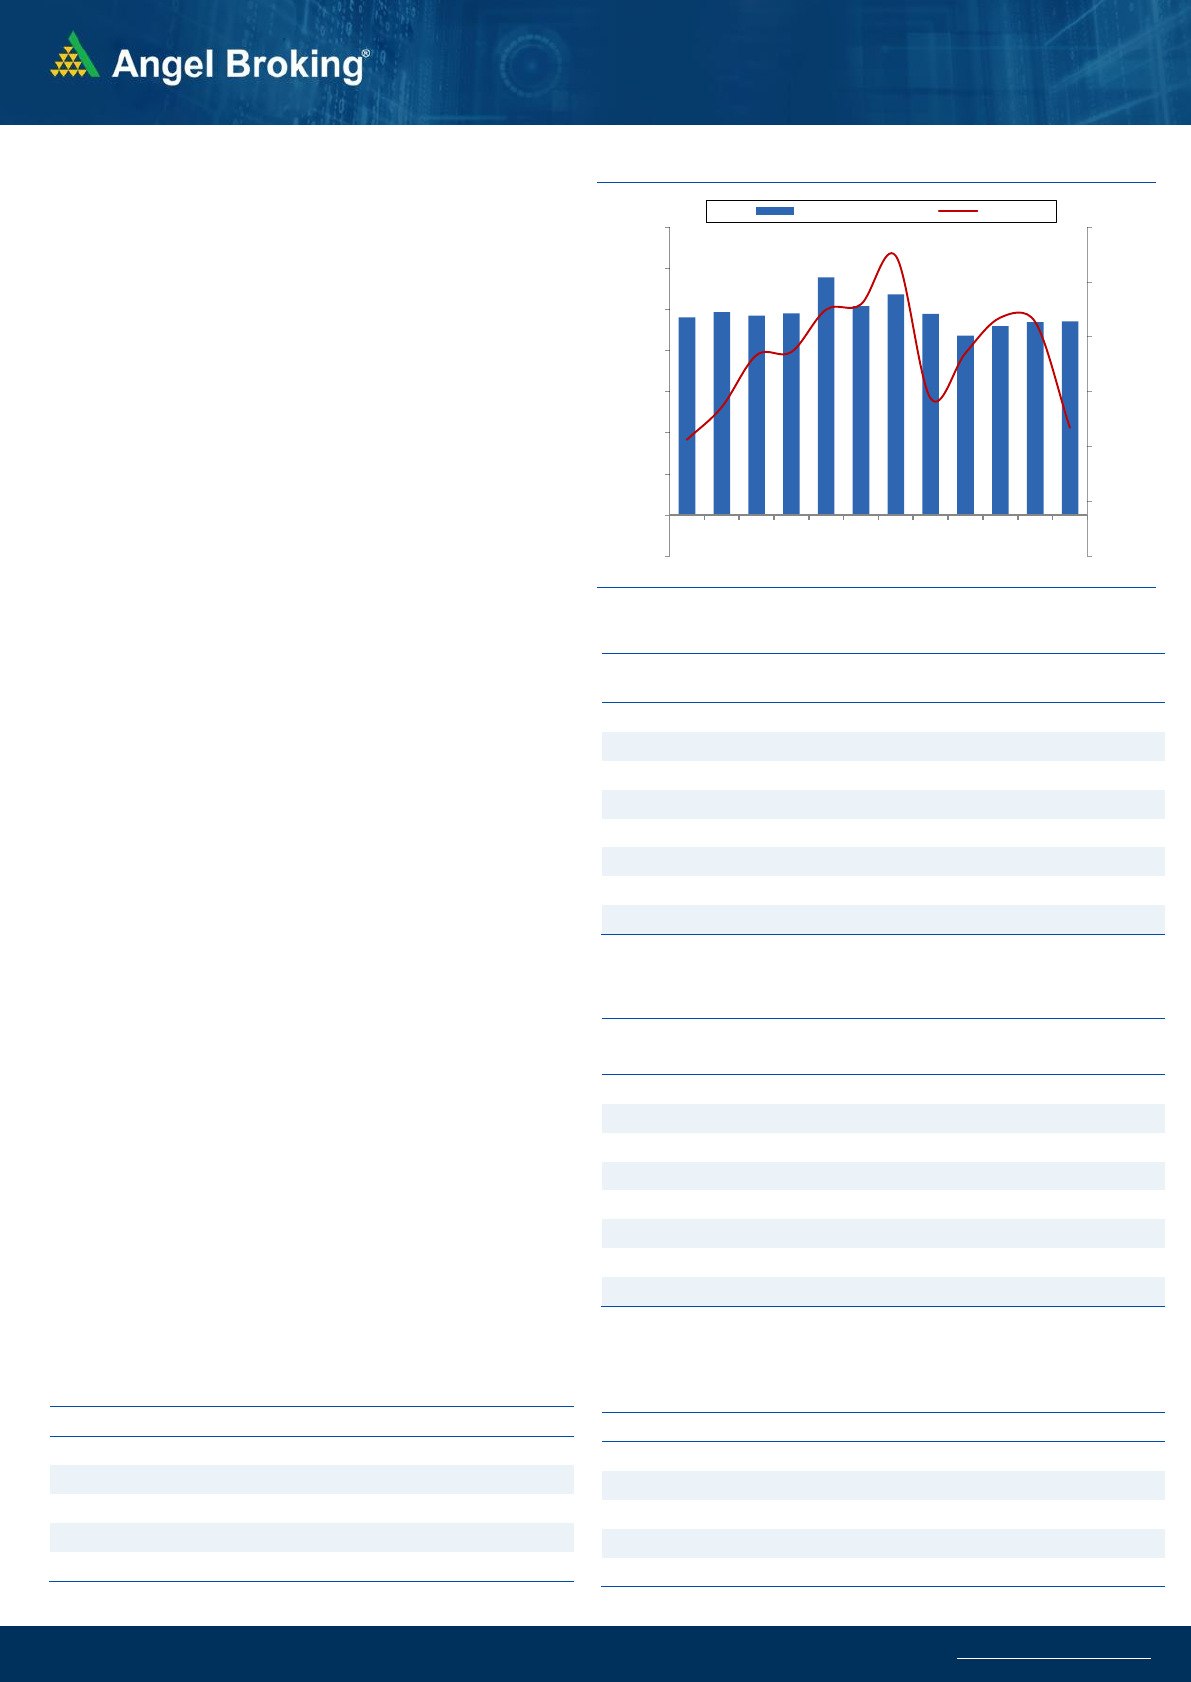
Nifty Bank Outlook - (23011)
On Friday, the bank nifty witnessed a gap down opening
following the weakness in the global cues. Subsequently, it made
an attempt to bounce back however the bounce got sold into and
the bank index witnessed one more round of sell-off during the
last hour to eventually end with a loss of 2.21% tad above 23000
levels. The bank index broke below the 23400 support level which
was acting as strong support for the last four sessions and it has
been broken with a gap that can be termed as a breakaway gap.
On the weekly chart, we are now witnessing a bearish reversal
pattern known as 'Dark Cloud Cover' and hence we sense the
banking index is likely to remain under pressure in the near term
with an increase in volatility. Traders are henced advised to keep
positions light and avoid undue risk. As far as levels are concerned,
the next support is placed around 22650 and 22410 levels
whereas in case of any bounce immediate resistance is placed
around 23400 - 23530 levels.
Key Levels
Support 1 – 22650
Resistance 1 – 23400
Support 2 – 22410
Resistance 2 – 23530
Exhibit 1: Nifty Daily Chart
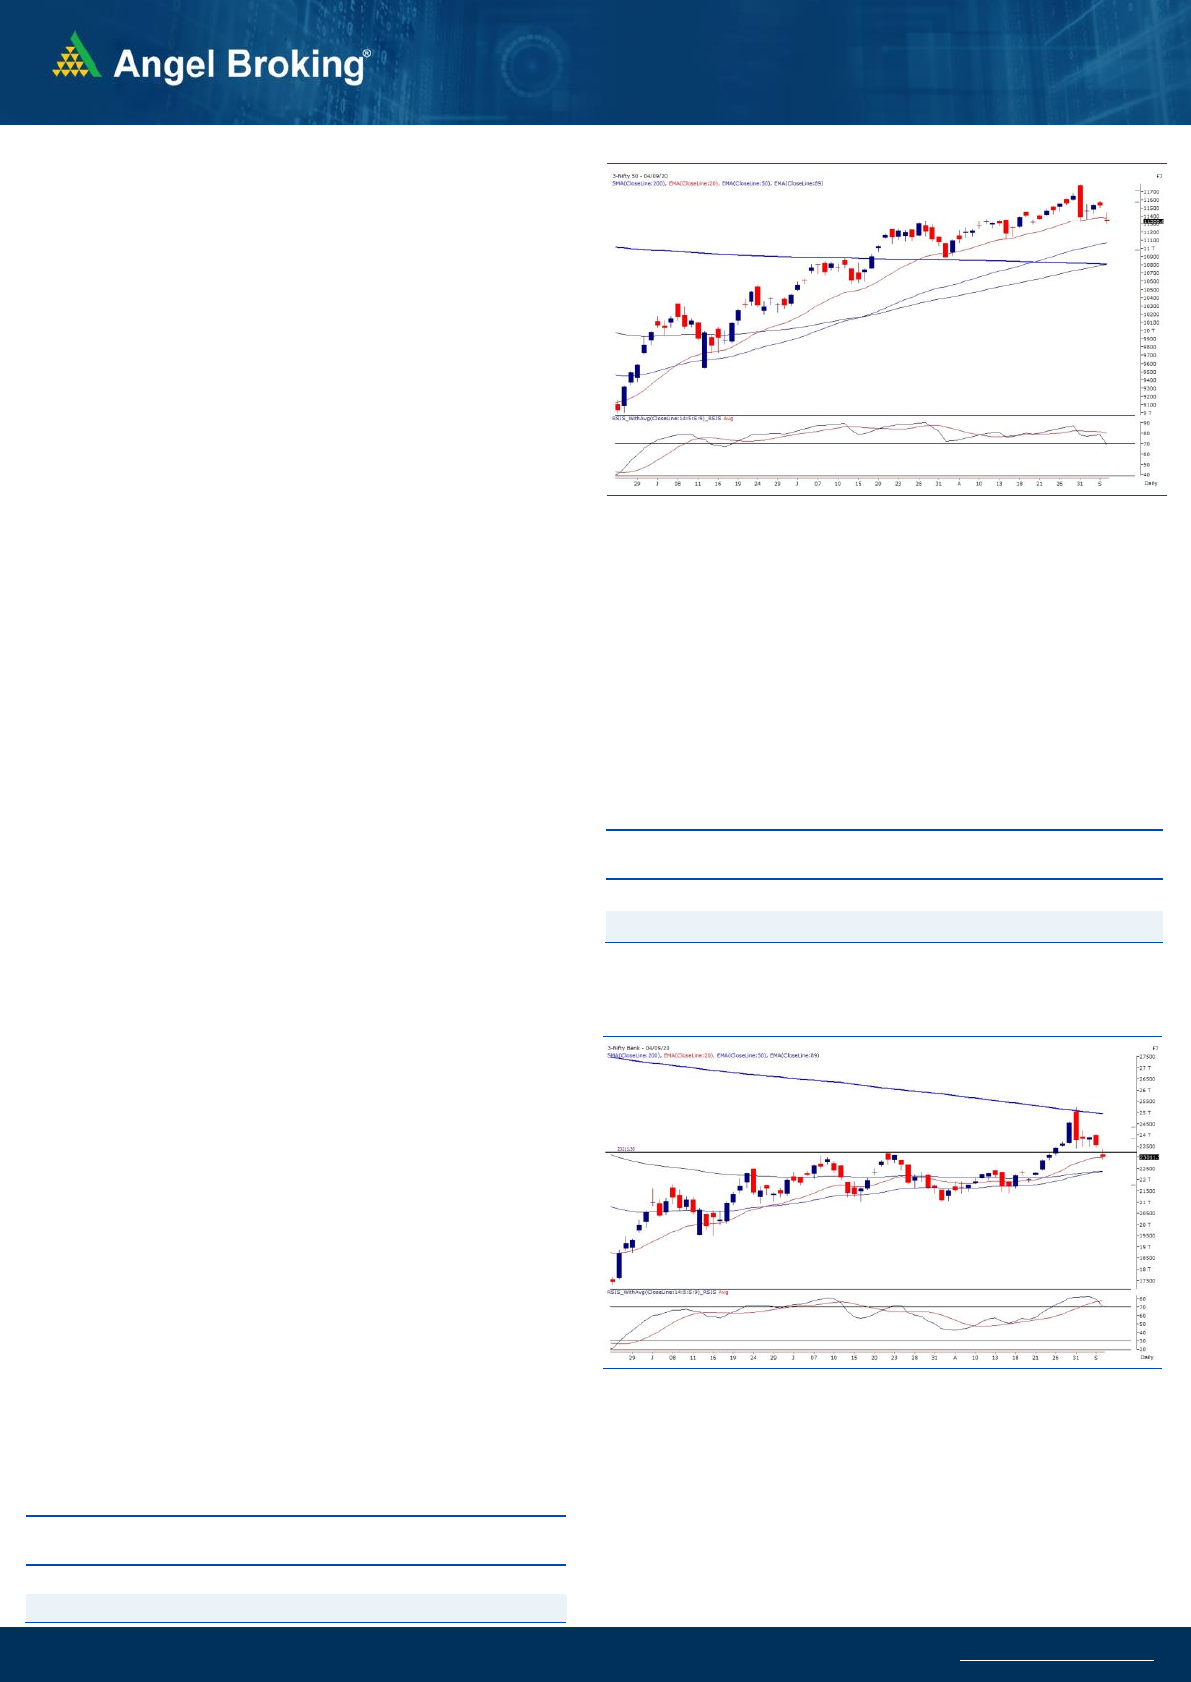
Sensex (38357) / Nifty (11334)
During the last week, our markets opened with a good bump up,
owing to cheerful mood across the globe. Everything looked hunky
dory but all of a sudden, the massive sell off triggered in our markets
after the news of India-China clash at the border. Eventually it turned
out to be one of the terrible days in the recent past. Post this, markets
consolidated and gave a minor recovery for next three trading
sessions. However, on Friday, the selling once again resumed to close
almost at the lowest point of the week.
On the first day, the geopolitical concerns became the caveat in
dragging markets lower and then a sharp profit booking in US
markets weighed down heavily. All in all, our markets needed some
reason to correct and it was provided by all these developments. The
velocity of the fall after a relentless run is generally scary and hence,
we were advocating some caution since last a couple of weeks.
Because it is very difficult to react to such sharp u-turns and we may
remain caught on the wrong side. Hence, sometimes it’s better to be
a bit proactive. Now looking at the technical set up, we can see a
formation of ‘Bearish Engulfing’ pattern on weekly chart. It is
generally considered a reversal pattern and a breach of 11300 would
result into a confirmation of the same. In this case, we may see
immediate decline towards 11150-11000-10870 in near term.
However, it is important to take a note that since the larger degree
trend is strongly up, we would consider any decline as a corrective
move within the up trend and hence, it will nowhere be closer or
similar to March’s mayhem. In fact, it would certainly provide better
opportunities to accumulate quality propositions for a longer run.
Exhibit 2: Nifty Bank Daily Chart
In case, if market witnesses some bounce back, 11500-11650
remains to be a stiff hurdle. Also, it would now be very difficult for
Nifty to surpass 11800 soon. It is most likely that we would either
see some price or time wise correction before Nifty heading towards
pre-COVID levels. Let see how things pan out and since a lot of news
flow on domestic as well as global front is likely to drive short term
moves, we advise traders to keep a regular tab on these
developments. Also, in our sense, we are likely to get decent stock
specific opportunities on both sides and hence, it’s better to follow
them by maintaining strict stop losses.
.Key Levels
Support 1 – 11200
Resistance 1 – 11450
Support 2 – 11150
Resistance 2 – 11500
2
www.angelbroking.com
Technical & Derivatives Report
September 07, 2020
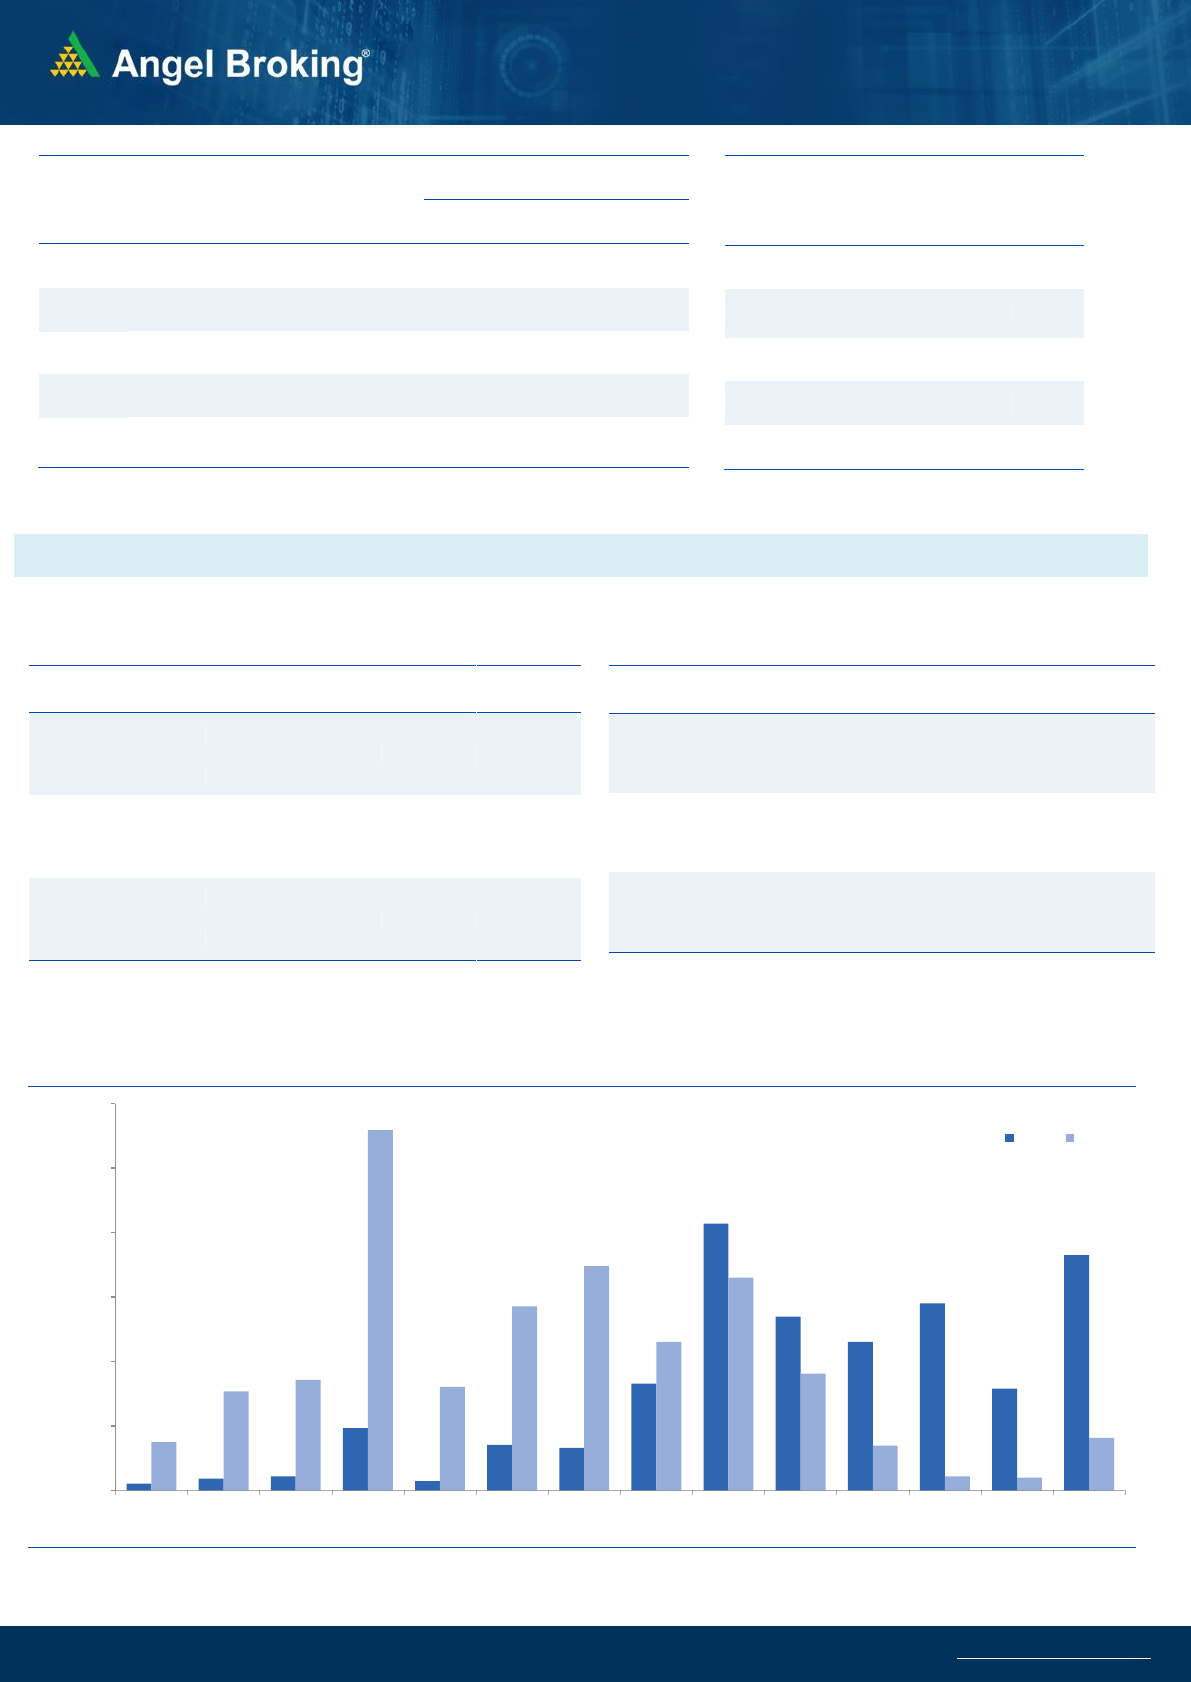
Nifty Vs OI
11100
11200
11300
11400
11500
11600
11700
,0
2,000
4,000
6,000
8,000
10,000
12,000
14,000
16,000
8/20 8/21 8/24 8/25 8/26 8/278/288/31 9/1 9/2 9/3 9/4
(`000)
Openinterest Nifty
Views
Nifty started the week with a gap up opening, but
witnessed a sharp sell off in Monday’s session. After
some consolidation during the week, the index again
corrected on Friday and ended the week with a loss of
over 300 points over previous week’s close.
FIIs were net sellers in the cash market segment to the
tune of Rs. 1889 crores. In index futures, they sold worth
696 crores with no relevant change in open interest
indicating a combination of both long unwinding and
short formation on Friday.
FII’s started the September series with good amount of
long positions in the index futures; however, as the
market corrected they unwound some of their longs
and even added some short positions. Due to this, their
‘Long Short Ratio’ has declined from 77 percent to 53.6
percent. The weekly options data indicate a stiff
resistance 11500-11600 for the coming week. No
major put writing is seen yet and positions indicate
support around the 11000 mark. INDIA VIX increased
by 20% during the week and ended above 22 mark. The
above derivatives data and the positioning by the
stronger hands indicate uncertainty in the near term.
Hence, traders are advised to stay light on positions and
look for stock specific opportunities where
opportunities could be there on both the sides of the
trade.
Comments
The Nifty futures open interest has increased by 1.77%
Bank Nifty futures open interest has decreased by 2.82%
as market closed at 11333.85 levels.
The Nifty September future closed with a premium of 17.9
point against a premium of 15.35 point in last trading
session. The October series closed at a premium of 36.15
point.
The INDIA VIX has increased from 20.50 to 22.15.
At the same time, the PCR-OI of Nifty decreased from
1.33 to 1.22.
Few of the liquid counters where we have seen high cost
of carry are ESCORTS, GMRINFRA, BHARTIARTL,
JSWSTEEL AND BAJAJ AUTO.
OI Gainers
SCRIP
OI
OI
CHG. (%)
PRICE
PRICE
CHG. (%)
RAMCOCEM
1175550
12.17
716.00
-1.33
INFRATEL
15646400
10.17
214.85
-1.39
AMBUJACEM
13896000
9.14
208.50
-2.85
TORNTPOWER
2349000
8.30
333.15
-1.57
PVR
1584858
7.24
1386.85
0.09
POWERGRID
11584000
6.86
175.05
-1.90
BHEL
72618000
5.62
38.70
-3.85
SHREECEM
161750
4.76
20020.55
-1.84
OI Losers
SCRIP
OI
OI
CHG. (%)
PRICE
PRICE
CHG. (%)
IDEA
429380000
-14.47
12.04
-4.74
CANBK
12190000
-13.85
103.25
-3.14
TORNTPHARM
1211500
-12.78
2769.25
-1.10
UBL
984900
-11.23
1120.10
-2.16
BANDHANBNK
18885600
-10.81
314.45
0.13
ZEEL
29994000
-9.08
220.40
-0.14
MINDTREE
1660800
-8.95
1194.10
-1.57
ESCORTS
2701600
-8.73
1182.45
-2.92
Put-Call Ratio
SCRIP
PCR-OI
PCR-VOL
NIFTY
1.22
0.83
BANKNIFTY
0.76
0.89
RELIANCE
0.54
0.46
ICICIBANK
0.47
0.52
INFY
0.48
0.37
Historical Volatility
SCRIP
HV
NTPC
40.14
PAGEIND
48.28
TATACHEM
43.72
TATASTEEL
55.92
DRREDDY
36.90
3
www.angelbroking.com
Technical & Derivatives Report
September 07, 2020
Note: Above mentioned Bullish or Bearish Spreads in Nifty (September Series) are given as an information and not as a recommendation.
Nifty Spot = 11333.85
00 Lot Size = 75
FII Statistics for September 04, 2020
Detail
Buy
Sell
Net
Open Interest
Contracts
Value
(in Cr.)
Change
(%)
INDEX
FUTURES
4678.07
5374.18
(696.11)
125885
10006.38
(0.14)
INDEX
OPTIONS
182023.86
181958.83
65.03
692043
54490.95
10.36
STOCK
FUTURES
14535.82
15139.08
(603.26)
1194320
84377.92
(2.06)
STOCK
OPTIONS
5263.45
5285.81
(22.36)
83522
5888.41
5.55
Total
206501.20
207757.90
(1256.70)
2095770
154763.66
2.15
Turnover on September 04, 2020
Instrument
No. of
Contracts
Turnover
( in Cr. )
Change
(%)
Index Futures
5,35,074
36458.35
49.70
Index Options
1,62,26,428
11,48,666.04
-66.55
Stock Futures
8,00,736
58698.85
9.67
Stock Options
10,75,764
83486.36
11.65
Total
1,86,38,002
13,27,309.60
-62.99
Bull-Call Spreads
Action
Strike
Price
Risk
Reward
BEP
Buy
11300
246.95
56.50
43.50
11356.50
Sell
11400
190.45
Buy
11300
246.95
105.50
94.50
11405.50
Sell
11500
141.45
Buy
11400
190.45
49.00
51.00
11449.00
Sell
11500
141.45
Bear-Put Spreads
Action
Strike
Price
Risk
Reward
BEP
Buy
11300
197.30
37.75
62.25
11262.25
Sell
11200
159.55
Buy
11300
197.30
67.50
132.50
11232.50
Sell
11100
129.80
Buy
11200
159.55
29.75
70.25
11170.25
Sell
11100
129.80
Nifty Put-Call Analysis
,0
500,000
1000,000
1500,000
2000,000
2500,000
3000,000
10700 10800 10900 11000 11100 11200 11300 11400 11500 11600 11700 11800 11900 12000
Call Put

4
www.angelbroking.com
Technical & Derivatives Report
September 07, 2020
Daily Pivot Levels for Nifty Constituents
Scrips
S2
S1
PIVOT
R1
R2
ADANIPORTS
344
348
356
361
368
ASIANPAINT
1,924
1,940
1,967
1,983
2,010
AXISBANK
440
448
460
468
481
BAJAJ-AUTO
2,797
2,840
2,883
2,926
2,969
BAJFINANCE
3,460
3,528
3,589
3,657
3,718
BAJAJFINSV
6,078
6,178
6,300
6,400
6,522
BPCL
395
399
405
409
415
BHARTIARTL
508
516
527
534
545
INFRATEL
194
205
218
228
241
BRITANNIA
3,627
3,667
3,738
3,777
3,848
CIPLA
698
711
731
744
763
COALINDIA
128
130
133
135
139
DRREDDY
4,174
4,248
4,366
4,440
4,557
EICHERMOT
2,130
2,155
2,191
2,216
2,252
GAIL
95
96
98
99
101
GRASIM
684
695
710
721
735
HCLTECH
687
694
699
706
712
HDFCBANK
1,095
1,107
1,116
1,128
1,137
HDFC
563
569
575
581
587
HEROMOTOCO
1,746
1,758
1,774
1,785
1,801
HINDALCO
2,811
2,863
2,920
2,972
3,029
HINDUNILVR
180
184
189
193
198
ICICIBANK
2,100
2,112
2,127
2,139
2,153
IOC
362
367
374
379
385
INDUSINDBK
82
83
84
85
86
INFY
582
599
621
638
659
ITC
906
913
921
928
936
JSW STEEL
183
185
187
189
192
KOTAKBANK
274
278
285
289
295
LT
1,336
1,358
1,376
1,399
1,417
M&M
930
936
946
952
962
MARUTI
613
622
636
646
660
NESTLEIND
6,801
6,995
7,160
7,354
7,519
NTPC
15,995
16,114
16,269
16,388
16,543
ONGC
92
93
95
97
99
POWERGRID
76
77
78
79
80
RELIANCE
171
173
176
177
180
SHREECEM
2,057
2,067
2,082
2,092
2,107
SBIN
19,608
19,817
20,158
20,367
20,708
SUNPHARMA
202
204
208
211
215
TCS
495
504
517
526
539
TATAMOTORS
2,231
2,260
2,292
2,321
2,353
TATASTEEL
143
145
149
152
156
TECHM
410
416
425
431
440
TITAN
735
742
750
757
765
ULTRACEMCO
1,128
1,143
1,171
1,187
1,214
UPL
3,857
3,887
3,909
3,939
3,961
VEDANTA
497
503
510
516
524
WIPRO
272
274
277
279
281
ZEEL
205
213
218
226
231

5
www.angelbroking.com
Technical & Derivatives Report
September 07, 2020
*
Research Team Tel: 022 – 39357600 (Extn. 6844) Website: www.angelbroking.com
For Technical & Derivatives Queries E-mail: technicalresearch-cso@angelbroking.com
DISCLAIMER
Angel Broking Limited (hereinafter referred to as “Angel”) is a registered Member of National Stock Exchange of India Limited, Bombay
Stock Exchange Limited and Metropolitan Stock Exchange Limited. It is also registered as a Depository Participant with CDSL and
Portfolio Manager and Investment Adviser with SEBI. It also has registration with AMFI as a Mutual Fund Distributor. Angel Broking
Limited is a registered entity with SEBI for Research Analyst in terms of SEBI (Research Analyst) Regulations, 2014 vide registration
number INH000000164. Angel or its associates has not been debarred/ suspended by SEBI or any other regulatory authority for
accessing /dealing in securities Market. Angel or its associates/analyst has not received any compensation / managed or co-managed
public offering of securities of the company covered by Analyst during the past twelve months.
This document is solely for the personal information of the recipient, and must not be singularly used as the basis of any investment
decision. Nothing in this document should be construed as investment or financial advice. Each recipient of this document should make
such investigations as they deem necessary to arrive at an independent evaluation of an investment in the securities of the companies
referred to in this document (including the merits and risks involved), and should consult their own advisors to determine the merits
and risks of such an investment.
Reports based on technical and derivative analysis center on studying charts of a stock's price movement, outstanding positions and
trading volume, as opposed to focusing on a company's fundamentals and, as such, may not match with a report on a company's
fundamentals. Investors are advised to refer the Fundamental and Technical Research Reports available on our website to evaluate the
contrary view, if any.
The information in this document has been printed on the basis of publicly available information, internal data and other reliable
sources believed to be true, but we do not represent that it is accurate or complete and it should not be relied on as such, as this
document is for general guidance only. Angel Broking Limited or any of its affiliates/ group companies shall not be in any way
responsible for any loss or damage that may arise to any person from any inadvertent error in the information contained in this report.
Angel Broking Limited has not independently verified all the information contained within this document. Accordingly, we cannot
testify, nor make any representation or warranty, express or implied, to the accuracy, contents or data contained within this document.
While Angel Broking Limited endeavors to update on a reasonable basis the information discussed in this material, there may be
regulatory, compliance, or other reasons that prevent us from doing so.
This document is being supplied to you solely for your information, and its contents, information or data may not be reproduced,
redistributed or passed on, directly or indirectly.
Neither Angel Broking Limited, nor its directors, employees or affiliates shall be liable for any loss or damage that may arise from or in
connection with the use of this information.
Technical and Derivatives Team:
Sameet Chavan Chief Analyst - Technical & Derivatives sameet.chavan@angelbroking.com
Ruchit Jain Senior Analyst - Technical & Derivatives ruchit.jain@angelbroking.com
Rajesh Bhosale Technical Analyst rajesh.bhosle@angelbroking.com
