www.angelbroking.com
April 07
, 2021
Technical & Derivatives Report
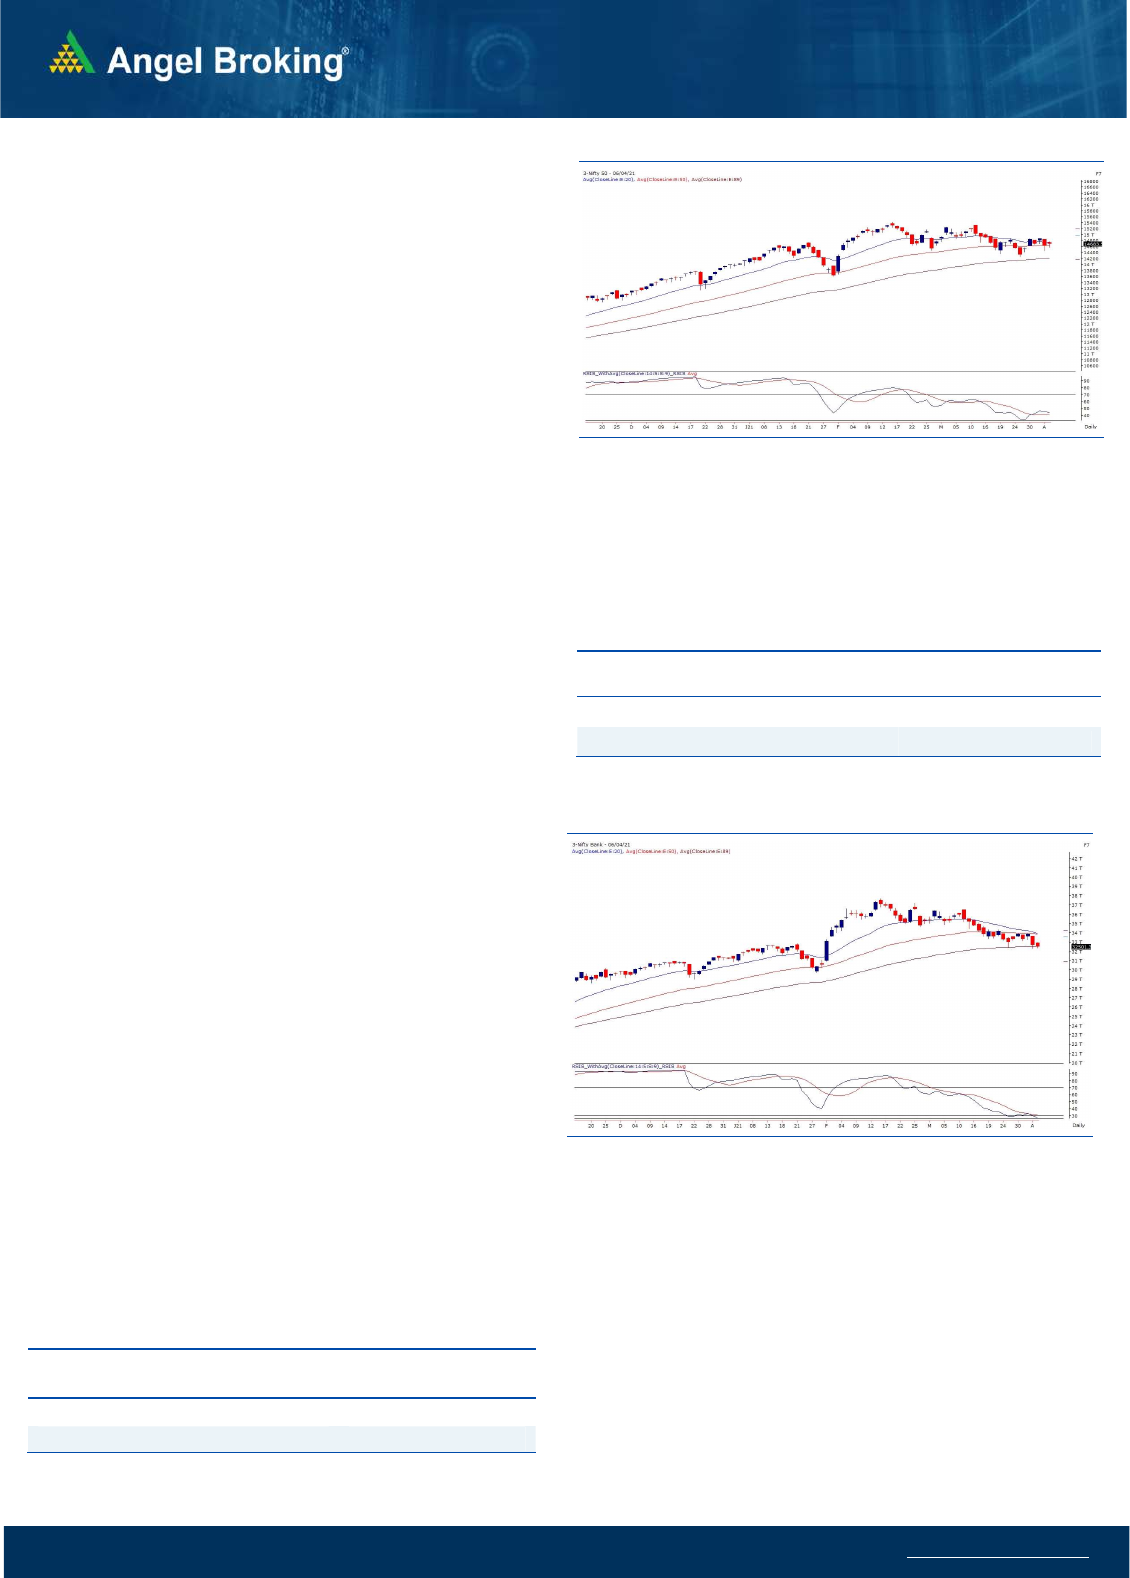
Exhibit 1: Nifty Daily Chart
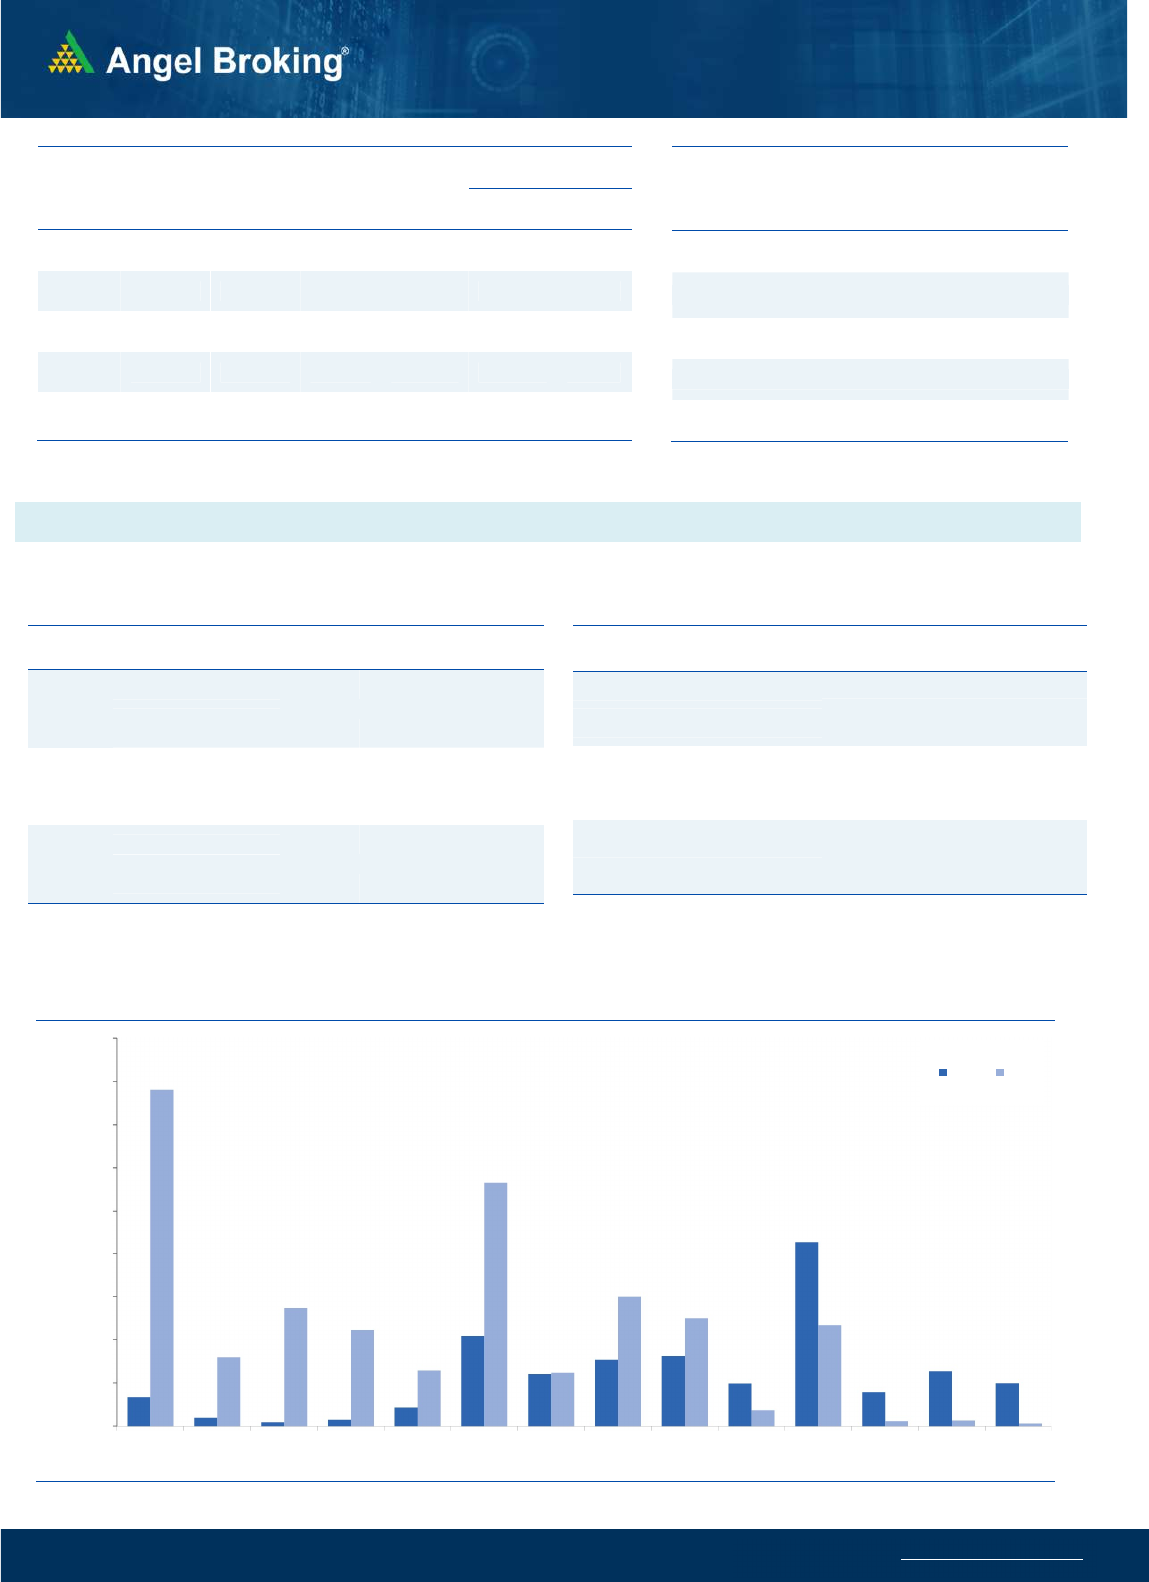
Nifty
Bank Out
look
-
(
32501
)
Although the global market were not so encouraging, we managed
to start-off with an upside gap but within a blink of eye sneaked
below 32350. However, this dip got bought into in next couple of
minutes and we saw a sharp recovery towards 33000 mark. In the
midst, the BankNifty witnessed another round of selling to towards
32400 and then eventually concluded the choppy day with a cut of
half a percent to its previous day close.
As we already highlighted, the BankNifty is now placed around very
crucial levels (around 89 EMA in daily chart which recently acted as
demand zone) and follow up move from hereon shall dictated the
near term directional move. Hence, traders should keep a close tab
especially on the banking index as any upmove in broader market
without the support of BankNifty wouldn’t be sustainable. As far as
levels are concerned, 32300 is a key level to watch out now and
breach of this may open doors for sub-31000 levels; whereas, on
the higher side 33000-33200 shall be the immediate supply zone.
Key Levels
Support 1 – 32300 Resistance 1 – 33000
Support 2 – 32000 Resistance 2 – 33200
Sensex (49201) / Nifty (14683)
Yesterday morning, the global set up looked a bit sluggish and
despite this, our benchmark managed to kick off the session with an
upside gap. However, these gains were merely a formality, as we
witnessed key indices paring down all gains to enter a negative
territory in the initial trades. This was followed by a smart recovery
in the subsequent hour after entering a sub-14600 territory. This
process got repeated as we witnessed swings on both sides
throughout the remaining part of the session. Eventually, with the
help of last hour gradual recovery, Nifty managed to secure three
tenths of a percent gains.
It was clearly a choppy session for indices but the real action was
seen in individual pockets. The entire ‘Pharma’ space kept buzzing
throughout the session along with the broader end of the spectrum.
So it seems, key indices have opted for some breather before
deciding the next path of action. As we mentioned in the previous
commentary, the banking plays a vital role here as it has reached a
crucial support base and should now be considered a ‘Make or Break’
zone in the near term. If the Nifty has to see some recovery form
heron, the banking counters need to regain strength. If they fail to
do so, we may see further weakness in days to come.
Exhibit 2: Nifty Bank Daily Chart
As far as levels are concerned, 14750 followed by 14780 are to be
seen as immediate hurdles; whereas on the flipside, 14550 – 14440
remains an intraday support zone. Since individual stocks are
performing well and providing better opportunities, it’s better to
stick to stock centric approach till the time indices confirm their near
term direction.
Key Levels
Support 1 – 14550 Resistance 1 – 14750
Support 2 – 14440 Resistance2 – 14780

www.angelbroking.com
Technical & Derivatives Report
April 07
, 2021
Nifty Vs OI
13800
14000
14200
14400
14600
14800
15000
15200
15400
,0
20,000
40,000
60,000
80,000
100,000
120,000
140,000
160,000
3/10 3/16 3/18 3/22 3/24 3/26 3/31 4/5
(`000)
Openinterest Nifty
View
Nifty traded within a narrow range in yesterday's
session wherein some unwinding of positions were
seen. However, the banking index remained under
pressure and continued its underperformance due to
long unwinding. Nifty ended the day with marginal
gains while Bank Nifty ended with a loss of half a
percent
.
FIIs were net sellers in the cash segment to the tune of
Rs. 1093 crores. In index futures front, they bought
worth Rs. 298 crores with decrease in open interest
indicating short covering in yesterday’s session.
FII's marginally unwound their short positions in the
index futures segment yesterday. In options segment,
14800 and 15000 calls have decent amount of open
interest outstanding. Thus, 14800 is the immediate
resistance for next couple of sessions followed by
15000. On the flip side, options data hints support
around 14500. We are witnessing a lot of stock
specific momentum and hence, traders are advised to
capitalize on the same
.
C
o
m
me
n
t
s
The Nifty futures open interest has decreased by 1.69%.
Bank Nifty futures open interest has decreased by 6.02%
as market closed at 14683.50 levels.
The Nifty April future closed with a premium of point
67.95 against a premium of 60.65 point in last trading
session. The May series closed at a premium of 118.25
point.
The INDIA VIX decreased from 21.21 to 20.84.
At the same time, the PCR-OI of Nifty increased from 1.07
to 1.13.
Few of the liquid counters where we have seen high cost
of carry are IDEA, MFSL, TITAN, SAIL, BANKBARODA.
OI Gainers
SCRIP OI
OI
CHG. (%)
PRICE
PRICE
CHG. (%)
NAVINFLUOR 280800 38.98 2926.90 6.94
SRF 483000 31.52 6111.70 8.21
DEEPAKNTR 1060000 22.26 1657.15 2.71
TRENT 1202775 17.24 703.65 -3.31
MGL 1564800 16.69 1093.80 -3.12
LALPATHLAB 296500 16.27 3061.20 5.38
SAIL 149644000 12.61 91.05 2.17
UBL 1267700 12.55 1109.90 -2.95
OI Losers
SCRIP OI
OI
CHG. (%)
PRICE
PRICE
CHG. (%)
ACC 2921500 -7.59 1908.45 0.70
RAMCOCEM 1522350 -7.35 1042.15 3.05
NAUKRI 1288750 -6.75 4500.05 1.64
MUTHOOTFIN 2652750 -4.66 1204.30 1.92
LICHSGFIN 6176000 -4.66 419.50 0.44
PETRONET 17265000 -4.54 228.15 0.48
IGL 5682875 -4.51 504.25 -0.42
APOLLOHOSP 1841500 -4.26 2983.50 2.21
Put-Call Ratio
SCRIP PCR-OI PCR-VOL
NIFTY 1.13 0.93
BANKNIFTY 0.59 0.91
RELIANCE 0.59 0.50
ICICIBANK 0.48 0.36
INFY 0.53 0.36
Historical Volatility
SCRIP HV
IDEA 111.22
MFSL 60.60
TITAN 41.90
SAIL 67.03
BANKBARODA 62.98
www.angelbroking.com
Technical & Derivatives Report
April 07
, 2021
Note: Above mentioned Bullish or Bearish Spreads in Nifty (April Series) are given as an information and not as a recommendation.
Nifty Spot =
14683.50
FII Statistics for April 06, 2021
Detail Buy
Net Contracts
Open Interest
Sell
Value
(in Cr.)
Change
INDEX
FUTURES
4807.69
4509.42
298.27
118337
12239.05
(2.32)
INDEX
OPTIONS
446017.06
443528.97
2488.09
921678
92922.02
14.72
STOCK
FUTURES
11343.19
11194.04
149.15
1076812
92874.05
(0.48)
STOCK
OPTIONS
9025.19
8995.41
29.78
133952
11901.89
5.16
Total 471193.13
468227.84
2965.29
2250779
209937.01
5.47
Turnover on April 06, 2021
Instru
ment
No. of
Contracts
Turnover
( in Cr. )
Change
(%)
Index Futures
3,54,604 33564.46 -25.47
Index Options
3,42,66,325 32,56,355.37 19.88
Stock Futures
6,08,196 62106.94 -10.47
Stock Options
12,62,384 1,33,630.77 29.61
Total 3,64,91,509 34,85,657.55 17.44
Bull-Call Spreads
Action Strike Price Risk Reward BEP
Buy 14700 327.45
55.30 44.70 14755.30
Sell 14800 272.15
Buy 14700 327.45
104.80 95.20 14804.80
Sell 14900 222.65
Buy 14800 272.15
49.50 50.50 14849.50
Sell 14900 222.65
Bear-Put Spreads
Action Strike Price Risk Reward BEP
Buy 14700 276.55
38.30 61.70 14661.70
Sell 14600 238.25
Buy 14700 276.55
72.75 127.25 14627.25
Sell 14500 203.80
Buy 14600 238.25
34.45 65.55 14565.55
Sell 14500 203.80
Nifty Put-Call Analysis
,0
500,000
1000,000
1500,000
2000,000
2500,000
3000,000
3500,000
4000,000
4500,000
14000 14100 14200 14300 14400 14500 14600 14700 14800 14900 15000 15100 15200 15300
Call Put

www.angelbroking.com
Technical & Derivatives Report
April 07
, 2021
Da
ily
Pivot Level
s for
Nifty Constituents
Scrips
S2
S1
PIVOT
R1
R2
ADANIPORTS
701
768
810
878
920
ASIANPAINT 2,463 2,537
2,579
2,653
2,694
AXISBANK
664
671
682
689
700
BAJAJ-AUTO 3,582 3,599
3,619
3,636
3,657
BAJFINANCE 4,895 4,944
5,002
5,051
5,109
BAJAJFINSV 9,390 9,455
9,540
9,605
9,690
BPCL
419
424
429
433
438
BHARTIARTL
518
525
532
539
545
BRITANNIA 3,659 3,695
3,716
3,751
3,772
CIPLA
811
824
834
847
857
COALINDIA
128
129
130
132
133
DIVISLAB 3,543 3,615
3,657
3,730
3,771
DRREDDY 4,502 4,561
4,600
4,659
4,698
EICHERMOT 2,431 2,459
2,506
2,534
2,581
GRASIM 1,413 1,423
1,436
1,446
1,459
HCLTECH 1,009 1,019
1,030
1,039
1,050
HDFCBANK 1,415 1,428
1,445
1,458
1,475
HDFCLIFE
672
685
693
705
713
HDFC 2,413 2,443
2,465
2,494
2,516
HEROMOTOCO 2,835 2,861
2,895
2,921
2,955
HINDALCO
343
347
352
356
362
HINDUNILVR 2,365 2,387
2,399
2,420
2,433
ICICIBANK
556
561
570
575
584
IOC
90
90
91
92
93
INDUSINDBK
902
914
934
947
967
INFY 1,395 1,403
1,415
1,423
1,434
ITC
208
210
213
215
217
JSW STEEL
512
525
533
546
554
KOTAKBANK 1,707 1,738
1,759
1,790
1,812
LT 1,381 1,391
1,404
1,414
1,427
M&M
766
774
783
790
799
MARUTI 6,646 6,699
6,773
6,826
6,900
NESTLEIND 16,681
16,881
17,001
17,201
17,321
NTPC
104
105
107
108
109
ONGC
100
102
103
105
106
POWERGRID
202
205
212
216
223
RELIANCE 1,950 1,967
1,986
2,003
2,022
SBILIFE
852
875
889
912
926
SHREECEM 29,719
29,916
30,208
30,406
30,698
SBIN
345
348
352
355
360
SUNPHARMA
597
609
615
627
634
TCS 3,212 3,238
3,257
3,283
3,302
TATACONSUM
623
649
664
690
705
TATAMOTORS
300
304
309
313
318
TATASTEEL
843
853
868
878
892
TECHM
977
984
996
1,003
1,015
TITAN 1,489 1,507
1,528
1,546
1,567
ULTRACEMCO 6,622 6,680
6,764
6,821
6,906
UPL
635
648
658
672
682
WIPRO
420
423
426
430
433

www.angelbroking.com
Technical & Derivatives Report
April 07
, 2021
*
Research Team Tel: 022 – 39357600 (Extn. 6844) Website: www.angelbroking.com
For Technical Queries E-mail: technicalresearch-cso@angelbroking.com
For Derivatives Queries E-mail: derivatives.desk@angelbroking.com
DISCLAIMER
Angel Broking Limited (hereinafter referred to as “Angel”) is a registered Member of National Stock Exchange of India Limited, Bombay
Stock Exchange Limited and Metropolitan Stock Exchange Limited. It is also registered as a Depository Participant with CDSL and
Portfolio Manager and Investment Adviser with SEBI. It also has registration with AMFI as a Mutual Fund Distributor. Angel Broking
Limited is a registered entity with SEBI for Research Analyst in terms of SEBI (Research Analyst) Regulations, 2014 vide registration
number INH000000164. Angel or its associates has not been debarred/ suspended by SEBI or any other regulatory authority for
accessing /dealing in securities Market. Angel or its associates/analyst has not received any compensation / managed or co-managed
public offering of securities of the company covered by Analyst during the past twelve months.
This document is solely for the personal information of the recipient, and must not be singularly used as the basis of any investment
decision. Nothing in this document should be construed as investment or financial advice. Each recipient of this document should make
such investigations as they deem necessary to arrive at an independent evaluation of an investment in the securities of the companies
referred to in this document (including the merits and risks involved), and should consult their own advisors to determine the merits
and risks of such an investment.
Reports based on technical and derivative analysis center on studying charts of a stock's price movement, outstanding positions and
trading volume, as opposed to focusing on a company's fundamentals and, as such, may not match with a report on a company's
fundamentals. Investors are advised to refer the Fundamental and Technical Research Reports available on our website to evaluate the
contrary view, if any.
The information in this document has been printed on the basis of publicly available information, internal data and other reliable
sources believed to be true, but we do not represent that it is accurate or complete and it should not be relied on as such, as this
document is for general guidance only. Angel Broking Limited or any of its affiliates/ group companies shall not be in any way
responsible for any loss or damage that may arise to any person from any inadvertent error in the information contained in this report.
Angel Broking Limited has not independently verified all the information contained within this document. Accordingly, we cannot
testify, nor make any representation or warranty, express or implied, to the accuracy, contents or data contained within this document.
While Angel Broking Limited endeavors to update on a reasonable basis the information discussed in this material, there may be
regulatory, compliance, or other reasons that prevent us from doing so.
This document is being supplied to you solely for your information, and its contents, information or data may not be reproduced,
redistributed or passed on, directly or indirectly.
Technical and Derivatives Team:
Sameet Chavan Chief Analyst - Technical & Derivatives sameet.chavan@angelbroking.com
Ruchit Jain Senior Analyst - Technical & Derivatives ruchit.jain@angelbroking.com
Rajesh Bhosale Technical Analyst rajesh.bhosle@angelbroking.com
Sneha Seth Derivatives Analyst sneha.seth@angelbroking.com
