www.angelbroking.com
Technical & Derivatives Report
August 06, 2020
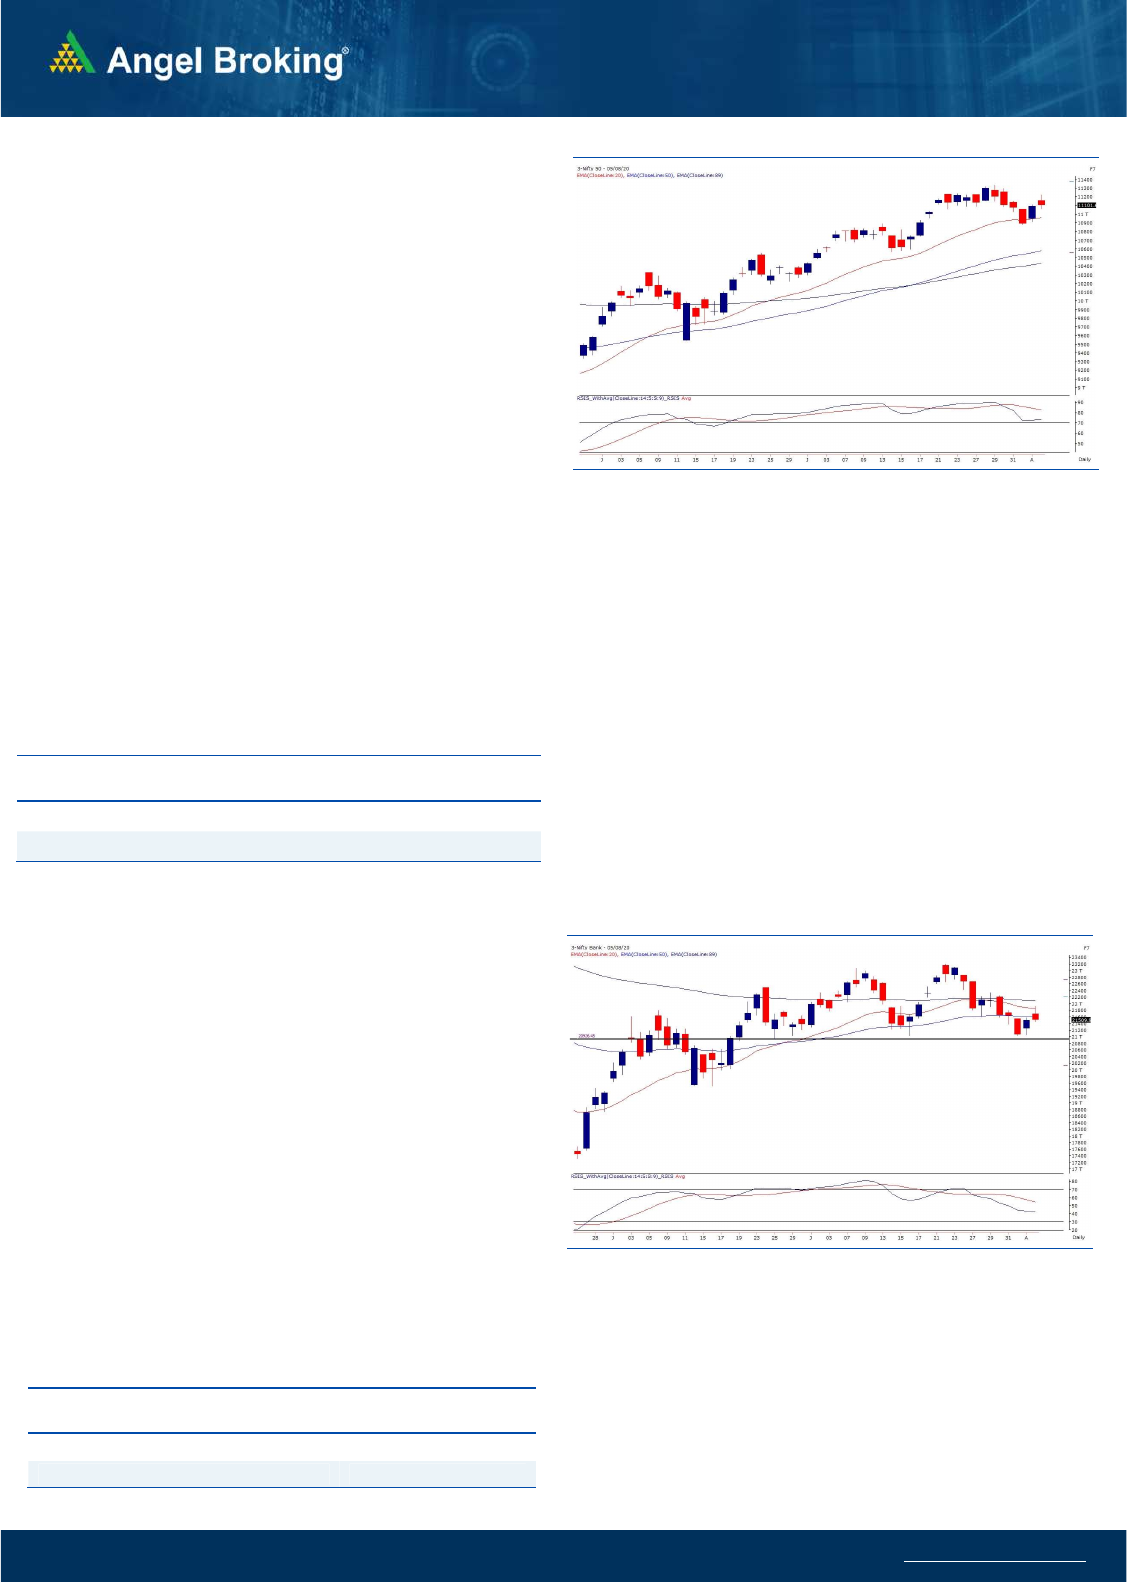
Nifty
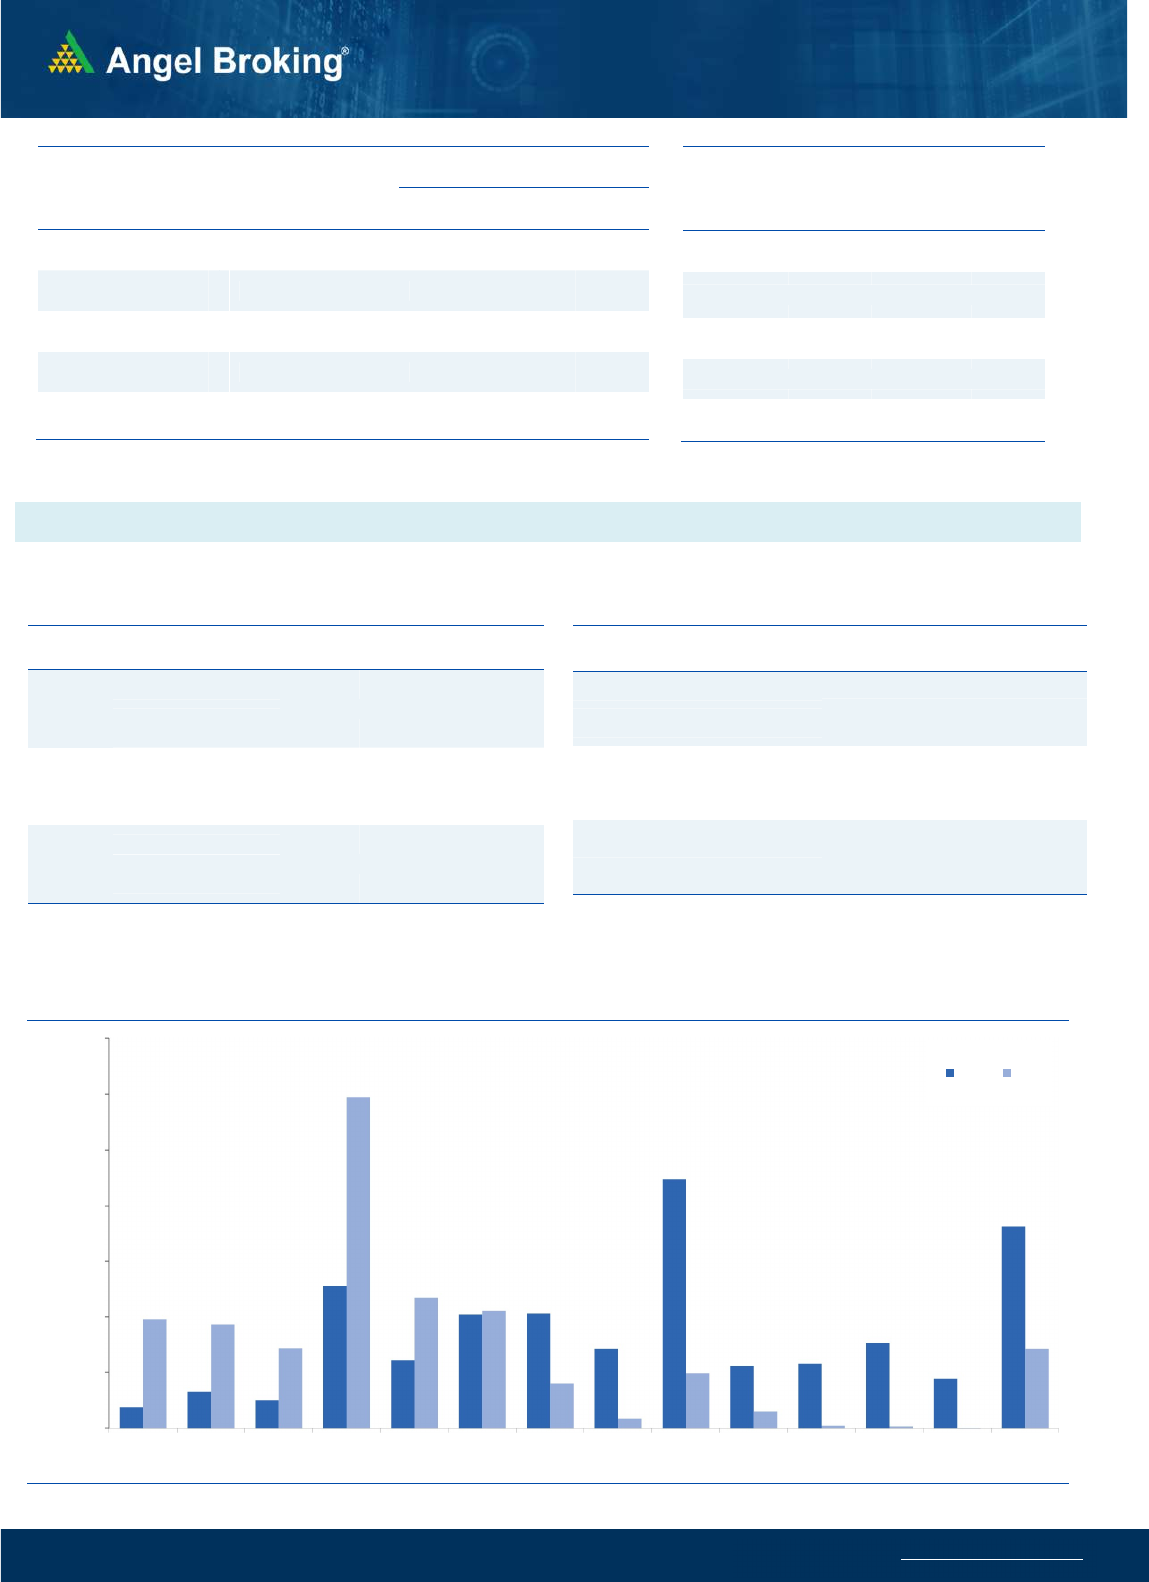
Bank Out
look
-
(
21510
)
Following the positive momentum from the previous session, the
bank index started on a positive note however it failed to hold on
the higher levels and slipped lower to end flat tad above 21500
levels.
On Tuesday, Bank Nifty defended the key support of swing low
at 21000 and triggered a smart bounce back. However, ahead of
the key RBI policy, the bank index witnessed a volatile session in
yesterday's session. Going ahead, we sense as long 21000 levels
are defended we are likely to see dips getting bought into. In such
a scenario, 21350 and 21200 levels are likely to act as immediate
intraday support. On the flip side, immediate resistance is placed
around 21750 and 22000 levels. On the policy day, traders are
advised to have a stock-specific approach from the basket with
proper exit set up.
Key Levels
Support 1 – 21350 Resistance 1 – 21750
Support 2 – 21200 Resistance 2 – 22000
Exhibit 1: Nifty Daily Chart
Sensex (37663) / Nifty (11102)
We had a v-shaped recovery on Tuesday to recoup Monday’s entire
losses. Since the broader market was on a recovery mode; courtesy
to decent rebound in banking stocks, the stage was all set for a
positive start yesterday. Very much in-line with this, our markets
opened higher and then continued it’s move northwards to surpass
the 11200 mark in initial hours. However, all of a sudden, the Nifty
took a complete nosedive not only to wipe off gains but also to
sneak inside the negative terrain. After this, the market kept gyrating
in a band of 90 points with some volatility to conclude on a flat note
at 11100.
Yesterday’s wild swings had nothing to do with global peers;
because they have been trading firmly in the green since morning.
In fact, traders were completely clueless about such wild swings.
May be, this indecision has something to do with the RBI monetary
policy slated today. Now as far as levels are concerned, 11020
followed by 10900 remains to be an immediate support zone and
on the upside, 11160 – 11235 are the levels to watch out for. As of
now, there is no hint of the market experiencing a big bang move
on the policy day but in case if it happens, then a directional move
is possible only outside the range of 11235 – 10900.
Key Levels
Support 1 – 11000 Resistance 1 – 11160
Support 2 – 10900 Resistance 2 – 11235
Exhibit 2: Nifty Bank Daily Chart
Although markets were a bit lethargic in the latter half, the action
was not at all missing in individual stocks. In fact, we would rather
rate it as one of the best days for stock specific moves in the last few
days. The Metal and Auto counters had spectacular moves along
with broader market participation. In fact, taking a glance at the Nifty
Midcap 50 index, further up move of nearly 2% would lead to a
strong breakout in this space. Hence, even if the benchmark index
consolidates, traders should not miss stupendous moves in
individual stocks especially from Midcap universe.

www.angelbroking.com
Technical & Derivatives Report
August 06, 2020
Nifty Vs OI
10600
10700
10800
10900
11000
11100
11200
11300
11400
,0
2,000
4,000
6,000
8,000
10,000
12,000
14,000
16,000
7/207/217/227/237/247/277/287/297/307/31 8/3 8/4 8/5
(`000)
Openinterest Nifty
View
s
Post a positive momentum in the first hour of the trade,
the index retraced back and gave up the intraday gains
to end almost on a flat note.
FIIs were net sellers in the cash market segment to the
tune of Rs. 60 crores. In index futures, they sold worth
528 crores with decrease in open interest indicating
long unwinding in yesterday’s session
.
Both the indices, Nifty and Bank Nifty witnessed
unwinding of positions ahead of the RBI policy and
weekly expiry. FII's unwound some of their long
positions in the index futures segment. In options
segment, 11200 and 11300 call options added good
amount of open interest whereas 11100 and 11000
puts added some OI. The options data indicates a
broader range of 11000-11200 for the weekly expiry
day. Traders are advised to trade with a positive bias
and look for buying opportunities in intraday declines.
C
o
mme
n
t
s
The Nifty futures open interest has decreased by 5.49%
Bank Nifty futures open interest has decreased by 7.86%
as market closed at 11101.65 levels.
The Nifty August future closed with a premium of 16.35
point against a premium of 6.8 point in last trading
session. The September series closed at a premium of
22.35 point.
The INDIA VIX has decreased from 23.81 to 23.57
At the same time, the PCR-OI of Nifty decreased from
1.42 to 1.26.
Few of the liquid counters where we have seen high cost
of carry are NATIONALUM, GMRINFRA, GAIL, SAIL AND
COALINDIA.
OI Gainers
SCRIP OI
OI
CHG. (%)
PRICE
PRICE
CHG. (%)
ITC 87824000 48.26 192.80 -0.08
SAIL 54758000 33.06 36.75 6.32
MFSL 2519400 30.33 549.40 2.26
MUTHOOTFIN 3927000 17.95 1257.90 -2.20
SRTRANSFIN 3392362 15.96 642.30 -1.75
FEDERALBNK 61191500 15.39 52.35 0.00
HINDALCO 31497500 13.48 175.75 8.01
ASHOKLEY 49248000 12.85 49.00 -1.20
OI Losers
SCRIP OI
OI
CHG. (%)
PRICE
PRICE
CHG. (%)
CHOLAFIN 6230000 -11.51 204.40 1.80
GODREJPROP 473850 -7.95 903.00 -3.33
AXISBANK 52587600 -7.34 434.95 1.47
TORNTPHARM 1780000 -5.32 2857.30 1.10
AMARAJABAT 1263000 -4.89 716.20 0.79
INFRATEL 12560800 -4.86 191.05 1.27
GODREJCP 4313000 -4.64 677.20 -2.41
BRITANNIA 1271400 -4.64 3850.05 0.75
Put-Call Ratio
SCRIP PCR-OI PCR-VOL
NIFTY 1.26 0.98
BANKNIFTY 0.75 0.91
RELIANCE 0.71 0.48
ICICIBANK 0.49 0.43
INFY 0.73 0.61
Historical Volatility
SCRIP HV
HINDALCO 67.23
TATASTEEL 57.86
NATIONALUM 54.91
BATAINDIA 49.09
SAIL 69.65
www.angelbroking.com
Technical & Derivatives Report
August 06, 2020
Note: Above mentioned Bullish or Bearish Spreads in Nifty (August Series) are given as an information and not as a recommendation.
Nifty Spot =
11101.65
FII Statistics for August 05, 2020
Detail Buy
Sell Net
Open Interest
Contracts
Value
(in Cr.)
Change
(%)
INDEX
FUTURES
3478.16
4006.22
(528.06) 94932
7234.92
(8.72)
INDEX
OPTIONS
297581.46
298301.60
(720.14) 677760
51547.98
7.45
STOCK
FUTURES
14554.74
14922.06
(367.32) 1271641
88022.24
1.20
STOCK
OPTIONS
6757.88
6712.16
45.72
62886
4218.26
8.44
Total 322372.24
323942.04
(1569.80) 2107219
151023.40
2.82
Turnover on August 05, 2020
Instrument
No. of
Contracts
Turnover
( in Cr. )
Change
(%)
Index Futures 5,18,975 33874.19 5.27
Index Options 2,94,24,155
19,93,437.85 56.80
Stock Futures 8,59,559 62274.99 3.33
Stock Options 10,66,190 84597.79 2.09
Total 3,18,68,879
21,74,184.82 50.29
Bull-Call Spreads
Action Strike Price Risk Reward BEP
Buy 11100 237.90
50.40 49.60 11150.40
Sell 11200 187.50
Buy 11100 237.90
91.95 108.05 11191.95
Sell 11300 145.95
Buy 11200 187.50
41.55 58.45 11241.55
Sell 11300 145.95
Bear-Put Spreads
Action Strike Price Risk Reward BEP
Buy 11100 219.70
41.90 58.10 11058.10
Sell 11000 177.80
Buy 11100 219.70
76.80 123.20 11023.20
Sell 10900 142.90
Buy 11000 177.80
34.90 65.10 10965.10
Sell 10900 142.90
Nifty Put-Call Analysis
,0
500,000
1000,000
1500,000
2000,000
2500,000
3000,000
3500,000
10700 10800 10900 11000 11100 11200 11300 11400 11500 11600 11700 11800 11900 12000
Call Put

www.angelbroking.com
Technical & Derivatives Report
August 06, 2020
Daily Pivot Levels for Nifty Constituents
Scrips
S2
S1
PIVOT
R1
R2
ADANIPORTS
308
317
323
333
339
ASIANPAINT 1,694 1,705
1,724
1,735
1,753
AXISBANK
425
430
438
443
452
BAJAJ-AUTO 2,942 2,976
3,005
3,039
3,069
BAJFINANCE 3,198 3,230
3,280
3,312
3,362
BAJAJFINSV 6,102 6,172
6,258
6,329
6,415
BPCL
400
405
410
415
420
BHARTIARTL
541
550
555
564
569
INFRATEL
187
189
191
193
195
BRITANNIA 3,805 3,827
3,850
3,873
3,896
CIPLA
709
715
723
729
737
COALINDIA
127
128
129
130
131
DRREDDY 4,532 4,567
4,616
4,651
4,700
EICHERMOT 20,687
21,323
21,796
22,431
22,904
GAIL
92
93
94
95
96
GRASIM
611
622
633
644
655
HCLTECH
669
679
691
700
712
HDFCBANK
999
1,013
1,034
1,049
1,070
HDFC
594
599
609
614
624
HEROMOTOCO
1,740
1,758
1,785
1,803
1,830
HINDALCO 2,635 2,665
2,703
2,733
2,771
HINDUNILVR
158
167
172
181
186
ICICIBANK 2,166 2,180
2,195
2,209
2,224
IOC
345
349
354
358
364
INDUSINDBK
85
86
87
88
89
INFY
480
487
496
502
512
ITC
925
935
948
958
971
JSW STEEL
190
191
193
194
196
KOTAKBANK
225
230
233
238
241
LT 1,305 1,320
1,336
1,351
1,367
M&M
913
920
927
933
941
MARUTI
596
605
612
622
629
NESTLEIND 6,284 6,405
6,501
6,623
6,719
NTPC 16,352
16,428
16,536
16,612
16,720
ONGC
85
85
86
87
87
POWERGRID
76
76
77
78
78
RELIANCE
174
175
176
178
179
SHREECEM 2,069 2,098
2,147
2,176
2,225
SBIN 21,203
21,653
21,902
22,352
22,601
SUNPHARMA
187
189
193
195
199
TCS
520
525
531
536
542
TATAMOTORS 2,224 2,242
2,271
2,289
2,318
TATASTEEL
109
112
115
118
121
TECHM
364
380
389
405
414
TITAN
632
640
651
659
670
ULTRACEMCO 1,063 1,084
1,099
1,121
1,136
UPL 3,960 4,001
4,055
4,096
4,150
VEDANTA
442
448
458
463
473
WIPRO
273
276
280
283
287
ZEEL
139
142
145
148
151

www.angelbroking.com
Technical & Derivatives Report
August 06, 2020
*
Research Team Tel: 022 – 39357600 (Extn. 6844) Website: www.angelbroking.com
For Technical & Derivatives Queries E-mail: technicalresearch-cso@angelbroking.com
DISCLAIMER
Angel Broking Limited (hereinafter referred to as “Angel”) is a registered Member of National Stock Exchange of India Limited, Bombay
Stock Exchange Limited and Metropolitan Stock Exchange Limited. It is also registered as a Depository Participant with CDSL and
Portfolio Manager and Investment Adviser with SEBI. It also has registration with AMFI as a Mutual Fund Distributor. Angel Broking
Limited is a registered entity with SEBI for Research Analyst in terms of SEBI (Research Analyst) Regulations, 2014 vide registration
number INH000000164. Angel or its associates has not been debarred/ suspended by SEBI or any other regulatory authority for
accessing /dealing in securities Market. Angel or its associates/analyst has not received any compensation / managed or co-managed
public offering of securities of the company covered by Analyst during the past twelve months.
This document is solely for the personal information of the recipient, and must not be singularly used as the basis of any investment
decision. Nothing in this document should be construed as investment or financial advice. Each recipient of this document should make
such investigations as they deem necessary to arrive at an independent evaluation of an investment in the securities of the companies
referred to in this document (including the merits and risks involved), and should consult their own advisors to determine the merits
and risks of such an investment.
Reports based on technical and derivative analysis center on studying charts of a stock's price movement, outstanding positions and
trading volume, as opposed to focusing on a company's fundamentals and, as such, may not match with a report on a company's
fundamentals. Investors are advised to refer the Fundamental and Technical Research Reports available on our website to evaluate the
contrary view, if any.
The information in this document has been printed on the basis of publicly available information, internal data and other reliable
sources believed to be true, but we do not represent that it is accurate or complete and it should not be relied on as such, as this
document is for general guidance only. Angel Broking Limited or any of its affiliates/ group companies shall not be in any way
responsible for any loss or damage that may arise to any person from any inadvertent error in the information contained in this report.
Angel Broking Limited has not independently verified all the information contained within this document. Accordingly, we cannot
testify, nor make any representation or warranty, express or implied, to the accuracy, contents or data contained within this document.
While Angel Broking Limited endeavors to update on a reasonable basis the information discussed in this material, there may be
regulatory, compliance, or other reasons that prevent us from doing so.
This document is being supplied to you solely for your information, and its contents, information or data may not be reproduced,
redistributed or passed on, directly or indirectly.
Technical and Derivatives Team:
Sameet Chavan Chief Analyst - Technical & Derivatives sameet.chavan@angelbroking.com
Ruchit Jain Senior Analyst - Technical & Derivatives ruchit.jain@angelbroking.com
Rajesh Bhosale Technical Analyst rajesh.bhosle@angelbroking.com
Sneha Seth Derivatives Analyst sneha.seth@angelbroking.com
