www.angelbroking.com
April 06, 2021
Technical & Derivatives Report
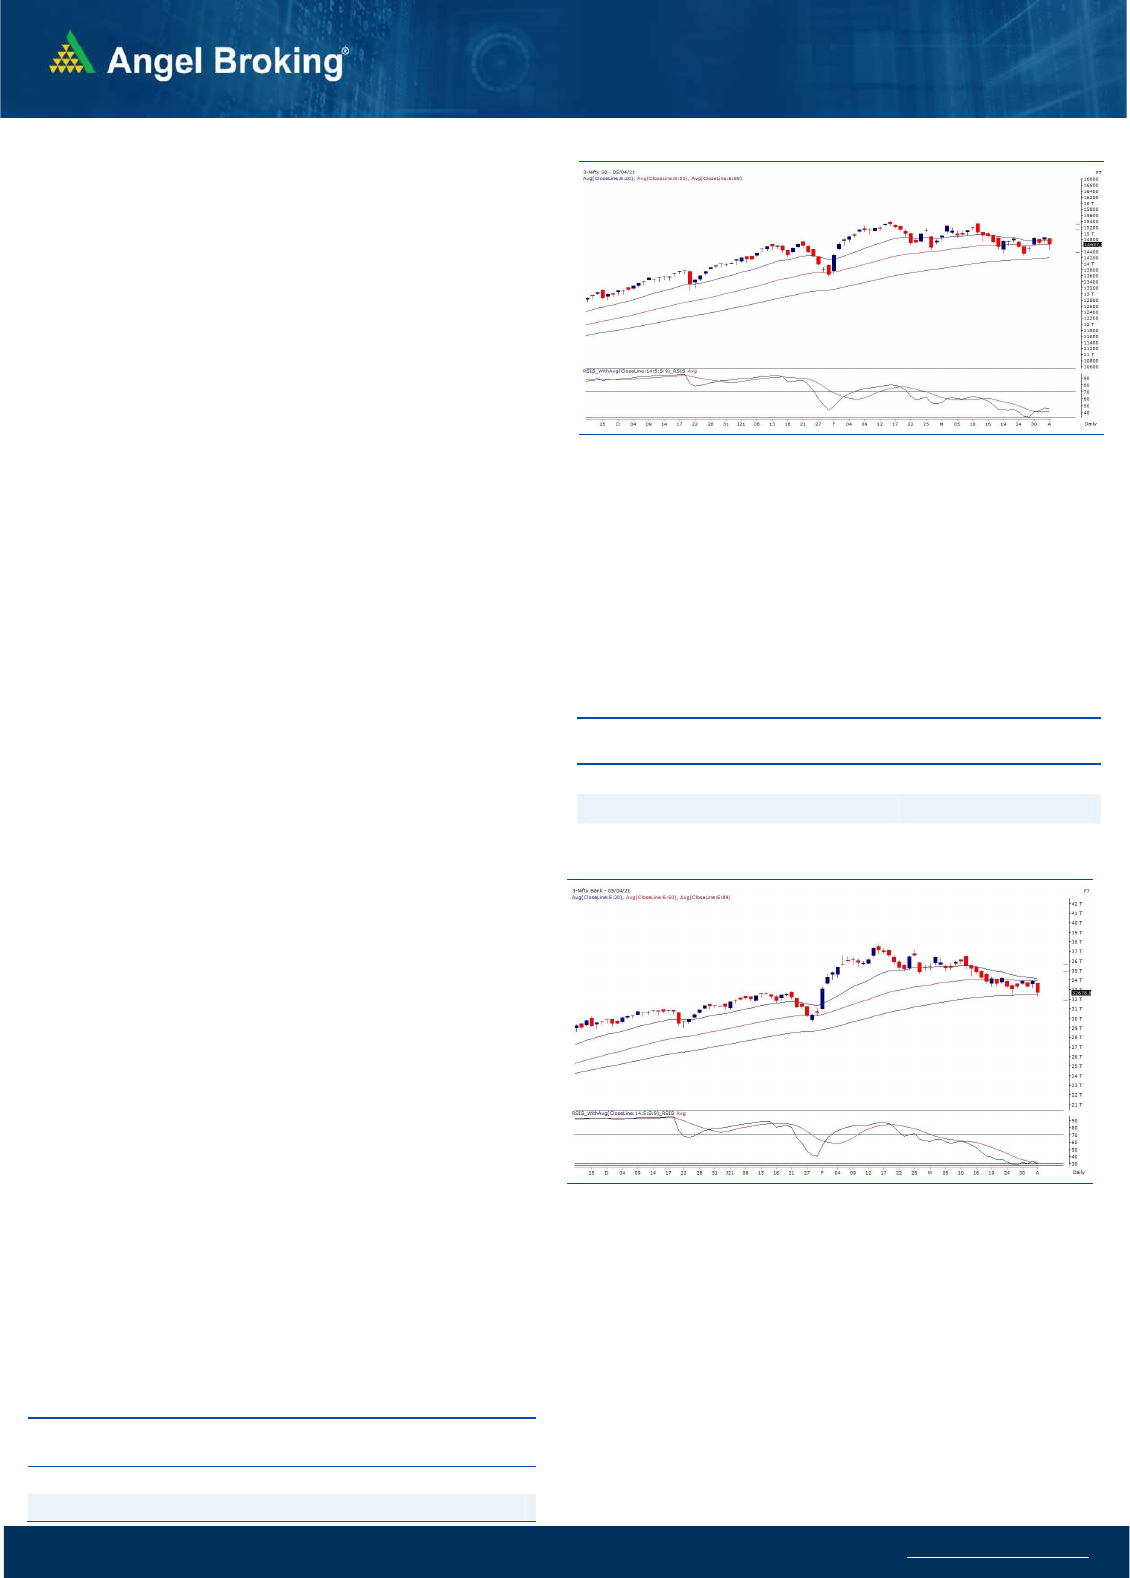
Exhibit 1: Nifty Daily Chart
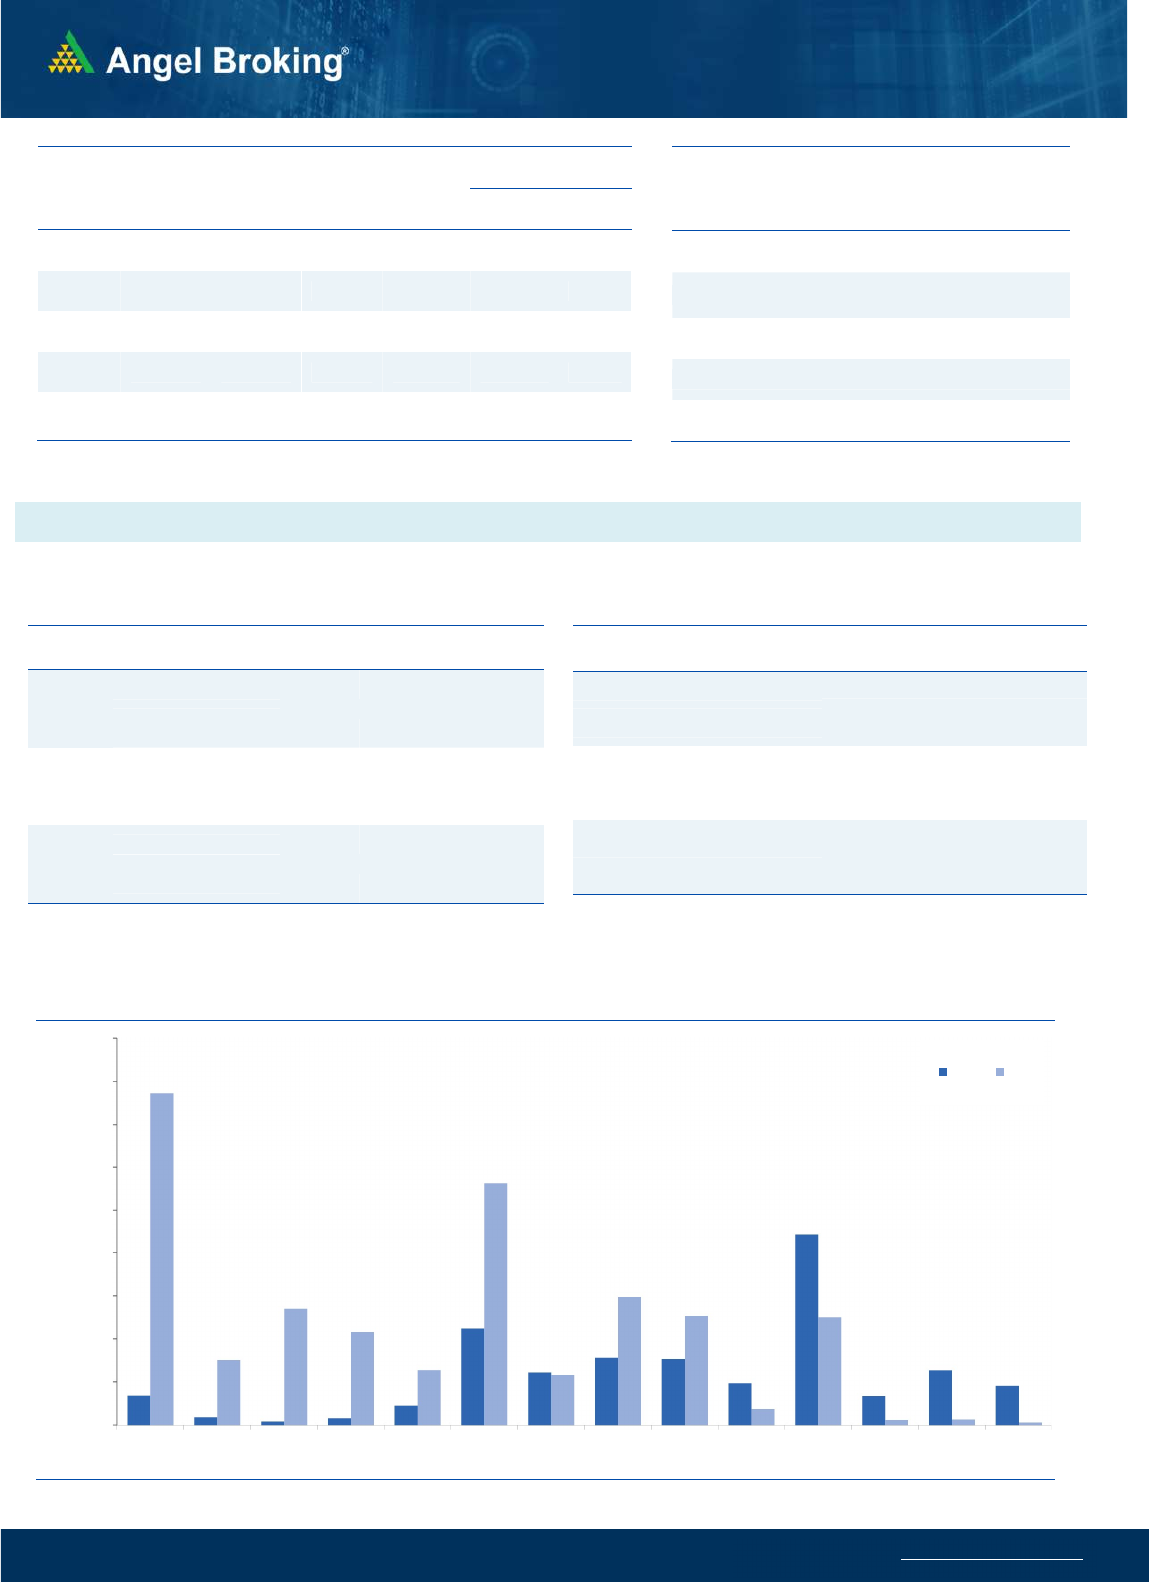
Nifty
Bank Out
look
-
(
32679)
We started off the week with a downside gap due to the weekend
lockdown announced amid COVID surge. Post opening, strong selling
pressure was seen from the word go to drag index below the recent
lows of 32415. As the day progressed, the banking index recovered
slightly and then consolidated for the remaining part of the day to
eventually conclude the day with a massive cut of three and a half
percent.
The BankNifty was the major culprit in yesterday’s free fall as most of
the heavy weight banking names corrected in the range of 3%-6%. As
far as technical chart structure are concerned, we concluded Thursday’s
session near the 89 EMA on hourly chart and things were poised for a
breakout but due to the developments seen in weekend most of the
traders who carried bullish bets found themselves trapped and hence
we saw sharp fall post opening. The BankNifty is now placed around
very crucial levels (around 89EMA in daily chart which recently acted
as demand zone) and follow-up move in today’s session shall dictated
near term directional move. Hence, all eyes especially on banking
index now, traders are advised to remain light on positions until we see
some clarity.
Key Levels
Support 1 – 32300 Resistance 1 – 33000
Support 2 – 32000 Resistance 2 – 33200
Sensex (49159) / Nifty (14638)
We started proceedings for the week on a sluggish note yesterday
morning as indicated by the SGX Nifty. The corrective move extended in
the opening trades to test the 14800 mark. However this correction
eventually turned into a sell off as we saw index literally falling like a pack
of cards at the stroke of the first half an hour. Within a blink off any eye,
we were considerately off highs to enter a sub-14500 territory.
Fortunately, the fall arrested around the mid-session and there after we
had a modest recovery to trim some part of early losses. At the end, Nifty
managed to reclaim 14600 by concluding the session with more than
one and half a percent cut.
Last Thursday when we concluded the truncated week, things were
bright and participation was good across the board. But developments
over the weekend with respect to COVID-19 seems to have dented
traders’/ investors’ sentiment and as a result, we had a sharp selloff in
the first half yesterday. The Dow futures and few Asian bourses were
trading quite firm; but this became like an illusion for our traders as we
kept sinking right from the word go. The major culprit in yesterday’s fall
was undoubtedly the financial space and it’s now placed at a major
support zone, which can now be treated as a ‘Make or Break’ level for
the BANKNIFTY in the near term. So, from here on all eyes would be on
banking index as it can become a deciding factor for the near term trend.
If it manages to hold this, we can see some recovery in the market;
however the way things are positioned, a breakdown in the financial
space can lead to extended correction in the market.
Exhibit 2: Nifty Bank Daily Chart
As far as levels are concerned, we had mentioned how
important it is
for Nifty to surpass 14900 in order to regain strength. Unfortunately,
this didn’t happen and we slid from the sub-14900 levels only.
Yesterday’s late recovery was mainly led by the IT heavyweights but it
cannot single-handedly lift the market higher continuously. Till the time
banking does not participate, the bounce back will not be sustainable in
Nifty and hence, for the coming session, 14680 – 14750 are to be seen
as immediate hurdles. On the flipside, 14550 – 14440 are to be
considered as supports. Traders are advised to stay light and avoid
taking contradictory bets till the time volatility does not subside.
Key Levels
Support 1 – 14550 Resistance 1 – 14680
Support 2 – 14440 Resistance2 – 14750

www.angelbroking.com
Technical & Derivatives Report
April 06, 2021
Nifty Vs OI
13800
14000
14200
14400
14600
14800
15000
15200
15400
,0
20,000
40,000
60,000
80,000
100,000
120,000
140,000
160,000
3/10 3/16 3/18 3/22 3/24 3/26 3/31 4/5
(`000)
Openinterest Nifty
View
Inspite of positive global markets, our indices started
the week with a gap down on the back of rising
worries over increasing cases of Covid-19. Nifty
corrected sharply and sneaked below 14500 mark
before noon. We then saw some recovery to trim
some of the losses and end with a loss of over one and
a half percent
.
FIIs were net sellers in the cash segment to the tune of
Rs. 932 crores. In index futures front, they sold worth
Rs. 1803 crores with increase in open interest
indicating short formations and long unwinding in
yesterday’s session.
In yesterday's session, we saw some unwinding of
positions in both the indices. FII's were net sellers in
the cash segment and they formed shorts in the index
futures segment as well. Their 'Long Short' ratio has
now declined to below 55 percent. In options
segment, call writers were active and added positions
in 14800 and 15000 calls indicating resistance around
these levels. On the flipside, 14500-14400 is the
immediate support zone. Trades are advised to avoid
aggressive positions and focus on stock specific
opportunities
.
C
o
m
me
n
t
s
The Nifty futures open interest has decreased by 0.88%.
Bank Nifty futures open interest has decreased by 3.79%
as market closed at 14637.80 levels.
The Nifty April future closed with a premium of point
60.65 against a premium of 86.00 point in last trading
session. The May series closed at a premium of 109.65
point.
The INDIA VIX increased from 19.98 to 21.21.
At the same time, the PCR-OI of Nifty decreased from
1.16 to 1.07.
Few of the liquid counters where we have seen high cost
of carry are IDEA, UPL, NMDC, GAIL AND SUNTV.
OI Gainers
SCRIP OI
OI
CHG. (%)
PRICE
PRICE
CHG. (%)
LALPATHLAB 255000 32.12 2898.30 5.96
LTI 346800 17.84 4269.40 3.62
MGL 1341000 11.08 1134.55 -4.55
PVR 1755391 10.42 1178.15 -7.39
PFIZER 77875 10.07 4601.60 0.84
MPHASIS 523250 9.75 1755.05 0.16
AARTIIND 507450 9.64 1329.30 -2.61
SHREECEM 147900 9.51 30359.25 1.17
OI Losers
SCRIP OI
OI
CHG. (%)
PRICE
PRICE
CHG. (%)
TVSMOTOR 3393600 -11.57 584.25 -1.33
SRTRANSFIN 3429600 -9.99 1420.15 -3.56
GUJGASLTD 1050000 -8.99 548.60 -0.29
CONCOR 5792478 -8.63 578.60 -3.67
SAIL 132886000 -8.18 89.65 6.40
HINDALCO 31626500 -7.16 350.65 -0.10
RAMCOCEM 1643050 -6.26 1009.90 -1.59
LICHSGFIN 6478000 -5.57 418.45 -3.65
Put-Call Ratio
SCRIP PCR-OI PCR-VOL
NIFTY 1.07 0.95
BANKNIFTY 0.56 0.95
RELIANCE 0.60 0.65
ICICIBANK 0.51 0.40
INFY 0.53 0.27
Historical Volatility
SCRIP HV
UBL 41.06
LALPATHLAB 48.56
APOLLOTYRE 57.50
CANBK 63.36
BAJFINANCE 59.51
www.angelbroking.com
Technical & Derivatives Report
April 06, 2021
Note: Above mentioned Bullish or Bearish Spreads in Nifty (April Series) are given as an information and not as a recommendation.
Nifty Spot =
14637.80
FII Statistics for April 05, 2021
Detail Buy
Net Contracts
Open Interest
Sell
Value
(in Cr.)
Change
INDEX
FUTURES
5983.07
7785.83
(1802.76) 121144
12510.49
3.37
INDEX
OPTIONS
365978.57
366257.31
(278.74) 803447
82082.00
27.43
STOCK
FUTURES
12895.21
15186.35
(2291.14) 1081986
92387.21
0.88
STOCK
OPTIONS
13035.81
13046.04
(10.23) 127381
11064.68
9.29
Total 397892.66
402275.53
(4382.87) 2133958
198044.38
10.18
Turnover on April 05, 2021
Instrum
ent
No. of
Contracts
Turnover
( in Cr. )
Change
(%)
Index Futures
4,72,920 45035.35 18.55
Index Options
2,82,18,437 27,16,310.93 -61.96
Stock Futures
7,29,581 69366.28 16.09
Stock Options
14,21,180 0.00 33.30
Total 3,08,42,118 29,68,146.83 -59.57
Bull-Call Spreads
Action Strike Price Risk Reward BEP
Buy 14600 370.05
58.20 41.80 14658.20
Sell 14700 311.85
Buy 14600 370.05
109.20 90.80 14709.20
Sell 14800 260.85
Buy 14700 311.85
51.00 49.00 14751.00
Sell 14800 260.85
Bear-Put Spreads
Action Strike Price Risk Reward BEP
Buy 14600 271.15
36.75 63.25 14563.25
Sell 14500 234.40
Buy 14600 271.15
71.80 128.20 14528.20
Sell 14400 199.35
Buy 14500 234.40
35.05 64.95 14464.95
Sell 14400 199.35
Nifty Put-Call Analysis
,0
500,000
1000,000
1500,000
2000,000
2500,000
3000,000
3500,000
4000,000
4500,000
14000 14100 14200 14300 14400 14500 14600 14700 14800 14900 15000 15100 15200 15300
Call Put

www.angelbroking.com
Technical & Derivatives Report
April 06, 2021
Da
ily
Pivot Level
s for
Nifty Constituents
Scrips
S2
S1
PIVOT
R1
R2
ADANIPORTS
704
723
734
753
764
ASIANPAINT 2,444 2,477
2,518
2,551
2,591
AXISBANK
659
672
690
703
721
BAJAJ-AUTO 3,474 3,536
3,638
3,700
3,802
BAJFINANCE 4,709 4,836
5,047
5,174
5,386
BAJAJFINSV 8,851 9,166
9,465
9,780
10,079
BPCL
413
420
429
436
445
BHARTIARTL
510
519
524
533
538
BRITANNIA 3,593 3,647
3,683
3,737
3,773
CIPLA
797
808
818
829
839
COALINDIA
126
128
130
132
134
DIVISLAB 3,499 3,555
3,618
3,674
3,737
DRREDDY 4,361 4,459
4,522
4,619
4,682
EICHERMOT 2,446 2,482
2,542
2,578
2,638
GRASIM 1,401 1,424
1,448
1,471
1,496
HCLTECH
988
1,011
1,025
1,048
1,063
HDFCBANK 1,401 1,425
1,455
1,479
1,509
HDFCLIFE
664
673
685
695
707
HDFC 2,345 2,396
2,463
2,514
2,581
HEROMOTOCO 2,802 2,845
2,909
2,951
3,015
HINDALCO
332
341
347
356
362
HINDUNILVR 2,308 2,341
2,379
2,411
2,450
ICICIBANK
547
559
576
588
604
IOC
88
90
91
92
94
INDUSINDBK
878
908
948
978
1,019
INFY 1,369 1,390
1,407
1,428
1,445
ITC
205
209
214
218
224
JSW STEEL
495
506
514
525
533
KOTAKBANK 1,699 1,729
1,764
1,794
1,830
LT 1,350 1,377
1,408
1,435
1,466
M&M
745
760
784
799
824
MARUTI 6,617 6,693
6,801
6,877
6,984
NESTLEIND 16,492
16,686
16,918
17,112
17,344
NTPC
102
104
106
108
110
ONGC
97
100
102
106
108
POWERGRID
210
212
216
218
221
RELIANCE 1,930 1,961
1,993
2,024
2,056
SBILIFE
853
863
875
885
897
SHREECEM 29,234
29,796
30,212
30,774
31,191
SBIN
337
345
357
365
377
SUNPHARMA
585
597
605
616
624
TCS 3,106 3,172
3,218
3,284
3,330
TATACONSUM
633
639
645
652
658
TATAMOTORS
290
298
305
312
319
TATASTEEL
820
844
861
885
902
TECHM
965
982
994
1,011
1,023
TITAN 1,472 1,504
1,531
1,563
1,590
ULTRACEMCO 6,583 6,689
6,842
6,948
7,101
UPL
614
630
648
663
681
WIPRO
411
418
423
430
435

www.angelbroking.com
Technical & Derivatives Report
April 06, 2021
*
Research Team Tel: 022 – 39357600 (Extn. 6844) Website: www.angelbroking.com
For Derivatives Queries E-mail: derivatives.desk@angelbroking.com
DISCLAIMER
Angel Broking Limited (hereinafter referred to as “Angel”) is a registered Member of National Stock Exchange of India Limited, Bombay
Stock Exchange Limited and Metropolitan Stock Exchange Limited. It is also registered as a Depository Participant with CDSL and
Portfolio Manager and Investment Adviser with SEBI. It also has registration with AMFI as a Mutual Fund Distributor. Angel Broking
Limited is a registered entity with SEBI for Research Analyst in terms of SEBI (Research Analyst) Regulations, 2014 vide registration
number INH000000164. Angel or its associates has not been debarred/ suspended by SEBI or any other regulatory authority for
accessing /dealing in securities Market. Angel or its associates/analyst has not received any compensation / managed or co-managed
public offering of securities of the company covered by Analyst during the past twelve months.
This document is solely for the personal information of the recipient, and must not be singularly used as the basis of any investment
decision. Nothing in this document should be construed as investment or financial advice. Each recipient of this document should make
such investigations as they deem necessary to arrive at an independent evaluation of an investment in the securities of the companies
referred to in this document (including the merits and risks involved), and should consult their own advisors to determine the merits
and risks of such an investment.
Reports based on technical and derivative analysis center on studying charts of a stock's price movement, outstanding positions and
trading volume, as opposed to focusing on a company's fundamentals and, as such, may not match with a report on a company's
fundamentals. Investors are advised to refer the Fundamental and Technical Research Reports available on our website to evaluate the
contrary view, if any.
The information in this document has been printed on the basis of publicly available information, internal data and other reliable
sources believed to be true, but we do not represent that it is accurate or complete and it should not be relied on as such, as this
document is for general guidance only. Angel Broking Limited or any of its affiliates/ group companies shall not be in any way
responsible for any loss or damage that may arise to any person from any inadvertent error in the information contained in this report.
Angel Broking Limited has not independently verified all the information contained within this document. Accordingly, we cannot
testify, nor make any representation or warranty, express or implied, to the accuracy, contents or data contained within this document.
While Angel Broking Limited endeavors to update on a reasonable basis the information discussed in this material, there may be
regulatory, compliance, or other reasons that prevent us from doing so.
This document is being supplied to you solely for your information, and its contents, information or data may not be reproduced,
redistributed or passed on, directly or indirectly.
Technical and Derivatives Team:
Sameet Chavan Chief Analyst - Technical & Derivatives sameet.chavan@angelbroking.com
Ruchit Jain Senior Analyst - Technical & Derivatives ruchit.jain@angelbroking.com
Rajesh Bhosale Technical Analyst rajesh.bhosle@angelbroking.com
Sneha Seth Derivatives Analyst sneha.seth@angelbroking.com
