www.
angelbroking.com
Technical & Derivatives Report
August 05, 2020
Nifty
Bank Out
look
-
(
21491
)
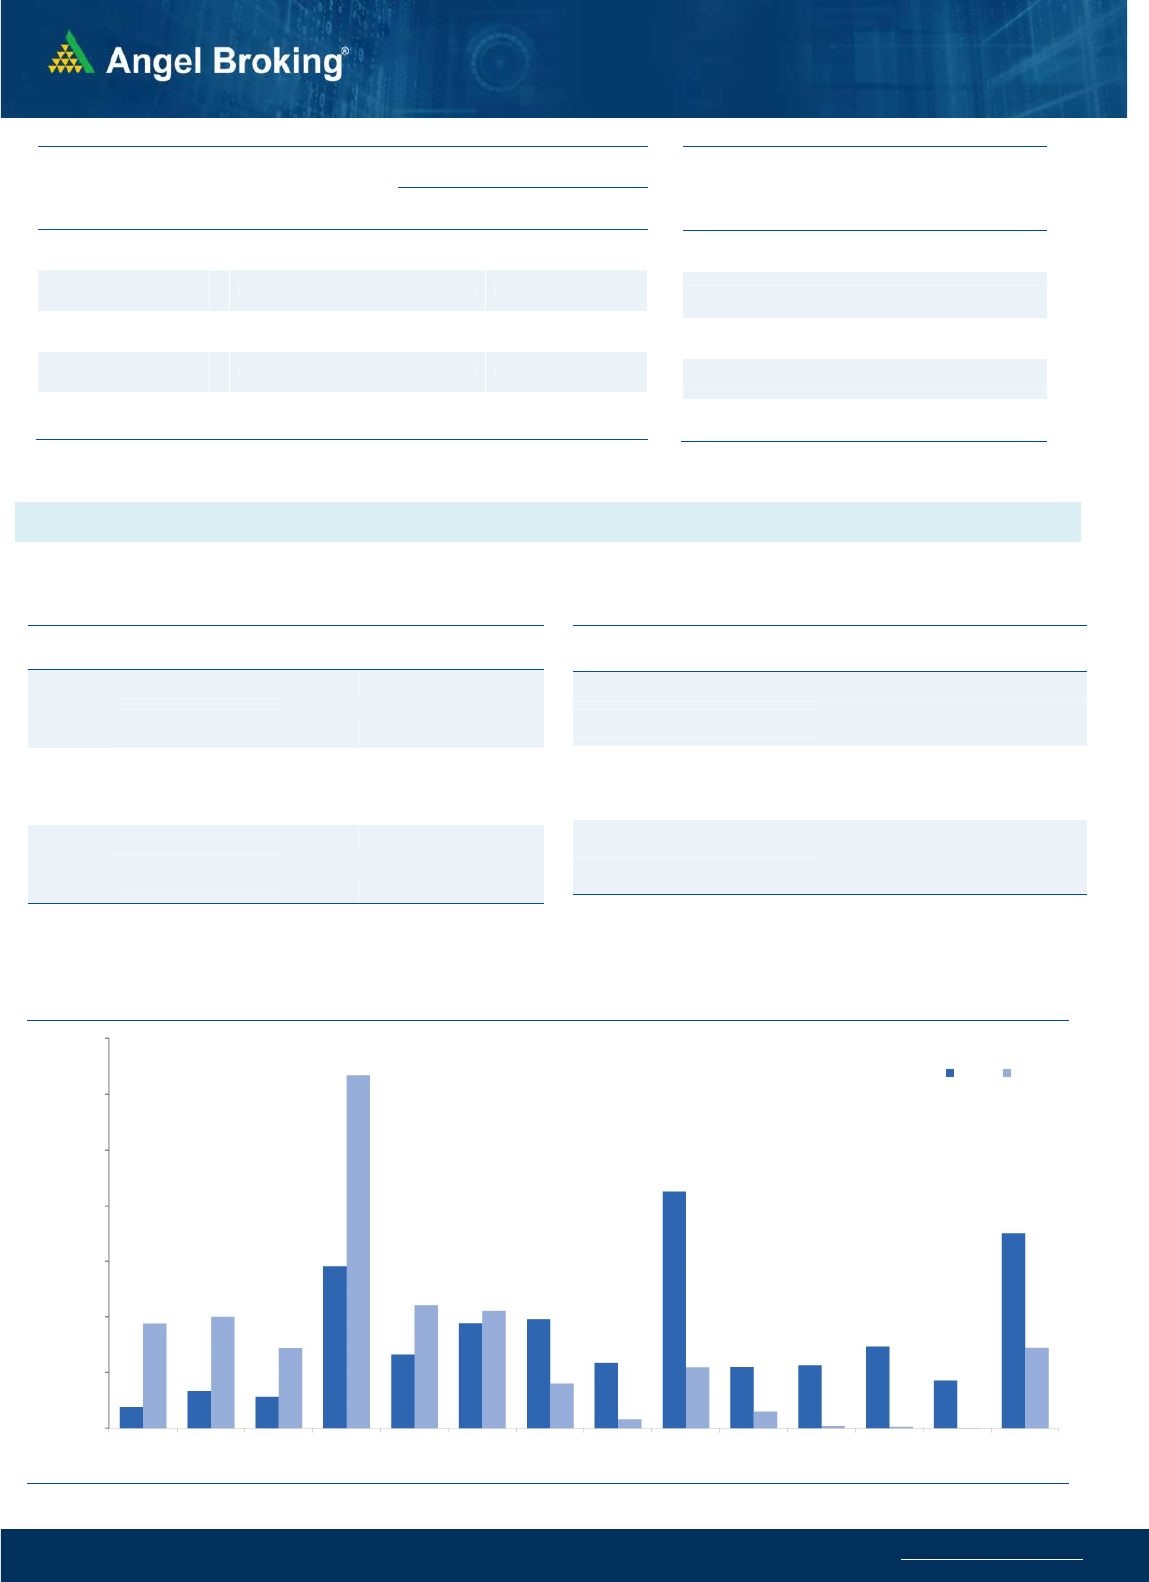
Markets can be very unpredictable at times and the price action in
the last couple of sessions completely justifies this statement. The
banking has been dragging continuously for the past few days and
with Monday's fall, the Bank Nifty reached its crucial swing low of
21027. Yesterday in the initial trades, this crucial support was
challenged once again; but from nowhere, the strong buying
emerged at lower levels in few heavyweight banking names, which
pulled the index higher. In fact, it did not stop there, the lead got
extended in the following hours to conclude comfortably at
elevated levels. If we take a glance at intraday charts, yesterday's
move appears to be completely opposite of Monday's fall and it is
always good to see the market rising. As we had stated yesterday
also, if any recovery has to happen it should happen from this
important point only and markets managed to recover. Going
ahead, 21027 remains a major support and till the time it is
defended, there is no reason to worry for. For the coming session,
a move beyond 21576 would extend the relief move towards
21750 - 22000 levels; whereas on the downside, the immediate
intraday support lies at 21300 - 21200.
Key Levels
Support 1 – 21300 Resistance 1 – 21750
Support 2 – 21200 Resistance 2 – 22000
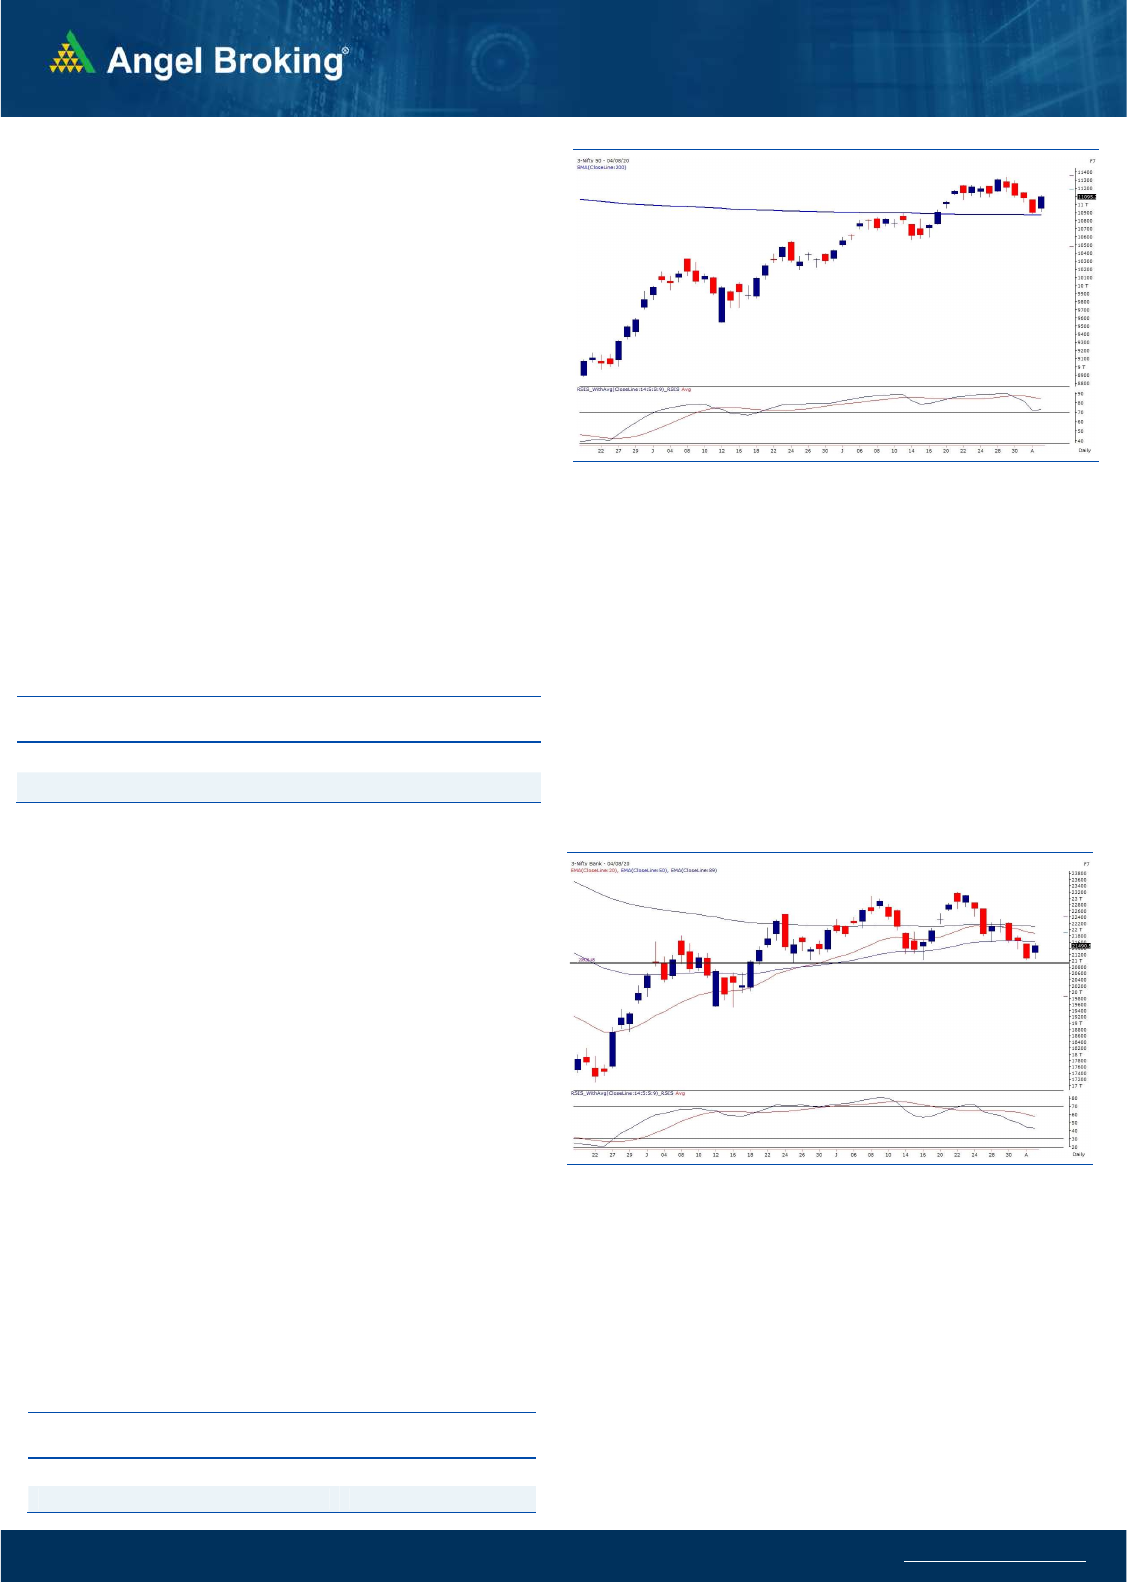
Exhibit 1: Nifty Daily Chart
Sensex (37688) / Nifty (11095)
The index started yesterday’s session marginally positive in line with
the global cues. However, the initial dip in first 15 minutes of trade
was bought into and the index then rallied higher throughout the
day to end with gains over 200 points.
Nifty had ended Monday’s session in the vicinity of its support zone
of 10870-10900, which was the previous breakout level as well as
the ‘200 SMA’ on the daily chart. This support zone played it role
well and the index resumed the momentum yesterday led by the
index heavyweights such as Reliance Ind. and HDFC Bank. Apart
from the index heavyweight RIL, the private banking space too
participated as the Bank Nifty defended its swing low of 21027. With
this pullback, the index continues the ‘Higher Top Higher Bottom’
structure and forms a higher low i.e. a higher support base at 10880.
Thus, the near term continues to be positive now till 10880 remains
intact. Hence, traders are advised to trade with a positive bias and
look for buying opportunities in intraday declines. On the flipside,
11250-11300 would be immediate target zone to watch out for.
Key Levels
Support 1 – 11000 Resistance 1 – 11250
Support 2 – 10900 Resistance 2 – 11300
Exhibit 2: Nifty Bank Daily Chart
Yesterday we mentioned about the positive market breadth in falling
market with midcaps showing a relative outperformance. The
midcap space continued its momentum and now the banking and
financial stocks too could participate to cover up for their recent
underperformance. Thus, we continue with our advice to look for
such stock specific opportunities which could provide good returns
in the near term.

www.angelbroking.com
Technical & Derivatives Report
August 05, 2020
Nifty Vs OI
10600
10700
10800
10900
11000
11100
11200
11300
11400
,0
2,000
4,000
6,000
8,000
10,000
12,000
14,000
16,000
7/20 7/21 7/22 7/23 7/24 7/27 7/28 7/29 7/30 7/31 8/3 8/4
(`000)
Openinterest Nifty
View
s
The indices opened on a positive note in yesterday's
session. Post some hiccups in the initial few minutes, the
index rallied higher throughout the session and ended
around the 11100 mark.
FIIs were net buyers in the cash market segment to the
tune of Rs. 704 crores. In index futures, they bought
worth 1228 crores with decrease in open interest
indicating short covering in yesterday’s upmove
.
Yesterday's move in the index and the data was
completely opposite to the previous day. While there
was short formation in Bank Nifty on Monday, we
witnessed long formation in Nifty and short covering in
Bank Nifty yesterday. FII's unwinded long positions and
formed short positions in Monday's session in index
futures segment, but they covered their short positions
yesterday. Due to such contradictory data in last two
day's, we saw a sharp correction in Nifty on Monday and
a recovery yesterday. In the options segment, 11000
and 10900 put options added a good amount of open
interest build up indicating a strong support at these
levels. Hence, traders are advised to trade with a
positive bias from a near term perspective.
C
o
mme
n
t
s
The Nifty futures open interest has increased by 4.86%
Bank Nifty futures open interest has decreased by 9.88%
as market closed at 11095.25 levels.
The Nifty August future closed with a premium of 6.8
point against a premium of 21.8 point in last trading
session. The September series closed at a premium of
11.85 point.
The INDIA VIX has decreased from 25.18 to 23.81
At the same time, the PCR-OI of Nifty increased from 1.10
to 1.42.
Few of the liquid counters where we have seen high cost
of carry are BANKBARODA, GODREJPROP, PNB ,
NATIONALUM, AND ASHOKLEY.
OI Gainers
SCRIP OI
OI
CHG. (%)
PRICE
PRICE
CHG. (%)
APOLLOTYRE 15090000 32.72 115.15 6.53
BANDHANBNK 31325400 26.02 306.90 -1.74
MRF 27010 21.67 61269.30 0.56
EXIDEIND 12452400 17.29 155.65 0.94
MFSL 1933100 15.99 538.65 -0.71
VOLTAS 2831000 13.38 610.80 2.57
IDEA 323540000 11.16 8.65 -1.14
TATAPOWER 57105000 10.73 49.70 2.04
OI Losers
SCRIP OI
OI
CHG. (%)
PRICE
PRICE
CHG. (%)
BPCL 18925200 -11.00 408.55 -2.20
COLPAL 2870000 -7.22 1439.65 1.60
MINDTREE 1160800 -5.78 1125.90 -0.14
BALKRISIND 2593600 -5.40 1324.25 1.07
TORNTPHARM 1880000 -5.29 2828.70 3.43
UPL 14848600 -4.86 461.70 1.96
AMARAJABAT 1328000 -4.80 711.75 0.25
INDIGO 2580500 -4.71 984.00 3.10
Put-Call Ratio
SCRIP PCR-OI PCR-VOL
NIFTY 1.42 0.84
BANKNIFTY 0.80 0.84
RELIANCE 0.75 0.39
ICICIBANK 0.49 0.43
INFY 0.78 0.65
Historical Volatility
SCRIP HV
RELIANCE 53.68
APOLLOTYRE 52.05
ADANIENT 61.33
HDFCBANK 43.71
APOLLOHOSP 57.04
www.angelbroking.com
Technical & Derivatives Report
August 05, 2020
Note: Above mentioned Bullish or Bearish Spreads in Nifty (August Series) are given as an information and not as a recommendation.
Nifty Spot =
11095.25
FII Statistics for August 04, 2020
Detail Buy
Sell Net
Open Interest
Contracts
Value
(in Cr.)
Change
(%)
INDEX
FUTURES
4621.89
3393.50
1228.39
104006
7904.91
(11.67)
INDEX
OPTIONS
177516.97
176672.43
844.54
630775
48545.07
1.18
STOCK
FUTURES
14556.12
14050.76
505.36
1256581
86640.02
0.65
STOCK
OPTIONS
6153.47
6141.57
11.90
57994
3877.70
5.71
Total 202848.45
200258.26
2590.19
2049356
146967.70
0.24
Turnover on August 04, 2020
Instrument
No. of
Contracts
Turnover
( in Cr. )
Change
(%)
Index Futures 4,92,897 32178.56 10.85
Index Options 1,87,98,648
12,71,317.83 37.11
Stock Futures 8,38,257 60266.71 7.16
Stock Options 10,22,025 82868.94 20.75
Total 2,11,51,827
14,46,632.04 33.81
Bull-Call Spreads
Action Strike Price Risk Reward BEP
Buy 11100 239.45
49.90 50.10 11149.90
Sell 11200 189.55
Buy 11100 239.45
92.20 107.80 11192.20
Sell 11300 147.25
Buy 11200 189.55
42.30 57.70 11242.30
Sell 11300 147.25
Bear-Put Spreads
Action Strike Price Risk Reward BEP
Buy 11100 236.80
42.10 57.90 11057.90
Sell 11000 194.70
Buy 11100 236.80
78.70 121.30 11021.30
Sell 10900 158.10
Buy 11000 194.70
36.60 63.40 10963.40
Sell 10900 158.10
Nifty Put-Call Analysis
,0
500,000
1000,000
1500,000
2000,000
2500,000
3000,000
3500,000
10700 10800 10900 11000 11100 11200 11300 11400 11500 11600 11700 11800 11900 12000
Call Put

www.angelbroking.com
Technical & Derivatives Report
August 05, 2020
Daily Pivot Levels for Nifty Constituents
Scrips
S2
S1
PIVOT
R1
R2
ADANIPORTS
308
31
2
315
318
321
ASIANPAINT 1,693 1,703
1,719
1,730
1,746
AXISBANK
412
421
426
434
440
BAJAJ-AUTO 2,887 2,928
2,964
3,005
3,041
BAJFINANCE 3,096 3,166
3,213
3,283
3,330
BAJAJFINSV 5,998 6,080
6,154
6,236
6,310
BPCL
376
392
408
424
440
BHARTIARTL
542
545
549
553
557
INFRATEL
188
190
191
193
195
BRITANNIA 3,749 3,783
3,819
3,853
3,889
CIPLA
696
705
712
721
728
COALINDIA
126
128
130
131
133
DRREDDY 4,429 4,532
4,593
4,696
4,757
EICHERMOT 20,555
20,785
21,030
21,260
21,505
GAIL
92
92
94
94
95
GRASIM
611
618
629
636
646
HCLTECH
673
683
697
707
721
HDFCBANK
977
1,009
1,035
1,067
1,093
HDFC
595
605
610
620
625
HEROMOTOCO
1,722
1,752
1,773
1,803
1,824
HINDALCO 2,600 2,653
2,693
2,746
2,786
HINDUNILVR
159
161
163
164
166
ICICIBANK 2,153 2,176
2,197
2,219
2,241
IOC
340
346
349
355
358
INDUSINDBK
85
86
87
88
88
INFY
470
481
495
506
519
ITC
924
937
954
967
984
JSW STEEL
191
192
194
195
197
KOTAKBANK
215
222
226
232
236
LT 1,290 1,307
1,319
1,336
1,348
M&M
910
917
924
931
937
MARUTI
591
597
603
609
616
NESTLEIND 6,115 6,237
6,307
6,429
6,499
NTPC 16,313
16,446
16,547
16,681
16,782
ONGC
84
85
86
87
88
POWERGRID
75
75
77
77
78
RELIANCE
174
176
178
180
181
SHREECEM 1,939 2,045
2,106
2,212
2,273
SBIN 21,005
21,299
21,620
21,915
22,235
SUNPHARMA
189
190
192
193
195
TCS
511
520
526
535
541
TATAMOTORS 2,204 2,227
2,248
2,271
2,293
TATASTEEL
108
110
112
114
117
TECHM
362
367
373
378
383
TITAN
633
643
660
669
686
ULTRACEMCO 1,053 1,064
1,077
1,088
1,101
UPL 3,931 3,968
4,021
4,057
4,111
VEDANTA
450
456
460
466
470
WIPRO
276
278
281
284
286
ZEEL
132
138
141
147
151

www.angelbroking.com
Technical & Derivatives Report
August 05, 2020
*
Research Team Tel: 022 – 39357600 (Extn. 6844) Website: www.angelbroking.com
For Technical & Derivatives Queries E-mail: technicalresearch-cso@angelbroking.com
DISCLAIMER
Angel Broking Limited (hereinafter referred to as “Angel”) is a registered Member of National Stock Exchange of India Limited, Bombay
Stock Exchange Limited and Metropolitan Stock Exchange Limited. It is also registered as a Depository Participant with CDSL and
Portfolio Manager and Investment Adviser with SEBI. It also has registration with AMFI as a Mutual Fund Distributor. Angel Broking
Limited is a registered entity with SEBI for Research Analyst in terms of SEBI (Research Analyst) Regulations, 2014 vide registration
number INH000000164. Angel or its associates has not been debarred/ suspended by SEBI or any other regulatory authority for
accessing /dealing in securities Market. Angel or its associates/analyst has not received any compensation / managed or co-managed
public offering of securities of the company covered by Analyst during the past twelve months.
This document is solely for the personal information of the recipient, and must not be singularly used as the basis of any investment
decision. Nothing in this document should be construed as investment or financial advice. Each recipient of this document should make
such investigations as they deem necessary to arrive at an independent evaluation of an investment in the securities of the companies
referred to in this document (including the merits and risks involved), and should consult their own advisors to determine the merits
and risks of such an investment.
Reports based on technical and derivative analysis center on studying charts of a stock's price movement, outstanding positions and
trading volume, as opposed to focusing on a company's fundamentals and, as such, may not match with a report on a company's
fundamentals. Investors are advised to refer the Fundamental and Technical Research Reports available on our website to evaluate the
contrary view, if any.
The information in this document has been printed on the basis of publicly available information, internal data and other reliable
sources believed to be true, but we do not represent that it is accurate or complete and it should not be relied on as such, as this
document is for general guidance only. Angel Broking Limited or any of its affiliates/ group companies shall not be in any way
responsible for any loss or damage that may arise to any person from any inadvertent error in the information contained in this report.
Angel Broking Limited has not independently verified all the information contained within this document. Accordingly, we cannot
testify, nor make any representation or warranty, express or implied, to the accuracy, contents or data contained within this document.
While Angel Broking Limited endeavors to update on a reasonable basis the information discussed in this material, there may be
regulatory, compliance, or other reasons that prevent us from doing so.
This document is being supplied to you solely for your information, and its contents, information or data may not be reproduced,
redistributed or passed on, directly or indirectly.
Technical and Derivatives Team:
Sameet Chavan Chief Analyst - Technical & Derivatives sameet.chavan@angelbroking.com
Ruchit Jain Senior Analyst - Technical & Derivatives ruchit.jain@angelbroking.com
Rajesh Bhosale Technical Analyst rajesh.bhosle@angelbroking.com
Sneha Seth Derivatives Analyst sneha.seth@angelbroking.com
