www.angelbroking.com
Technical & Derivatives Report
September 04, 2020
Nifty
Bank Out
look
-
(
23531
)
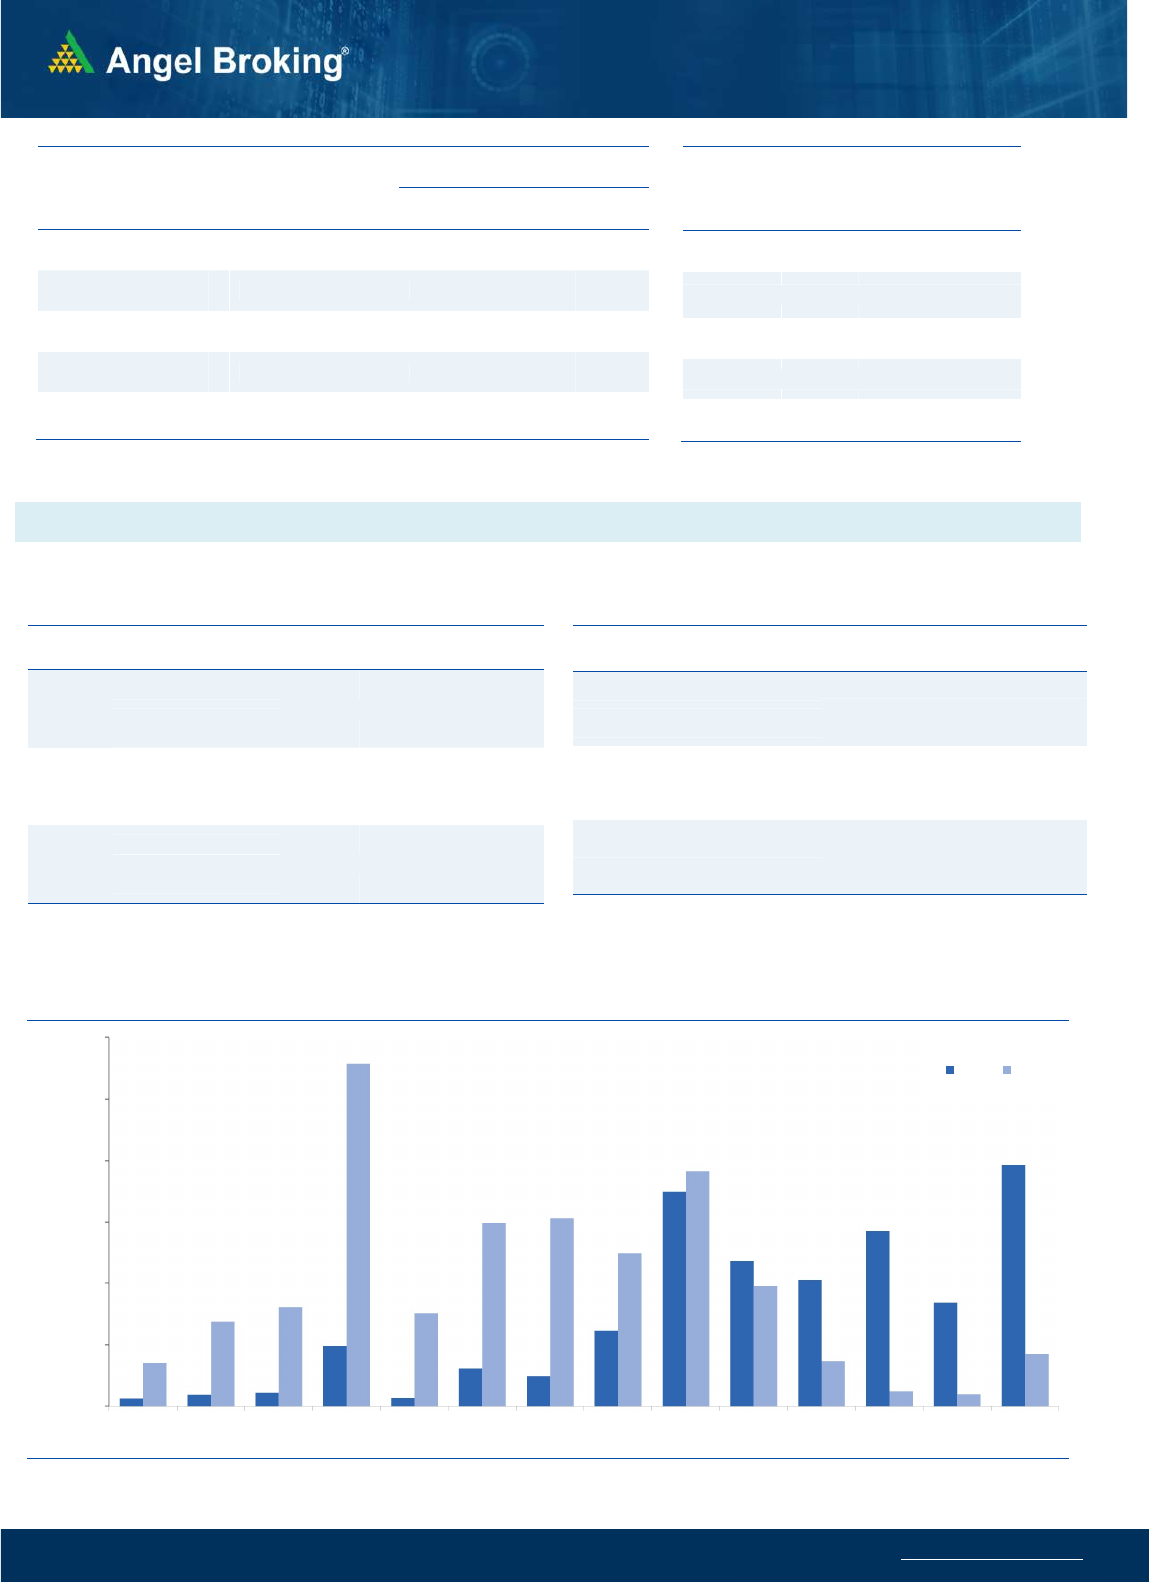
After a flat start, the bank index witnessed a gradually decline
throughout the session to end with loss of 1.44% at 23531.
Technically, not much has changed as the bank index continues to
consolidate around the lower end of Monday's bearish candle. For
the last four sessions, prices have managed to hold the levels
around 23400 and this has now become a sacrosanct point. On
the last session of the week, if prices break below 23400 and
sustains then we may see further weakness towards 23000 and
lower. On the flip side, 24000 and 24200 levels are acting as sturdy
wall. Traders are advised to keep a tab on the above levels and
have a stock specific approach.
.
Key Levels
Support 1 – 23400 Resistance 1 – 24000
Support 2 – 23000 Resistance 2 – 24200
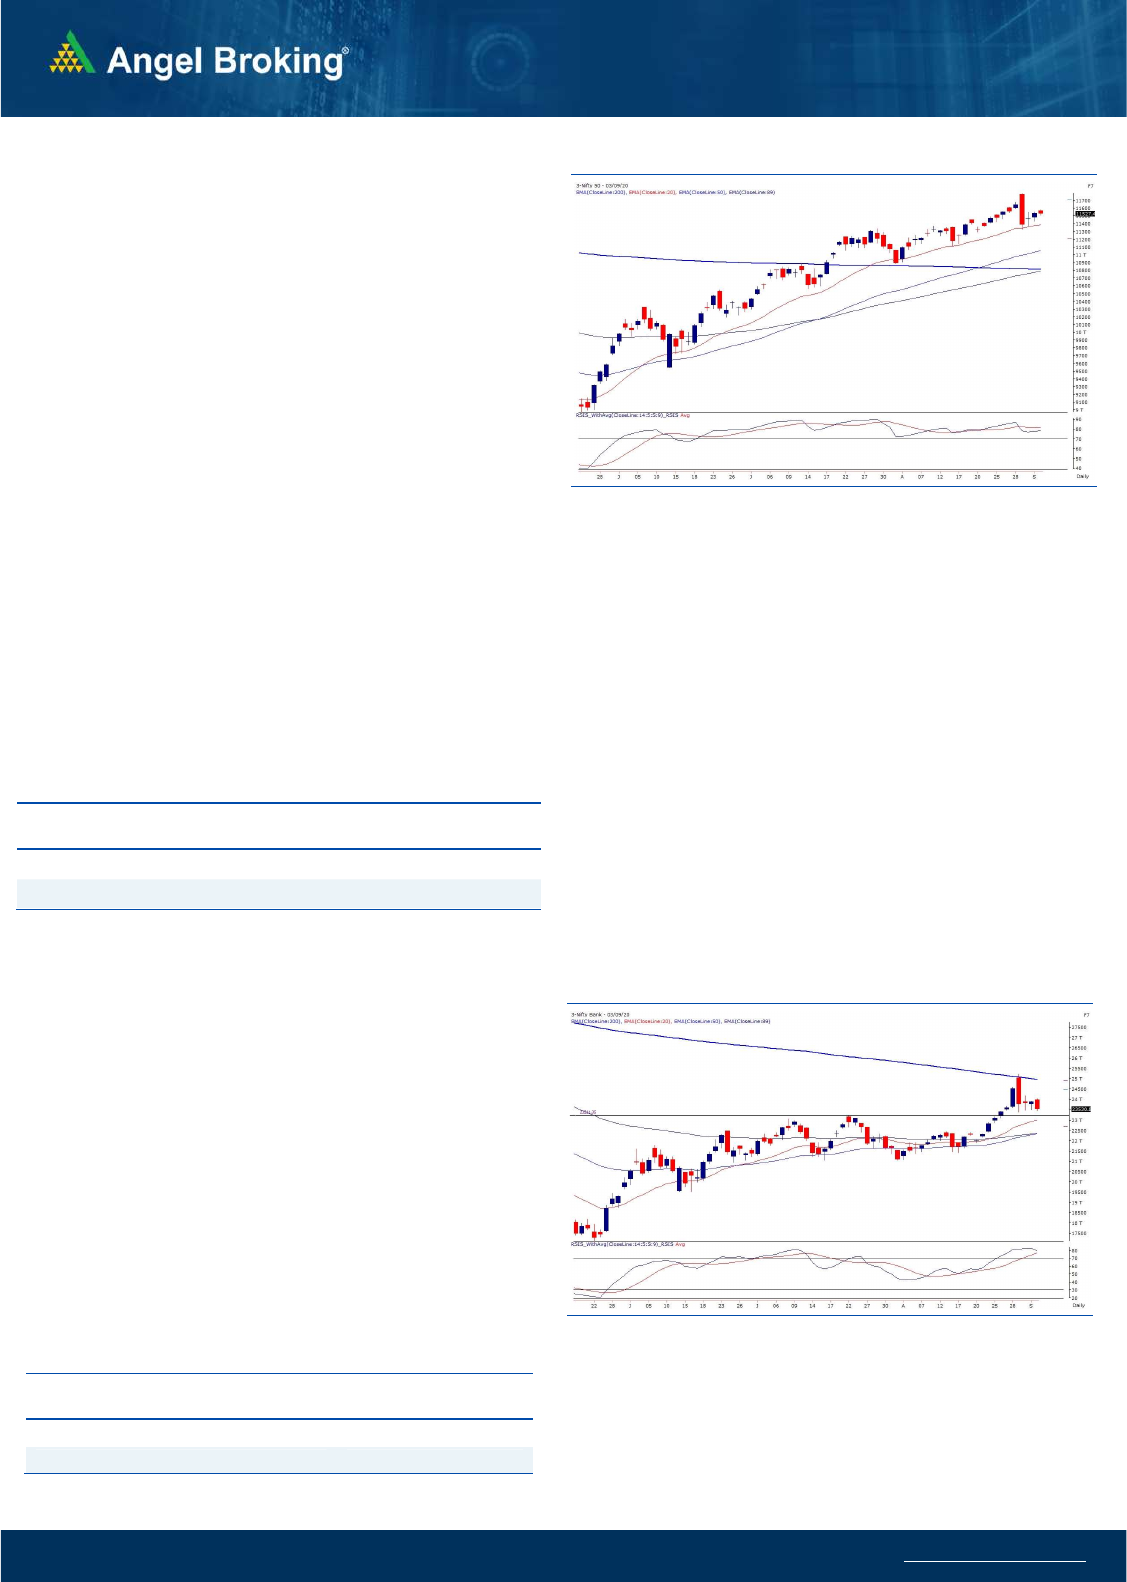
Exhibit 1: Nifty Daily Chart
Se
nsex
(
38991)
/ Nifty
(
11527
)
Yesterday, our markets opened on a flat to positive note despite US
markets registering handsome gains overnight. The benchmark
index then slipped into a consolidation mode and just remained
unmoved throughout the remaining part of the day. In between,
small swings on both sides were witnessed, but they were not at all
impactful as the overall intraday range for the day shrunk to merely
50-60 points.
Clearly, markets have become watchful after a solid knock on
Monday. Practically speaking, lot of uncertainties like, India-China
tension at the border, Supreme Court’s verdict with respect to
Interest waiver during the moratorium period and the introduction
of stringent margin systems are looming over. Till the time, market
do not get clarity on this front, the range bound movement is quite
evident. Technically speaking, a sharp sell off followed by such
uninterested trading sessions, generally does not bode well for the
bulls. Hence, next couple of sessions would be crucial for markets to
understand the next path of action. As far as levels are concerned,
11600-11650 remains to be a stiff hurdle; whereas on the lower
side, 11500-11400-11325 would be seen as cluster of supports. Let
see how things pan out and which way market decides to move.
.Key Levels
Support 1 – 11450 Resistance 1 – 11600
Support 2 – 11400 Resistance 2 – 11650
Exhibit 2: Nifty Bank Daily Chart
Sectorally, banking space was the major culprit yesterday as it
started sulking right from the word go. On the other hand, IT
provided the helping hand yesterday and did not allow bears to
dominate. So it was clearly a day of some tug of war between the
market participants. Apart from this, midcap stocks had a great
session and it provided very good opportunities yesterday. Going
ahead, one can look to follow such stock specific moves but do not
hold positions for higher returns, rather look to book timely profits.

www.angelbroking.com
Technical & Derivatives Report
September 04, 2020
Nifty Vs OI
11100
11200
11300
11400
11500
11600
11700
,0
2,000
4,000
6,000
8,000
10,000
12,000
14,000
16,000
8/20 8/21 8/24 8/25 8/26 8/27 8/28 8/31 9/1 9/2 9/3
(`000)
Openinterest Nifty
View
s
On the weekly expiry day, Nifty started on a flat note
and traded within a slender range throughout the
session to eventually end with maringal loss 11527.50.
FIIs were net buyers in the cash market segment to the
tune of Rs. 8 crores. In index futures, they sold worth
772 crores with decrease in open interest indicating
long unwinding in yesterday’s session
.
Nifty traded within a range on the weekly expiry day and
ended marginaly negative. However, the banking index
remained under pressure and underperformed due to
formation of short positions. FII's net activity was muted
in the cash segment while they unwound some of their
longs in index futures. The options segment indicate
resistance around 11600 while support is placed
around 11400. Being the start of new weekly series,
traders are advised to watch for developments in the
first hour of the session and trade accordingly.
C
o
mme
n
t
s
The Nifty futures open interest has increased by 1.77%
Bank Nifty futures open interest has increased by 6.58%
as market closed at 11527.45 levels.
The Nifty September future closed with a premium of
15.35 point against a premium of 26.5 point in last trading
session. The October series closed at a premium of 30.8
point.
The INDIA VIX has decreased from 21.10 to 20.50.
At the same time, the PCR-OI of Nifty decreased from
1.36 to 1.33.
Few of the liquid counters where we have seen high cost
of carry are IDEA, BHEL, COALINDIA, GMRINFRA, AND
MINDTREE.
OI Gainers
SCRIP OI
OI
CHG. (%)
PRICE
PRICE
CHG. (%)
PAGEIND 168420 35.18 19162.70 -2.98
IDEA 502040000 34.91 12.55 27.14
MINDTREE 1824000 30.96 1205.85 1.30
BATAINDIA 2044350 17.29 1374.40 3.12
TATACONSUM 12096000 14.58 578.50 5.13
POWERGRID 10840000 13.91 178.50 -1.35
BHEL 68754000 11.82 40.00 2.41
MUTHOOTFIN 3258750 11.50 1135.40 -1.17
OI Losers
SCRIP OI
OI
CHG. (%)
PRICE
PRICE
CHG. (%)
ESCORTS 2960100 -16.06 1224.60 0.02
APOLLOTYRE 12935000 -6.57 123.70 0.57
INFRATEL 14201600 -5.30 218.50 11.37
TORNTPHARM 1389000 -5.09 2797.45 1.27
MGL 2059800 -4.53 926.25 1.36
PNB 59388000 -3.85 34.50 -1.28
MCDOWELL-N 15130000 -3.60 580.20 1.59
EICHERMOT 2391550 -3.54 2231.05 2.52
Put-Call Ratio
SCRIP PCR-OI PCR-VOL
NIFTY 1.33 1.03
BANKNIFTY 0.70 0.87
RELIANCE 0.59 0.44
ICICIBANK 0.47 0.52
INFY 0.52 0.32
Historical Volatility
SCRIP HV
IDEA 143.16
INFRATEL 74.04
UBL 45.10
GRASIM 53.44
TITAN 50.13
www.angelbroking.com
Technical & Derivatives Report
September 04, 2020
Note: Above mentioned Bullish or Bearish Spreads in Nifty (September Series) are given as an information and not as a recommendation.
Nifty Spot =
11527.45
FII Statistics for September 03, 2020
Detail Buy
Sell Net
Open Interest
Contracts
Value
(in Cr.)
Change
(%)
INDEX
FUTURES
3634.25
4405.78
(771.53) 126061
10300.36
(3.91)
INDEX
OPTIONS
364913.04
362338.38
2574.66
627080
50411.57
(18.51)
STOCK
FUTURES
12442.65
13618.45
(1175.80) 1219414
88023.48
0.42
STOCK
OPTIONS
4133.30
4186.10
(52.80) 79128
5648.93
5.95
Total 385123.24
384548.71
574.53
2051683
154384.34
(6.30)
Turnover on September 03, 2020
Instrument
No. of
Contracts
Turnover
( in Cr. )
Change
(%)
Index Futures 3,52,280 24354.94 -17.10
Index Options
5,05,93,196
34,33,620.61
85.51
Stock Futures 6,94,162 53523.54 -5.02
Stock Options
9,11,486 74772.06 0.06
Total 5,25,51,124
35,86,271.15
78.30
Bull-Call Spreads
Action Strike Price Risk Reward BEP
Buy 11500 227.70
55.20 44.80 11555.20
Sell 11600 172.50
Buy 11500 227.70
100.95 99.05 11600.95
Sell 11700 126.75
Buy 11600 172.50
45.75 54.25 11645.75
Sell 11700 126.75
Bear-Put Spreads
Action Strike Price Risk Reward BEP
Buy 11500 185.15
36.10 63.90 11463.90
Sell 11400 149.05
Buy 11500 185.15
65.80 134.20 11434.20
Sell 11300 119.35
Buy 11400 149.05
29.70 70.30 11370.30
Sell 11300 119.35
Nifty Put-Call Analysis
,0
500,000
1000,000
1500,000
2000,000
2500,000
3000,000
10700 10800 10900 11000 11100 11200 11300 11400 11500 11600 11700 11800 11900 12000
Call Put

www.angelbroking.com
Technical & Derivatives Report
September 04, 2020
Daily Pivot Levels for Nifty Constituents
Scrips
S2
S1
PIVOT
R1
R2
ADANIPORTS
356
361
365
369
373
ASIANPAINT 1,927 1,953
1,970
1,996
2,013
AXISBANK
462
469
479
486
496
BAJAJ-AUTO 2,864 2,880
2,902
2,918
2,940
BAJFINANCE 3,562 3,591
3,634
3,663
3,706
BAJAJFINSV 6,215 6,285
6,370
6,440
6,525
BPCL
406
410
414
418
422
BHARTIARTL
525
531
542
549
559
INFRATEL
188
203
212
228
237
BRITANNIA 3,696 3,722
3,765
3,790
3,834
CIPLA
729
734
740
745
751
COALINDIA
132
134
136
138
140
DRREDDY 4,287 4,360
4,413
4,486
4,539
EICHERMOT 2,120 2,176
2,218
2,273
2,315
GAIL
96
97
98
99
100
GRASIM
664
694
712
742
760
HCLTECH
688
697
707
716
726
HDFCBANK 1,117 1,124
1,135
1,142
1,153
HDFC
574
578
583
588
593
HEROMOTOCO
1,779
1,794
1,818
1,833
1,858
HINDALCO 2,884 2,913
2,960
2,988
3,035
HINDUNILVR
189
190
193
195
198
ICICIBANK 2,114 2,127
2,141
2,153
2,167
IOC
374
378
385
390
397
INDUSINDBK
83
84
85
86
87
INFY
612
622
635
645
658
ITC
911
923
936
949
962
JSW STEEL
188
190
192
193
195
KOTAKBANK
288
291
293
296
298
LT 1,361 1,379
1,408
1,426
1,455
M&M
944
953
962
970
980
MARUTI
620
632
644
656
668
NESTLEIND 6,841 6,957
7,037
7,153
7,233
NTPC 15,733
16,063
16,252
16,582
16,770
ONGC
95
97
98
99
101
POWERGRID
77
78
80
81
82
RELIANCE
175
177
179
181
183
SHREECEM 2,082 2,097
2,118
2,133
2,154
SBIN 19,911
20,170
20,510
20,768
21,108
SUNPHARMA
209
211
215
217
221
TCS
507
515
521
529
535
TATAMOTORS 2,241 2,270
2,297
2,326
2,353
TATASTEEL
147
149
152
155
158
TECHM
431
435
439
443
447
TITAN
723
741
752
770
780
ULTRACEMCO 1,096 1,141
1,166
1,211
1,236
UPL 3,901 3,925
3,953
3,976
4,004
VEDANTA
495
508
518
531
540
WIPRO
268
276
282
289
295
ZEEL
210
215
220
225
231

www.angelbroking.com
Technical & Derivatives Report
September 04, 2020
*
Research Team Tel: 022 – 39357600 (Extn. 6844) Website: www.angelbroking.com
For Technical & Derivatives Queries E-mail: technicalresearch-cso@angelbroking.com
DISCLAIMER
Angel Broking Limited (hereinafter referred to as “Angel”) is a registered Member of National Stock Exchange of India Limited, Bombay
Stock Exchange Limited and Metropolitan Stock Exchange Limited. It is also registered as a Depository Participant with CDSL and
Portfolio Manager and Investment Adviser with SEBI. It also has registration with AMFI as a Mutual Fund Distributor. Angel Broking
Limited is a registered entity with SEBI for Research Analyst in terms of SEBI (Research Analyst) Regulations, 2014 vide registration
number INH000000164. Angel or its associates has not been debarred/ suspended by SEBI or any other regulatory authority for
accessing /dealing in securities Market. Angel or its associates/analyst has not received any compensation / managed or co-managed
public offering of securities of the company covered by Analyst during the past twelve months.
This document is solely for the personal information of the recipient, and must not be singularly used as the basis of any investment
decision. Nothing in this document should be construed as investment or financial advice. Each recipient of this document should make
such investigations as they deem necessary to arrive at an independent evaluation of an investment in the securities of the companies
referred to in this document (including the merits and risks involved), and should consult their own advisors to determine the merits
and risks of such an investment.
Reports based on technical and derivative analysis center on studying charts of a stock's price movement, outstanding positions and
trading volume, as opposed to focusing on a company's fundamentals and, as such, may not match with a report on a company's
fundamentals. Investors are advised to refer the Fundamental and Technical Research Reports available on our website to evaluate the
contrary view, if any.
The information in this document has been printed on the basis of publicly available information, internal data and other reliable
sources believed to be true, but we do not represent that it is accurate or complete and it should not be relied on as such, as this
document is for general guidance only. Angel Broking Limited or any of its affiliates/ group companies shall not be in any way
responsible for any loss or damage that may arise to any person from any inadvertent error in the information contained in this report.
Angel Broking Limited has not independently verified all the information contained within this document. Accordingly, we cannot
testify, nor make any representation or warranty, express or implied, to the accuracy, contents or data contained within this document.
While Angel Broking Limited endeavors to update on a reasonable basis the information discussed in this material, there may be
regulatory, compliance, or other reasons that prevent us from doing so.
This document is being supplied to you solely for your information, and its contents, information or data may not be reproduced,
redistributed or passed on, directly or indirectly.
Technical and Derivatives Team:
Sameet Chavan Chief Analyst - Technical & Derivatives sameet.chavan@angelbroking.com
Ruchit Jain Senior Analyst - Technical & Derivatives ruchit.jain@angelbroking.com
Rajesh Bhosale Technical Analyst rajesh.bhosle@angelbroking.com
Sneha Seth Derivatives Analyst sneha.seth@angelbroking.com
