www.angelbroking.com
Technical & Derivatives Report
August 04, 2020
Nifty
Bank Out
look
-
(
21072
)
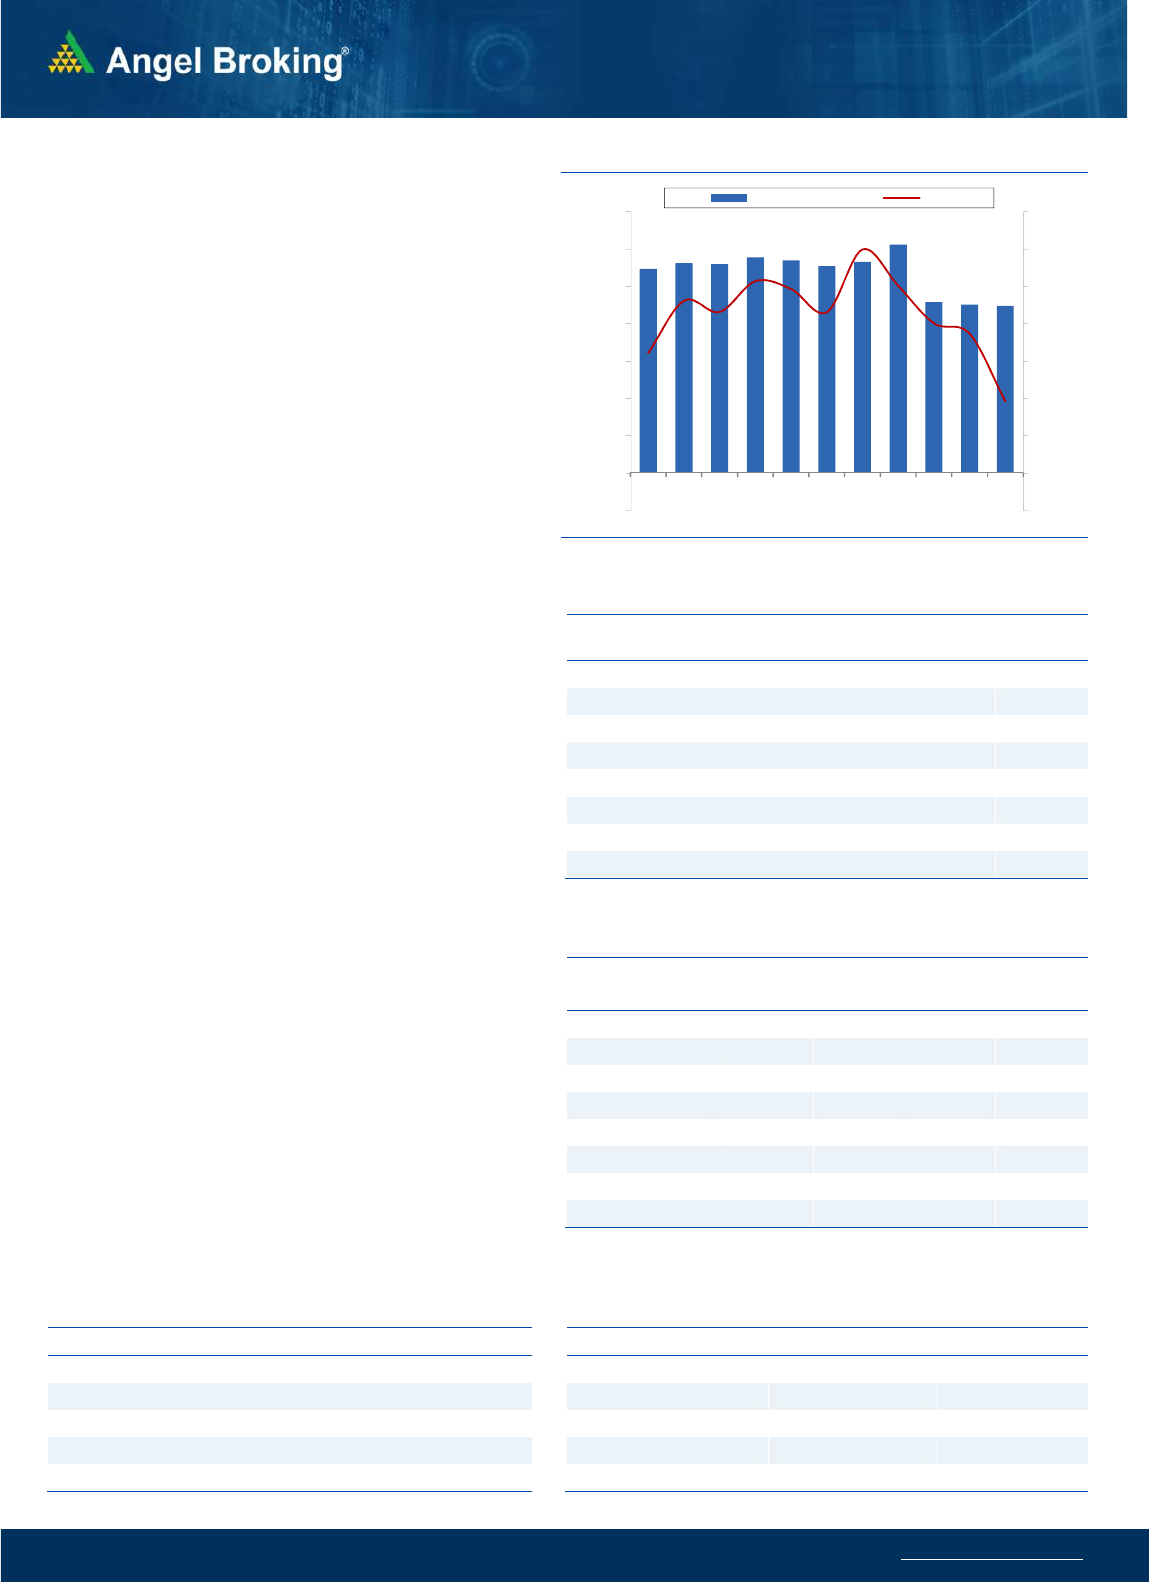
If we keep aside the banking space, the market does not appear to
be weak. If Nifty has corrected from 11300 plus levels, the banking
is the sole culprit behind this more than 400 points decline. Now
both Nifty and Bank Nifty are placed at 'Make or Break' levels and
as we alluded in the previous commentary, in the first half of the
current week, all suspense will unfold whether we are likely to
correct further or not. Coincidentally, the RBI monetary policy is
slated this thursday and this might become the catalyst for the
next directional move. Before all this, let see what are the levels
to watch for the forthcoming session. The Bank Nifty is very close
to its recent swing low of 21027 and it would be seen as a crucial
support. If the index slides and stays below it we could see a strong
decline towards 20700 - 20400 levels. Whereas on the flipside, if
any reversal has to happen, this is the level from where it can. Any
positive trigger would result in a sharp bounce back in coming
days. As far as intraday resistance levels are concerned, keep a
close eye on 21250 -21550.
Key Levels
Support 1 – 21027 Resistance 1 – 21250
Support 2 – 20700 Resistance 2 – 21550
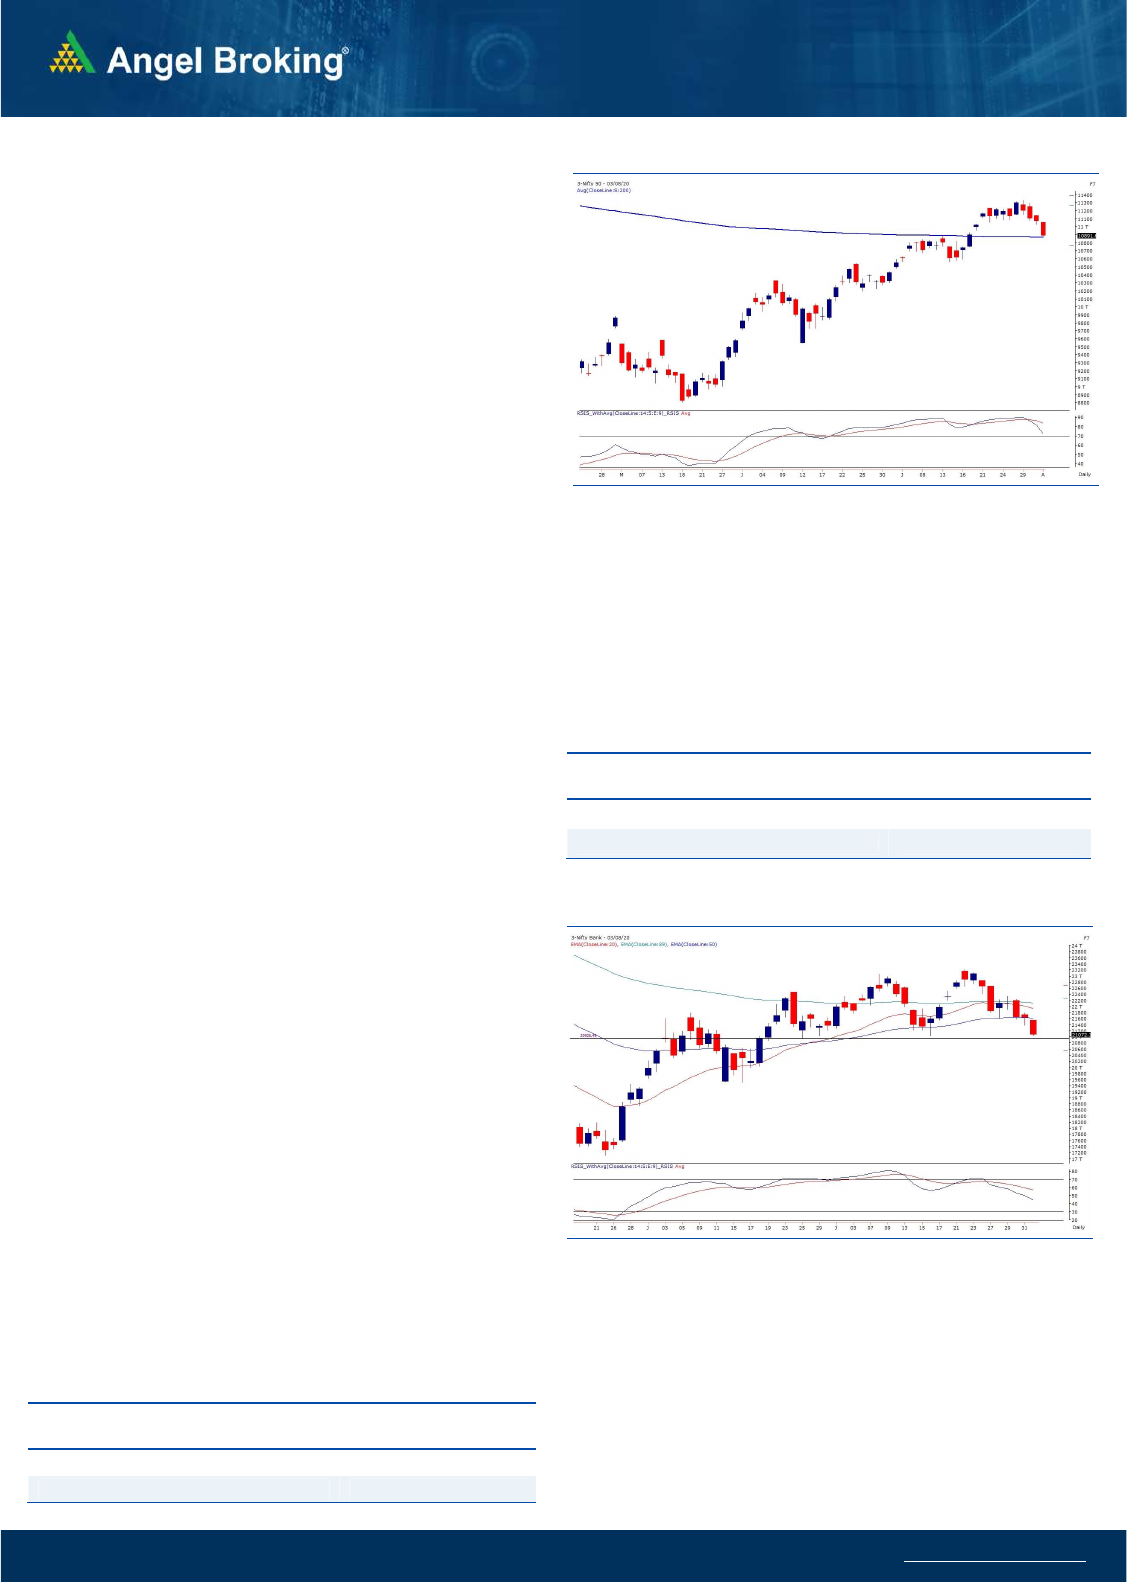
Exhibit 1: Nifty Daily Chart
Sensex (36940) / Nifty (10892)
Nifty started trading for the week marginally negative above the
11050 mark. However, it corrected from the opening ticks itself and
crept lower throughout the day to end below 10900, with a loss of
over 180 points.
During end of last week, the index had indicated some signs of profit
booking and we witnessed a continuation of the correction in Nifty
in yesterday’s session. The Bank Nifty index, which had recently seen
a relative underperformance, continued to be the culprit to drag the
index lower. If we look at the recent historical data, Nifty had given
a range breakout during mid-July above the resistance of 10890.
After a move upto 11340 post the breakout, the index has seen a
pullback move and is now back to that level. As per the role reversal
technique in technical analysis, such previous breakouts usually act
as support on pullback moves and this also coincides with the ‘200
SMA’ on the daily chart. The index has ended in the vicinity of the
support range of 10870-10900 and thus, we could again see some
pullback if this support holds its importance. Below this, the hourly
charts implies intraday support around 10800 mark. However, one
should also keep a tab on the Bank Nifty index without which a
meaningful pullback in Nifty would be difficult. Traders are advised
to avoid forming shorts at current zone as there are multiple
supports seen. The intraday resistance in Nifty for the coming
session is seen in the range of 11000-11050.
Exhibit 2: Nifty Bank Daily Chart
Inspite of the negative momentum in the index, the overall stocks
specific action was quite mixed and the market breadth was infact
marginally positive. The Pharma space kept buzzing with the midcap
names from that space joining the momentum and the Nifty Midcap
index too showed relative outperformance to the benchmark. Hence,
trading with a stock specific approach would provide better
opportunities and hence traders are advised to capitalize on the
same.
Key Levels
Support 1 – 10870 Resistance 1 – 11000
Support 2 – 10800 Resistance 2 – 11050
www.angelbroking.com
Technical & Derivatives Report
August
04, 2020
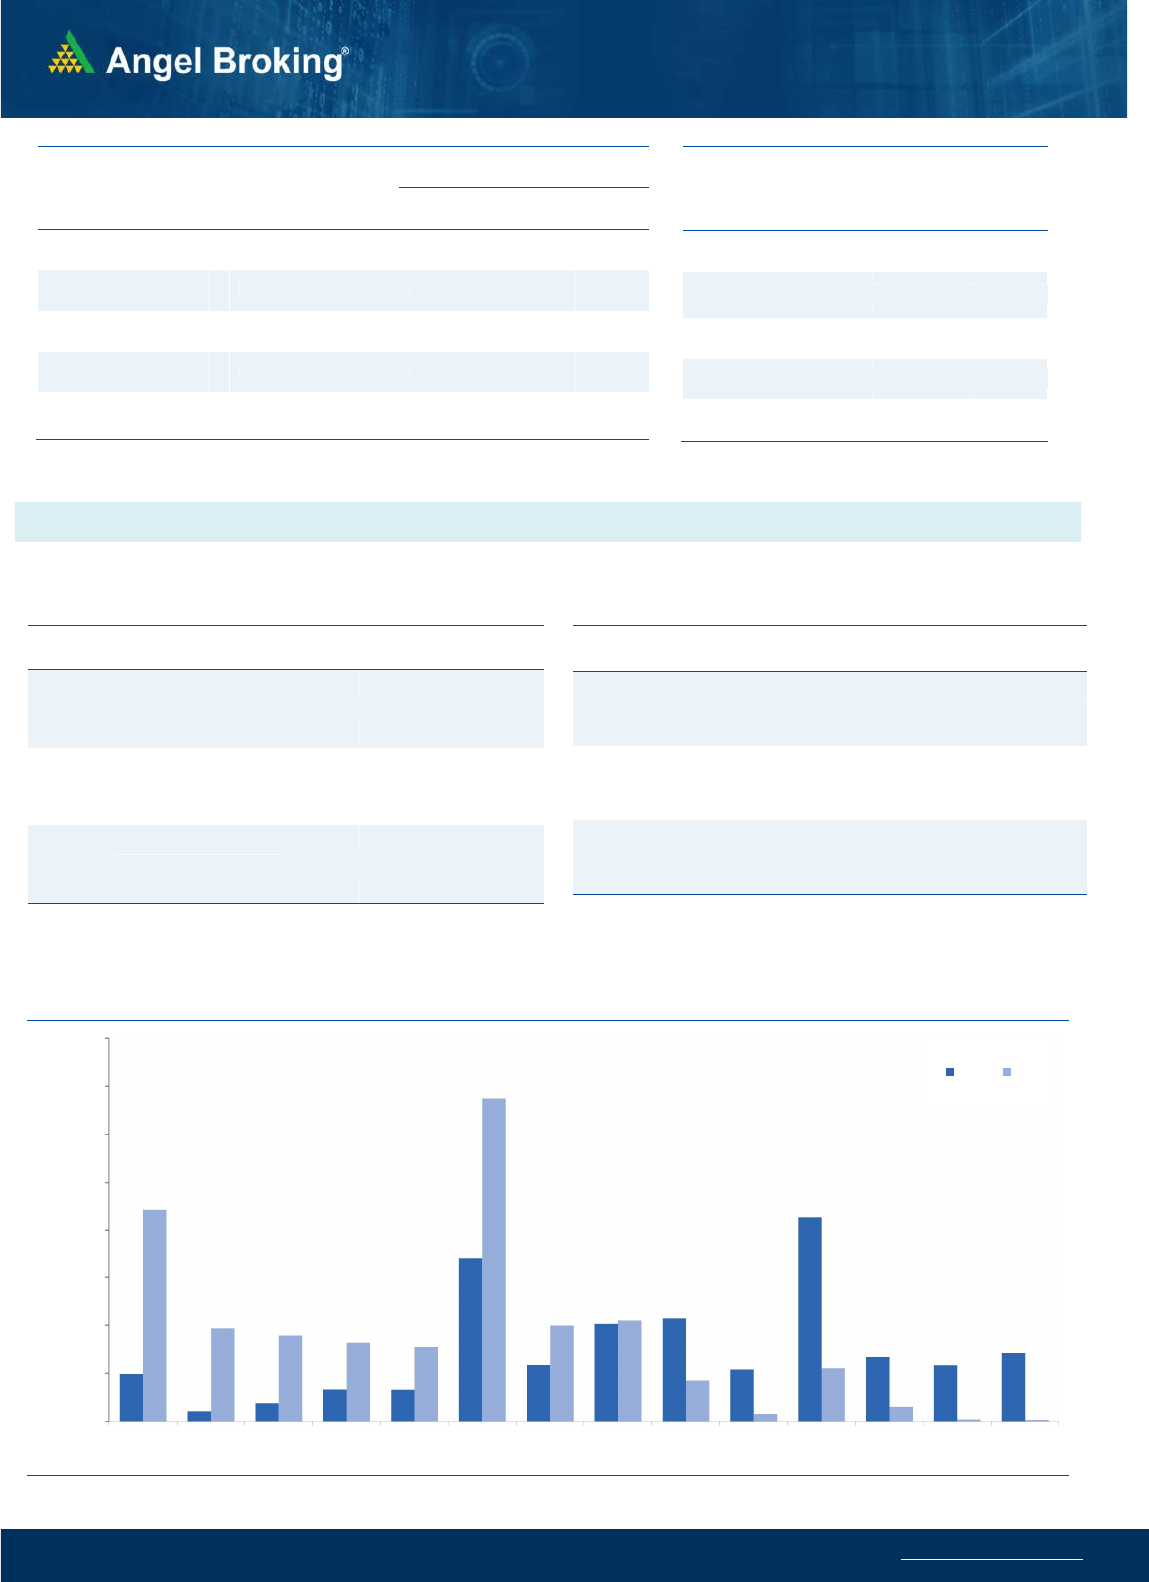
Nifty Vs OI
10600
10700
10800
10900
11000
11100
11200
11300
11400
,0
2,000
4,000
6,000
8,000
10,000
12,000
14,000
16,000
7/20 7/21 7/22 7/23 7/24 7/27 7/28 7/29 7/30 7/31 8/3
(`000)
Openinterest Nifty
View
s
The week started with a marginal negative opening and
the Index continued to slide throughout the session to
end with loss of 1.64% at 10891.60.
FIIs were net buyers in the cash market segment to the
tune of Rs. 7818 crores(including BANDHANBNK block
deal). In index futures, they sold worth 2615 crores with
decrease in open interest indicating long unwinding
and short formations in yesterday’s session
.
Nifty as well as Bank Nifty corrected right from the
opening ticks yesterday and ended deeply in red. While
there was no significant change in Nifty positions, Bank
Nifty witnessed short formation as a good amount of
open interest build up was seen. FII's unwinded their
long positions and formed short positions in the index
futures segment. In options segment, 11000-11200 call
options added decent open interest whereas unwinding
was seen in 11000-11100 put options. The above data,
especially the short build-up in BankNifty is a negative
sign for the short term and hence traders are advised to
stay light on positions on the index and focus on stock
specific trading opportunities.
C
o
mme
n
t
s
The Nifty futures open interest has decreased by 0.68%
Bank Nifty futures open interest has increased by 14.52%
as market closed at 10891.6 levels.
The Nifty August future closed with a premium of 21.8
point against a premium of 22.4 point in last trading
session. The September series closed at a premium of
26.5 point.
The INDIA VIX has increased from 24.19 to 25.18
At the same time, the PCR-OI of Nifty decreased from
1.31 to 1.10.
Few of the liquid counters where we have seen high cost
of carry are IDEA, NATIONALUM, ICICIBANK,
MUTHOOTFIN, AND FEDERALBNK.
OI Gainers
SCRIP OI
OI
CHG. (%)
PRICE
PRICE
CHG. (%)
BANDHANBNK 24858000 147.23 308.80 -10.40
IDEA 291060000 38.05 8.70 3.53
TATAMOTORS 98370600 22.24 113.05 8.24
UJJIVAN 3302200 20.37 227.05 -4.31
ESCORTS 2476100 12.44 1102.15 -2.49
MUTHOOTFIN 3350250 9.49 1282.40 0.77
GODREJPROP 487500 7.60 921.75 -0.81
IBULHSGFIN 13230800 7.43 182.60 -3.99
OI Losers
SCRIP OI
OI
CHG. (%)
PRICE
PRICE
CHG. (%)
APOLLOHOSP 1125000 -9.75 1574.35 -5.20
SRF 607750 -4.85 3833.20 1.07
BIOCON 14356600 -4.85 411.90 0.40
JUBLFOOD 1917000 -3.69 1738.65 0.68
AMBUJACEM 18651000 -3.22 221.15 0.41
MFSL 1666600 -2.95 542.90 -2.72
HDFCLIFE 10659000 -2.73 603.00 -3.72
NAUKRI 708250 -2.71 3158.50 -1.35
Put-Call Ratio
SCRIP PCR-OI PCR-VOL
NIFTY 1.10 0.86
BANKNIFTY 0.63 0.87
RELIANCE 0.63 0.52
ICICIBANK 0.51 0.50
INFY 0.88 0.76
Historical Volatility
SCRIP HV
BANDHANBNK 96.23
APOLLOHOSP 56.79
TATAMOTORS 73.90
UPL 63.09
KOTAKBANK 55.61
www.angelbroking.com
Technical & Derivatives Report
August
04, 2020
Note: Above mentioned Bullish or Bearish Spreads in Nifty (August Series) are given as an information and not as a recommendation.
Nifty Spot =
10891.60
FII Statistics for August 03, 2020
Detail Buy
Sell Net
Open Interest
Contracts
Value
(in Cr.)
Change
(%)
INDEX
FUTURES
2938.74
5553.62
(2614.88) 117742
8693.65
(0.92)
INDEX
OPTIONS
133616.40
133211.21
405.19
623408
47322.42
5.87
STOCK
FUTURES
13720.81
15287.50
(1566.69) 1248461
84905.74
1.69
STOCK
OPTIONS
4930.33
4860.83
69.50
54862
3626.18
15.29
Total 155206.28
158913.16
(3706.88) 2044473
144547.99
3.10
Turnover on August 03, 2020
Instrument
No. of
Contracts
Turnover
( in Cr. )
Change
(%)
Index Futures 4,42,966 29029.82 -11.27
Index Options 1,35,79,020
9,27,215.67 -3.41
Stock Futures 7,95,721 56240.55 -15.74
Stock Options 9,02,213 68626.75 -11.67
Total 1,57,19,920
10,81,112.79 -90.49
Bull-Call Spreads
Action Strike Price Risk Reward BEP
Buy 10900 259.00
49.40 50.60 10949.40
Sell 11000 209.60
Buy 10900 259.00
93.45 106.55 10993.45
Sell 11100 165.55
Buy 11000 209.60
44.05 55.95 11044.05
Sell 11100 165.55
Bear-Put Spreads
Action Strike Price Risk Reward BEP
Buy 10900 245.45
42.95 57.05 10857.05
Sell 10800 202.50
Buy 10900 245.45
80.70 119.30 10819.30
Sell 10700 164.75
Buy 10800 202.50
37.75 62.25 10762.25
Sell 10700 164.75
Nifty Put-Call Analysis
,0
500,000
1000,000
1500,000
2000,000
2500,000
3000,000
3500,000
4000,000
10500 10600 10700 10800 10900 11000 11100 11200 11300 11400 11500 11600 11700 11800
Call Put

www.angelbroking.com
Technical & Derivatives Report
August
04, 2020
Daily Pivot Levels for Nifty Constituents
Scrips
S2
S1
PIVOT
R1
R2
ADANIPORTS
302
307
313
318
324
ASIANPAINT 1,675 1,690
1,713
1,728
1,750
AXISBANK
405
411
422
428
438
BAJAJ-AUTO 2,806 2,862
2,966
3,022
3,126
BAJFINANCE 3,121 3,148
3,196
3,223
3,271
BAJAJFINSV 5,966 6,034
6,129
6,197
6,292
BPCL
398
408
418
428
438
BHARTIARTL
540
544
550
554
560
INFRATEL
184
187
191
193
197
BRITANNIA 3,716 3,746
3,798
3,828
3,880
CIPLA
682
696
715
729
748
COALINDIA
127
128
129
130
131
DRREDDY 4,396 4,462
4,566
4,632
4,736
EICHERMOT 20,269
20,526
20,910
21,166
21,551
GAIL
91
93
95
96
98
GRASIM
612
623
633
644
654
HCLTECH
691
698
708
716
726
HDFCBANK
973
988
1,007
1,022
1,041
HDFC
586
594
609
618
633
HEROMOTOCO
1,699
1,719
1,751
1,771
1,802
HINDALCO 2,525 2,578
2,674
2,727
2,823
HINDUNILVR
156
159
163
166
170
ICICIBANK 2,171 2,188
2,205
2,222
2,240
IOC
336
339
344
348
353
INDUSINDBK
84
85
87
88
90
INFY
488
495
509
516
530
ITC
939
948
957
966
975
JSW STEEL
191
192
193
194
195
KOTAKBANK
215
218
222
224
228
LT 1,266 1,287
1,322
1,343
1,377
M&M
897
906
913
923
929
MARUTI
578
587
604
614
630
NESTLEIND 5,930 6,048
6,243
6,360
6,555
NTPC 16,242
16,383
16,492
16,633
16,742
ONGC
84
85
86
87
88
POWERGRID
74
75
77
78
80
RELIANCE
172
175
177
181
183
SHREECEM 1,969 1,989
2,023
2,043
2,077
SBIN 21,326
21,537
21,700
21,911
22,074
SUNPHARMA
188
190
192
195
197
TCS
502
511
525
534
549
TATAMOTORS 2,190 2,222
2,263
2,295
2,336
TATASTEEL
99
106
110
117
122
TECHM
356
365
371
380
386
TITAN
659
666
677
684
694
ULTRACEMCO 1,020 1,049
1,072
1,100
1,123
UPL 3,949 3,997
4,076
4,125
4,203
VEDANTA
421
437
461
476
500
WIPRO
277
279
282
284
287
ZEEL
131
133
136
138
141

www.angelbroking.com
Technical & Derivatives Report
August
04, 2020
*
Research Team Tel: 022 – 39357600 (Extn. 6844) Website: www.angelbroking.com
For Technical & Derivatives Queries E-mail: technicalrese[email protected]
DISCLAIMER
Angel Broking Limited (hereinafter referred to as “Angel”) is a registered Member of National Stock Exchange of India Limited, Bombay
Stock Exchange Limited and Metropolitan Stock Exchange Limited. It is also registered as a Depository Participant with CDSL and
Portfolio Manager and Investment Adviser with SEBI. It also has registration with AMFI as a Mutual Fund Distributor. Angel Broking
Limited is a registered entity with SEBI for Research Analyst in terms of SEBI (Research Analyst) Regulations, 2014 vide registration
number INH000000164. Angel or its associates has not been debarred/ suspended by SEBI or any other regulatory authority for
accessing /dealing in securities Market. Angel or its associates/analyst has not received any compensation / managed or co-managed
public offering of securities of the company covered by Analyst during the past twelve months.
This document is solely for the personal information of the recipient, and must not be singularly used as the basis of any investment
decision. Nothing in this document should be construed as investment or financial advice. Each recipient of this document should make
such investigations as they deem necessary to arrive at an independent evaluation of an investment in the securities of the companies
referred to in this document (including the merits and risks involved), and should consult their own advisors to determine the merits
and risks of such an investment.
Reports based on technical and derivative analysis center on studying charts of a stock's price movement, outstanding positions and
trading volume, as opposed to focusing on a company's fundamentals and, as such, may not match with a report on a company's
fundamentals. Investors are advised to refer the Fundamental and Technical Research Reports available on our website to evaluate the
contrary view, if any.
The information in this document has been printed on the basis of publicly available information, internal data and other reliable
sources believed to be true, but we do not represent that it is accurate or complete and it should not be relied on as such, as this
document is for general guidance only. Angel Broking Limited or any of its affiliates/ group companies shall not be in any way
responsible for any loss or damage that may arise to any person from any inadvertent error in the information contained in this report.
Angel Broking Limited has not independently verified all the information contained within this document. Accordingly, we cannot
testify, nor make any representation or warranty, express or implied, to the accuracy, contents or data contained within this document.
While Angel Broking Limited endeavors to update on a reasonable basis the information discussed in this material, there may be
regulatory, compliance, or other reasons that prevent us from doing so.
This document is being supplied to you solely for your information, and its contents, information or data may not be reproduced,
redistributed or passed on, directly or indirectly.
Technical and Derivatives Team:
Sameet Chavan Chief Analyst - Technical & Derivatives sameet.chavan@angelbroking.com
Ruchit Jain Senior Analyst - Technical & Derivatives ruchit.jain@angelbroking.com
Rajesh Bhosale Technical Analyst rajesh.bhosle@angelbroking.com
Sneha Seth Derivatives Analyst sneha.seth@angelbroking.com
