www.angelbroking.com
June 04, 2021
Technical & Derivatives Report
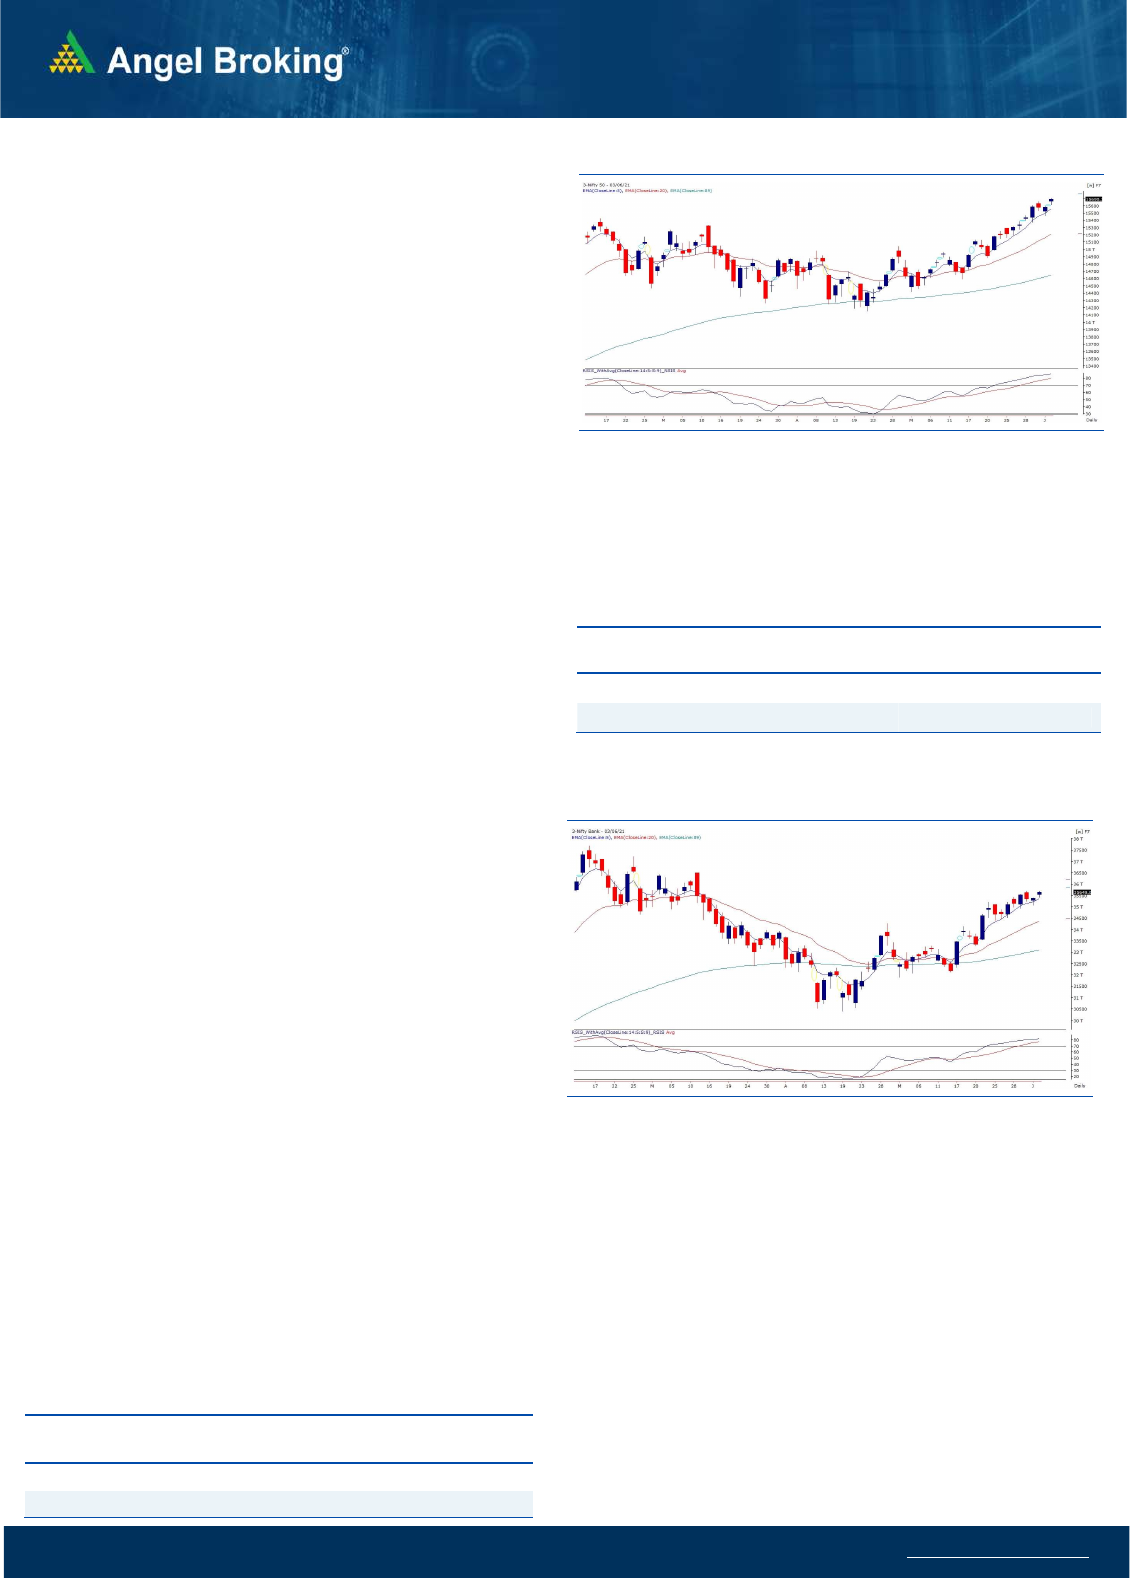
Exhibit 1: Nifty Daily Chart
Nifty
Bank Out
look
-
(
35649)
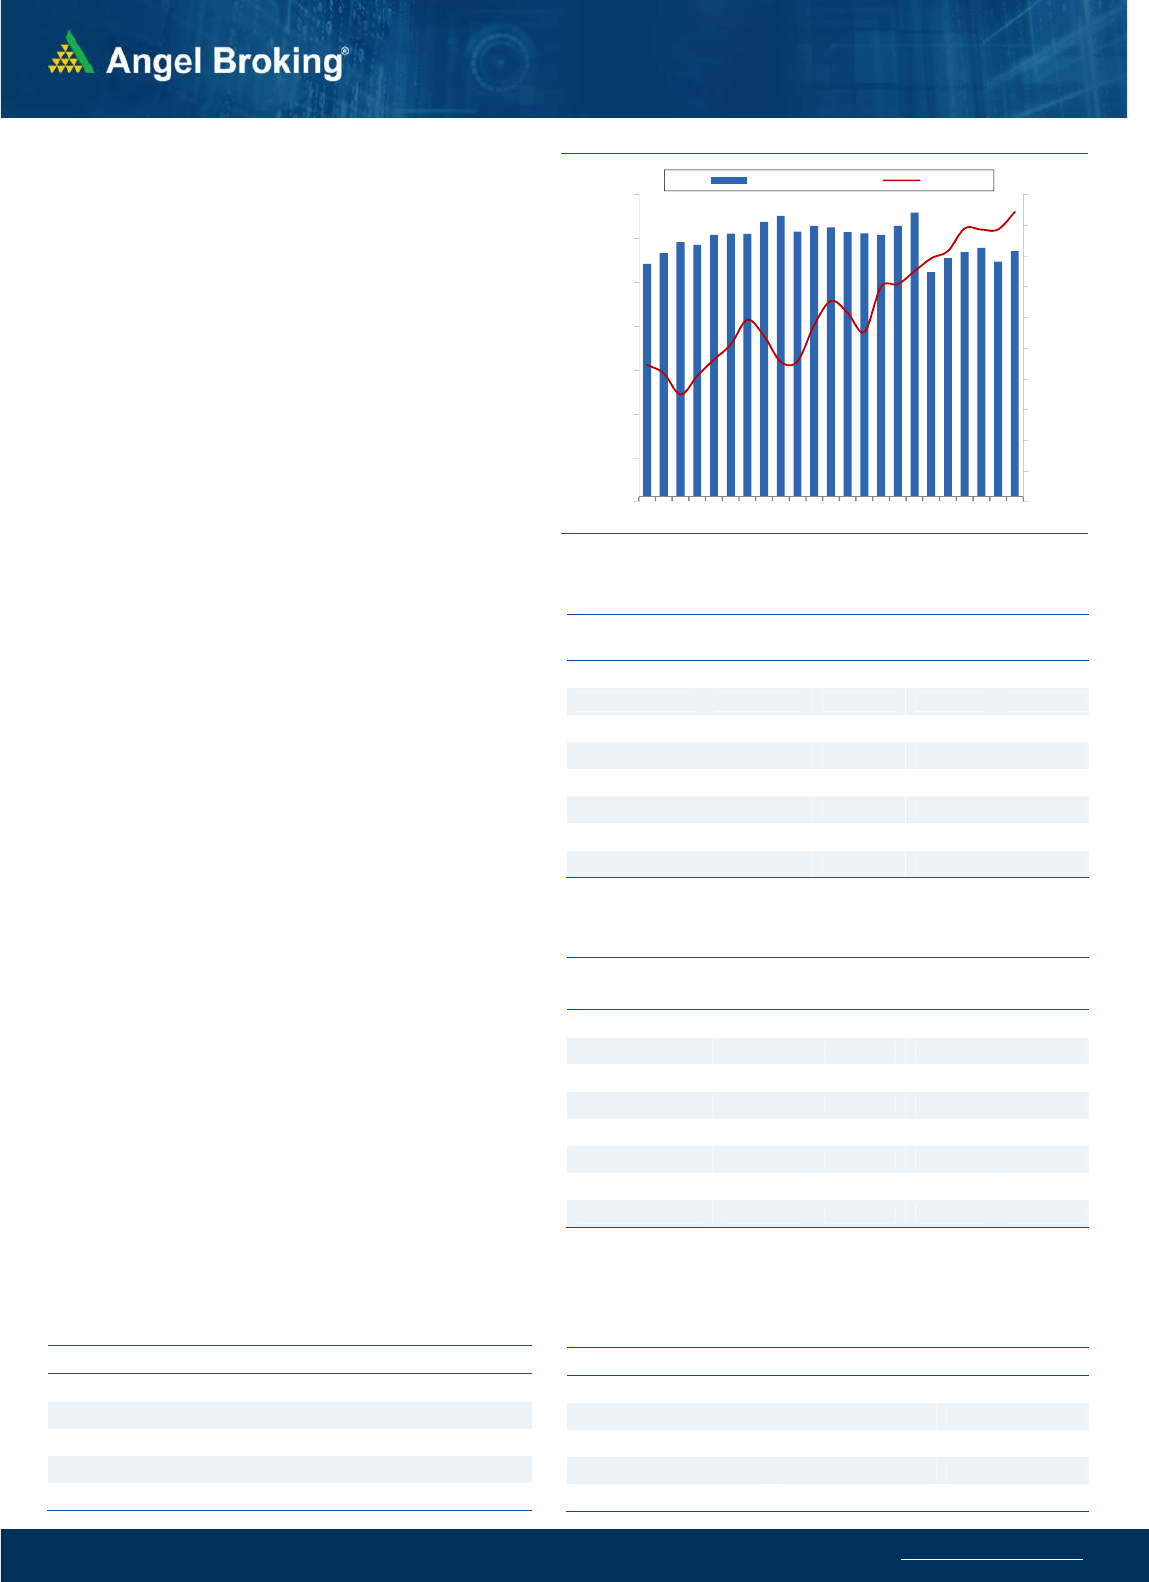
We started the weekly expiry day on a cheerful note tad above
35500 mark but due to lack of momentum traded in a narrow
range. As we approached latter half of the day, the index
witnessed some fresh buying interest to surpass recent highs of
35713; however, this was just a formality as index cooled off a
bit after that. Eventually, we concluded second consecutive
session in green with the gain of almost eighth tenth of a
percent.
As far as technical chart structure is concerned; the overall
picture still looks same as we haven’t see an major price action
recently. However, the banking index have been slowly and
steadily inching towards the next target of 36400-36500. As
mentioned previously, the individual counters have been
showing mixed activity and hence, we would advised to
watchful before initiating any aggressive directional bets in this
basket. At this point in time, we maintain our optimistic stance
in this space but would advised avoiding any leveraged
positions until we see relevant momentum attracting the
market.
Key Levels
Support 1 – 35200 Resistance 1 – 36400
Support 2 – 35000 Resistance 2 – 36500
Exhibit 2: Nifty Bank Daily Chart
We reiterate when market moves in such typical manner, it’s
better not to get complacent and one should take one step at a
time. Also, it would be a prudent strategy to avoid aggressive
leveraged bets (especially overnight)because any in between
hiccup may spoil your short term trading journey.
Key Levels
Support 1 – 15600 Resistance 1 – 15800
Support 2 – 15450 Resistance 2 – 15870
Se
nsex
(
52232)
/ Nifty
(
15690
)
Markets opened higher yesterday at new highs as suggested by
the SGX Nifty early in the morning. During the first half, market
came off marginally but reversed from midway after partially
filling up the opening gap. The buying momentum accelerated in
the final hour of the session to reach yet another milestone of
15700. Eventually the weekly expiry panned out tad below this by
marking daily gains over seven tenths of a percent.
The kind of price action we have been witnessing since few days,
the commentary would sound a bit repetitive because there is
nothing different to talk about. As we have been mentioning,
every 100 points upside level should be treated as immediate
resistance and now this level comes at 15800. On the flipside,
15600 would be seen as intraday support and any sustainable
move below this point would trigger some mild corrective move
towards 15525 – 15450. Only a handful of index heavyweights
are giving some notable moves, otherwise the real action still
continues in the broader end of the spectrum. Stock from the cash
segment are literally roaring and hence it’s advisable to stick to
this approach.
www.angelbroking.com
Technical & Derivatives Report
June 04, 2021
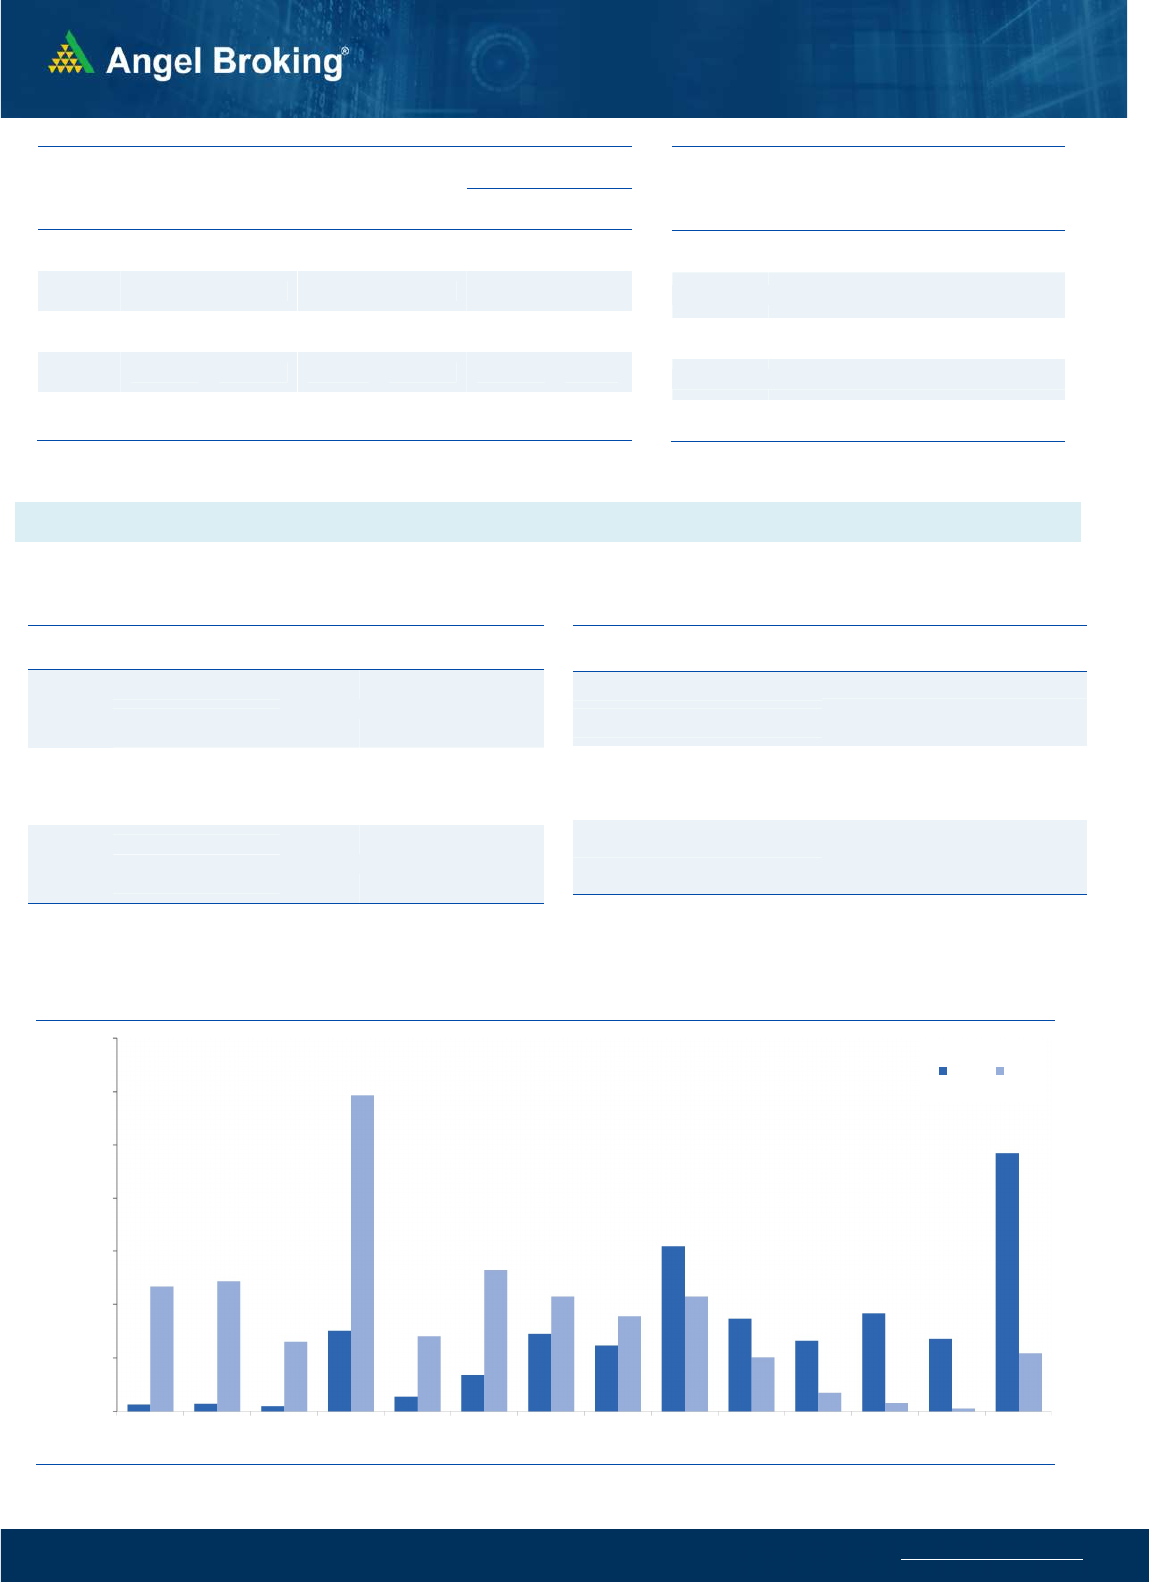
Nifty Vs OI
13800
14000
14200
14400
14600
14800
15000
15200
15400
15600
15800
,0
20,000
40,000
60,000
80,000
100,000
120,000
140,000
4/30 5/4 5/6 5/10 5/12 5/17 5/17 5/24 5/26 5/28 6/1 6/3
(`000)
Openinterest Nifty
View
Nifty started the weeky expiry session on a positive note
and we saw positive momentum throughout the day to
end around 15700 mark.
FIIs were net buyers in the cash segment to the tune of
Rs. 1079 crores. In index futures front, they bought worth
Rs. 560 crores with increase in open interest indicating
long formations in yesterday’s session.
The indices continued to inch higher with long
formations in Nifty. FII's bought equities in cash and
formed long positions in index futures too. Their 'Long
Short Ratio' is still above 85 percent indicating their
bullish stance on the market. The options segment
indicates support around 15500 while resistances are
seen around 15800 and 16000. Traders are advised to
continue to trade with a positive bias and look for buying
opportunities on any intraday dips.
C
o
mme
n
t
s
The Nifty futures open interest has increased by 4.37%.
Bank Nifty futures open interest has decreased by 0.59%
as market closed at 15690.35 levels.
The Nifty June future closed with a premium of 22.05
point against a premium of 40.55 point in last trading
session. The July series closed at a premium of 70.2 point.
The INDIA VIX decreased from 17.21 to 15.74.
At the same time, the PCR-OI of Nifty increased from 1.27
to 1.35.
Few of the liquid counters where we have seen high cost
of carry are IDEA, ONGC, GMRINFRA, ASHOKLEY, AND
BPCL
OI Gainers
SCRIP OI
OI
CHG. (%)
PRICE
PRICE
CHG. (%)
ONGC 64918700 25.67 122.50 4.27
DEEPAKNTR 2546500 17.87 1740.25 -0.72
TITAN 4605375 11.54 1691.20 6.31
JUBLFOOD 1366250 11.35 3176.60 4.41
MPHASIS 459550 10.56 1919.70 0.45
GODREJPROP 1750450 9.74 1406.70 1.13
NAVINFLUOR 325125 9.47 3168.25 -1.42
TATACHEM 8944000 9.03 727.75 2.20
OI Losers
SCRIP OI
OI
CHG. (%)
PRICE
PRICE
CHG. (%)
MARICO 6620000 -9.09 496.40 0.99
BANDHANBNK 16954200 -8.81 317.70 1.90
MUTHOOTFIN 2856750 -7.64 1511.70 6.50
GUJGASLTD 1870000 -6.27 580.75 2.19
COFORGE 986875 -5.95 3644.50 1.61
TORNTPOWER 1947000 -5.12 439.35 0.94
BERGEPAINT 3543100 -5.07 800.55 0.75
BAJAJ-AUTO 1676500 -4.68 4273.40 -0.44
Put-Call Ratio
SCRIP PCR-OI PCR-VOL
NIFTY 1.35 0.98
BANKNIFTY 0.89 0.89
RELIANCE 0.51 0.37
ICICIBANK 0.59 0.46
INFY 0.55 0.38
Historical Volatility
SCRIP HV
VOLTAS 41.53
TITAN 41.74
MUTHOOTFIN 52.43
MOTHERSUMI 67.20
APOLLOHOSP 48.37
www.angelbroking.com
Technical & Derivatives Report
June 04, 2021
Note: Above mentioned Bullish or Bearish Spreads in Nifty (June Series) are given as an information and not as a recommendation.
Nifty Spot =
15690.35
FII Statistics for June 03, 2021
Detail Buy
Net Contracts
Open Interest
Sell
Value
(in Cr.)
Change
INDEX
FUTURES
3429.62
2869.86
559.76
117741
13034.69
4.61
INDEX
OPTIONS
640804.01
643812.47
(3008.46) 667734
72836.01
(34.34)
STOCK
FUTURES
14240.31
15094.47
(854.16) 1378036
109774.10
0.22
STOCK
OPTIONS
15954.58
16200.62
(246.04) 221264
16994.14
14.43
Total 674428.52
677977.42
(3548.90) 2384775
212638.94
(11.61)
Turnover on June 03, 2021
Instru
ment
No. of
Contracts
Turnover
( in Cr. )
Change
(%)
Index Futures
2,13,128 21215.03 -0.14
Index Options
7,97,24,508 77,93,068.88 92.16
Stock Futures
8,46,046 69182.77 -3.48
Stock Options
23,31,137 1,91,938.11 6.82
Total 8,31,14,819 80,75,404.79 86.58
Bull-Call Spreads
Action Strike Price Risk Reward BEP
Buy 15700 208.95
52.35 47.65 15752.35
Sell 15800 156.60
Buy 15700 208.95
96.95 103.05 15796.95
Sell 15900 112.00
Buy 15800 156.60
44.60 55.40 15844.60
Sell 15900 112.00
Bear-Put Spreads
Action Strike Price Risk Reward BEP
Buy 15700 195.65
38.20 61.80 15661.80
Sell 15600 157.45
Buy 15700 195.65
69.35 130.65 15630.65
Sell 15500 126.30
Buy 15600 157.45
31.15 68.85 15568.85
Sell 15500 126.30
Nifty Put-Call Analysis
,0
500,000
1000,000
1500,000
2000,000
2500,000
3000,000
3500,000
14700 14800 14900 15000 15100 15200 15300 15400 15500 15600 15700 15800 15900 16000
Call Put

www.angelbroking.com
Technical & Derivatives Report
June 04, 2021
Da
ily
Pivot Level
s for
Nifty Constituents
Scrips
S2
S1
PIVOT
R1
R2
ADANIPORTS
790
808
828
846
867
ASIANPAINT 2,889 2,912
2,927
2,950
2,965
AXISBANK
734
742
747
756
761
BAJAJ-AUTO 4,214 4,244
4,272
4,302
4,330
BAJFINANCE 5,731 5,816
5,866
5,951
6,000
BAJAJFINSV 11,698
11,759
11,841
11,902
11,985
BPCL
470
472
475
477
480
BHARTIARTL
526
529
531
534
536
BRITANNIA 3,456 3,476
3,488
3,508
3,520
CIPLA
938
943
951
957
965
COALINDIA
148
148
149
150
151
DIVISLAB 4,192 4,212
4,228
4,248
4,264
DRREDDY 5,224 5,253
5,297
5,326
5,370
EICHERMOT 2,644 2,706
2,740
2,802
2,837
GRASIM 1,425 1,442
1,453
1,470
1,481
HCLTECH
929
934
942
947
955
HDFCBANK 1,474 1,497
1,511
1,534
1,548
HDFCLIFE
673
676
679
682
686
HDFC 2,535 2,559
2,581
2,606
2,628
HEROMOTOCO 2,943 2,976
2,995
3,028
3,047
HINDALCO
393
396
401
404
408
HINDUNILVR 2,334 2,348
2,360
2,375
2,386
ICICIBANK
641
645
650
654
658
IOC
109
111
112
114
115
INDUSINDBK
929
967
1,002
1,041
1,076
INFY 1,367 1,378
1,389
1,400
1,411
ITC
207
208
210
210
212
JSW STEEL
695
704
713
722
730
KOTAKBANK 1,773 1,793
1,811
1,831
1,849
LT 1,458 1,484
1,500
1,526
1,541
M&M
789
796
804
811
820
MARUTI 7,137 7,173
7,202
7,238
7,266
NESTLEIND 17,443
17,621
17,738
17,916
18,033
NTPC
110
111
111
113
113
ONGC
116
119
122
125
127
POWERGRID
222
224
228
230
234
RELIANCE 2,165 2,187
2,219
2,241
2,272
SBILIFE
977
982
986
991
996
SHREECEM 27,759
28,054
28,227
28,521
28,695
SBIN
430
435
438
443
447
SUNPHARMA
669
672
677
680
684
TCS 3,108 3,124
3,139
3,156
3,171
TATACONSUM
669
675
679
684
689
TATAMOTORS
322
324
326
328
330
TATASTEEL 1,098 1,110
1,125
1,137
1,152
TECHM 1,000 1,007
1,014
1,021
1,028
TITAN 1,547 1,619
1,661
1,733
1,774
ULTRACEMCO 6,544 6,593
6,624
6,673
6,704
UPL
821
831
838
848
855
WIPRO
531
535
542
547
554

www.angelbroking.com
Technical & Derivatives Report
June 04, 2021
*
Research Team Tel: 022 – 39357600 (Extn. 6844) Website: www.angelbroking.com
For Derivatives Queries E-mail: derivatives.desk@angelbroking.com
DISCLAIMER
Angel Broking Limited (hereinafter referred to as “Angel”) is a registered Member of National Stock Exchange of India Limited, Bombay
Stock Exchange Limited and Metropolitan Stock Exchange Limited. It is also registered as a Depository Participant with CDSL and
Portfolio Manager and Investment Adviser with SEBI. It also has registration with AMFI as a Mutual Fund Distributor. Angel Broking
Limited is a registered entity with SEBI for Research Analyst in terms of SEBI (Research Analyst) Regulations, 2014 vide registration
number INH000000164. Angel or its associates has not been debarred/ suspended by SEBI or any other regulatory authority for
accessing /dealing in securities Market. Angel or its associates/analyst has not received any compensation / managed or co-managed
public offering of securities of the company covered by Analyst during the past twelve months.
This document is solely for the personal information of the recipient, and must not be singularly used as the basis of any investment
decision. Nothing in this document should be construed as investment or financial advice. Each recipient of this document should make
such investigations as they deem necessary to arrive at an independent evaluation of an investment in the securities of the companies
referred to in this document (including the merits and risks involved), and should consult their own advisors to determine the merits
and risks of such an investment.
Reports based on technical and derivative analysis center on studying charts of a stock's price movement, outstanding positions and
trading volume, as opposed to focusing on a company's fundamentals and, as such, may not match with a report on a company's
fundamentals. Investors are advised to refer the Fundamental and Technical Research Reports available on our website to evaluate the
contrary view, if any.
The information in this document has been printed on the basis of publicly available information, internal data and other reliable
sources believed to be true, but we do not represent that it is accurate or complete and it should not be relied on as such, as this
document is for general guidance only. Angel Broking Limited or any of its affiliates/ group companies shall not be in any way
responsible for any loss or damage that may arise to any person from any inadvertent error in the information contained in this report.
Angel Broking Limited has not independently verified all the information contained within this document. Accordingly, we cannot
testify, nor make any representation or warranty, express or implied, to the accuracy, contents or data contained within this document.
While Angel Broking Limited endeavors to update on a reasonable basis the information discussed in this material, there may be
regulatory, compliance, or other reasons that prevent us from doing so.
This document is being supplied to you solely for your information, and its contents, information or data may not be reproduced,
redistributed or passed on, directly or indirectly.
Technical and Derivatives Team:
Sameet Chavan Chief Analyst - Technical & Derivatives sameet.chavan@angelbroking.com
Ruchit Jain Senior Analyst - Technical & Derivatives ruchit.jain@angelbroking.com
Rajesh Bhosale Technical Analyst rajesh.bhosle@angelbroking.com
Sneha Seth Derivatives Analyst sneha.seth@angelbroking.com
