www.angelbroking.com
January 04, 2021
Technical &
Derivatives Report
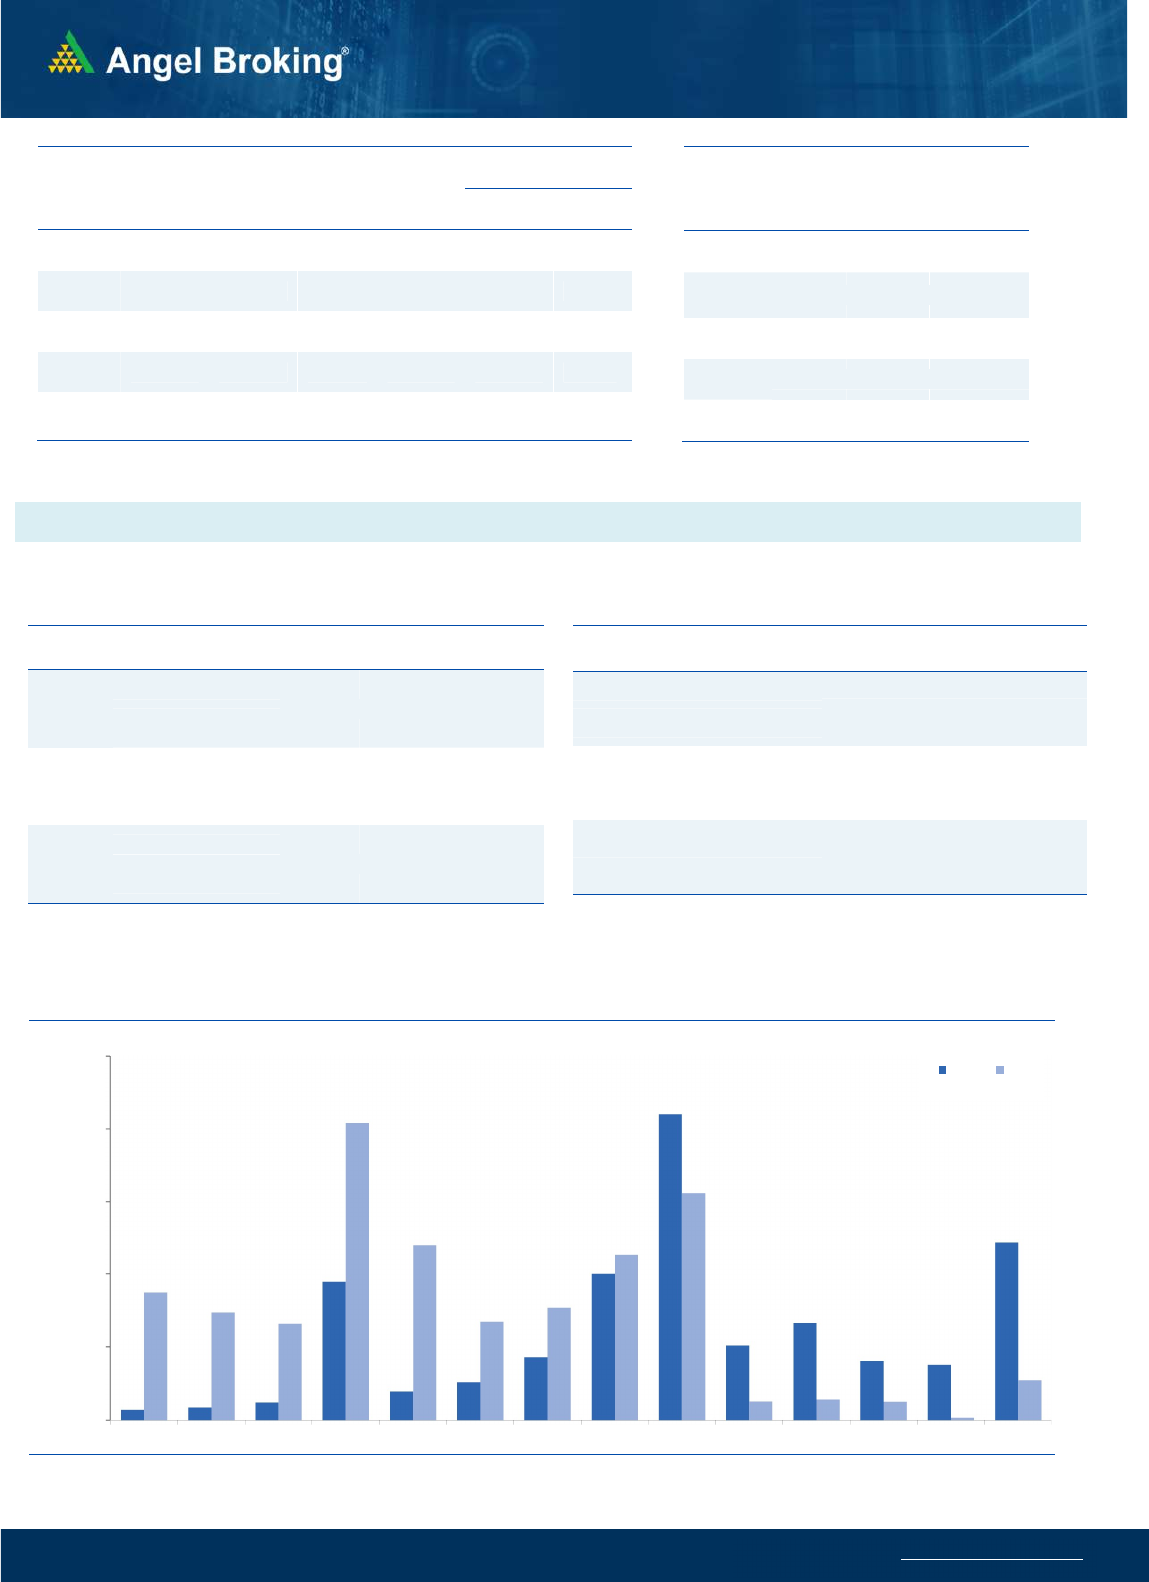
Nifty
Bank Out
look
-
(
31226)
On Friday, Bank Nifty started on a flat note and then remained
within a range throughout the sessions to eventually end flat with
marginal loss at 31226.
On the daily chart, the trading range has got coiled as the bank
index is trading within a very tight range of 31000 - 31500 and we
sense the next directional move can only be seen on a range
breakout from the mentioned levels. Inspite of range bound
moves in the bank index we witnessed a good stock specific move
within this space and on Friday the PSU banks were in a buzz.
Going ahead, one can continue with the stock specific trades as
they are likely to give opportunities on both sides of trend and
while doing so one should keep a tab on the above mentioned
range.
Key Levels
Support 1 – 31000 Resistance 1 – 31500
Support 2 – 30880 Resistance 2 – 31800
Exhibit 1: Nifty Daily Chart
Se
nsex
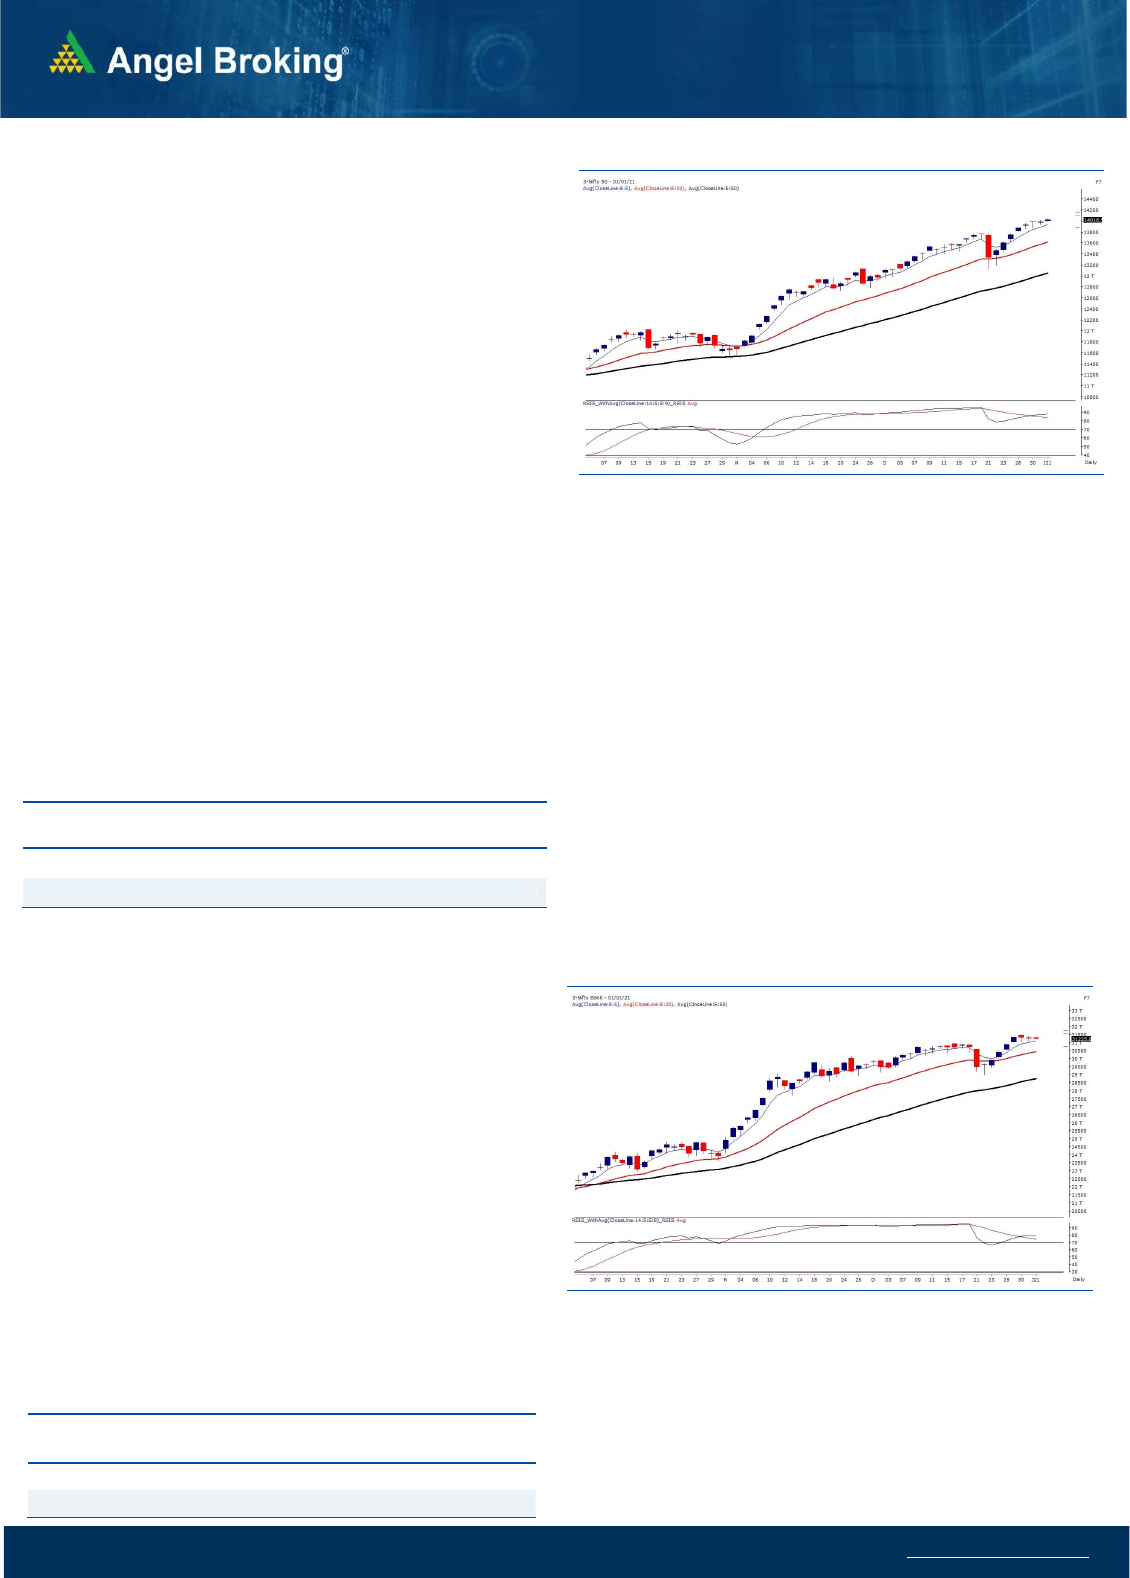
(
47869)
/ Nifty
(
14019
)
The mankind had to witness a lot of unprecedented things in the
year gone by. Initially it was very difficult to adjust with the forceful
changes in our lives; but we always try to make our own ways in all
the difficulties and this is exactly what has been proven all these
months. The year 2020 was full of shocks and surprises; but as we
always say “All’s well that ends well”. We not only stabilized from the
March chaos but also managed to give a stupendous v-shaped
recovery in the last nine months to even surpass pre-COVID highs
with some authority.
another couple of percent to Bulls’ kitty and importantly reached yet
another milestone of 14000. Now, there are lots of expectations built
as we step into the New Year. With a broader view, there is no
brainer, we are heading for much bigger levels from here on; but it
would be unfair to expect the similar kind of linear move that we
have been enjoying since early November. In between, markets are
likely to give some corrections, which would be a healthy sign. For
this week, we expect the Nifty to slowly and gradually head towards
14150-14200; whereas the key support zone is placed at 13950 -
13850 levels.
Key Levels
Support 1 – 13950 Resistance 1 – 14150
Support 2 – 13850 Resistance2 – 14200
During the last week, although there was some muted action seen
in key indices, the broader market just took off in the last couple of
days. Hence, the real action lies in the broader end of the spectrum,
which may continue to provide better trading opportunities. Traders
are advised to keep focusing on thematic bets and should ideally
avoid aggressive bets in indices.
Exhibit 2: Nifty Bank Daily Chart

www.angelbroking.com
Technical & Derivatives Report
January
04, 2021
Nifty Vs OI
12800
13000
13200
13400
13600
13800
14000
14200
,0
2,000
4,000
6,000
8,000
10,000
12,000
14,000
16,000
18,000
12/15 12/17 12/21 12/24 12/28 12/30 1/1
(`000)
Openinterest Nifty
View
Nifty achieved a milestone of 14000 during the last
week and ended comfortably above the same.
FIIs were net buyers in the cash segment to the tune of
Rs. 506 crore. In index future segment, they sold worth
265 crore with decrease in open interest indicating long
unwinding on Friday.
During expiry, the rollovers in Nifty were in line with its
average indicating long positions have been rolled over
bullish bets at the start of the new series with Long
Short ratio at 75 percent. The open interest data
indicates a support in the range of 14000-13900 for the
coming week while on the higher side, it could
approach 14200 mark. Hence, traders are advised to
trade with a positive bias and look for buying
opportunities on any declines.
C
o
mme
n
t
s
The Nifty futures open interest has increased by 3.36%
Bank Nifty futures open interest has increased by 1.62%
as market closed at 14018.50 levels.
The Nifty January future closed with a premium of 35.35
point against a premium of 27.9 point in last trading
session. The February series closed at a premium of 68
point.
The INDIA VIX decreased from 21.09 to 19.56.
At the same time, the PCR-OI of Nifty decreased from
1.52 to 1.37.
Few of the liquid counters where we have seen high cost
of carry are IDEA, BHEL,GRASIM, RAMCOCEM AND
TORNTPHARM.
OI Gainers
SCRIP OI
OI
CHG. (%)
PRICE
PRICE
CHG. (%)
PNB 98272000 171.77 34.80 4.95
L&TFH 23845900 19.31 97.00 4.18
BHEL 121695000 18.19 38.70 8.18
CHOLAFIN 5177500 17.67 411.35 5.91
CANBK 44895600 16.84 133.30 2.76
PVR 1691085 10.39 1340.40 0.53
ASHOKLEY 45801000 9.61 99.10 3.80
MGL 1393200 9.22 1059.95 0.02
OI Losers
SCRIP OI
OI
CHG. (%)
PRICE
PRICE
CHG. (%)
AMBUJACEM 18081000 -5.53 250.85 0.86
INDUSTOWER 9514400 -4.55 235.45 1.50
MFSL 6912100 -3.90 691.00 2.11
GLENMARK 5180750 -3.12 502.60 1.87
TORNTPOWER 3105000 -3.09 320.85 1.05
ACC 3248000 -3.00 1626.05 0.61
BALKRISIND 1821200 -2.57 1642.05 -0.16
CONCOR 10739373 -2.00 403.40 1.06
Put-Call Ratio
SCRIP PCR-OI PCR-VOL
NIFTY 1.37 1.03
BANKNIFTY 0.90 0.92
RELIANCE 0.60 0.44
ICICIBANK 0.62 0.65
INFY 0.62 0.44
Historical Volatility
SCRIP HV
VOLTAS 42.05
ZEEL 77.06
WIPRO 42.47
AARTIIND 50.99
HDFCAMC 46.34
www.angelbroking.com
Technical & Derivatives Report
January
04, 2021
Note: Above mentioned Bullish or Bearish Spreads in Nifty (January Series) are given as an information and not as a recommendation.
Nifty Spot =
14018.50
FII Statistics for January 01, 2020
Detail Buy
Net Contracts
Open Interest
Sell
Value
(in Cr.)
Change
INDEX
FUTURES
1344.31
1609.21
(264.90) 132805
13209.86
(2.05)
INDEX
OPTIONS
93792.23
92290.07
1502.16
591500
57491.48
38.31
STOCK
FUTURES
4305.37
3781.56
523.81
1172049
94481.93
0.24
STOCK
OPTIONS
3538.79
3844.63
(305.84) 68068
5333.31
63.30
Total 102980.70
101525.47
1455.23
1964422
170516.58
10.72
Turnover on January 01, 2020
Instrument
No. of
Contracts
Turnover
( in Cr. )
Change
(%)
Index Futures 1,61,954 14423.18 -66.67
Index
Options
97,91,136
8,69,996.76
-84.30
Stock
Futures
4,51,500 36719.34 -64.55
Stock
Options
7,39,614 61902.77 -34.54
Total
1,11,44,204
9,83,042.05
-83.00
Bull-Call Spreads
Action Strike Price Risk Reward BEP
Buy 14000 307.75
54.40 45.60 14054.40
Sell 14100 253.35
Buy 14000 307.75
101.05 98.95 14101.05
Sell 14200 206.70
Buy 14100 253.35
46.65 53.35 14146.65
Sell 14200 206.70
Bear-Put Spreads
Action Strike Price Risk Reward BEP
Buy 14000 254.45
37.05 62.95 13962.95
Sell 13900 217.40
Buy 14000 254.45
72.80 127.20 13927.20
Sell 13800 181.65
Buy 13900 217.40
35.75 64.25 13864.25
Sell 13800 181.65
Nifty Put-Call Analysis
,0
500,000
1000,000
1500,000
2000,000
2500,000
13200 13300 13400 13500 13600 13700 13800 13900 14000 14100 14200 14300 14400 14500
Call Put

www.angelbroking.com
Technical & Derivatives Report
January
04, 2021
Da
ily
Pivot Level
s for
Nifty Constituents
Scrips
S2
S1
PIVOT
R1
R2
ADANIPORTS
473
488
498
514
524
ASIANPAINT 2,731 2,753
2,773
2,795
2,815
AXISBANK
614
619
622
627
630
BAJAJ-AUTO 3,426 3,454
3,474
3,502
3,522
BAJFINANCE 5,201 5,241
5,289
5,329
5,377
BAJAJFINSV 8,771 8,821
8,890
8,939
9,008
BPCL
379
380
382
384
386
BHARTIARTL
505
510
513
518
521
BRITANNIA 3,537 3,552
3,579
3,594
3,621
CIPLA
817
822
825
830
834
COALINDIA
134
135
136
136
137
DIVISLAB 3,795 3,822
3,845
3,872
3,895
DRREDDY 5,177 5,209
5,232
5,264
5,287
EICHERMOT 2,499 2,521
2,538
2,560
2,577
GAIL
122
123
124
125
125
GRASIM
913
923
931
941
948
HCLTECH
936
943
949
957
963
HDFCBANK 1,407 1,416
1,430
1,439
1,452
HDFCLIFE
672
675
678
681
684
HDFC 2,516 2,542
2,568
2,594
2,620
HEROMOTOCO 3,078 3,090
3,105
3,118
3,133
HINDALCO
236
237
239
240
241
HINDUNILVR 2,369 2,378
2,391
2,400
2,413
ICICIBANK
519
523
530
534
541
IOC
91
91
91
92
92
INDUSINDBK
888
894
899
905
910
INFY 1,251 1,256
1,261
1,265
1,270
ITC
208
211
212
216
217
JSW STEEL
382
386
389
393
396
KOTAKBANK 1,980 1,987
1,998
2,004
2,015
LT 1,276 1,287
1,293
1,304
1,310
M&M
712
722
733
744
755
MARUTI 7,598 7,645
7,697
7,743
7,795
NESTLEIND 18,212
18,331
18,426
18,545
18,640
NTPC
98
99
99
100
101
ONGC
92
93
94
94
95
POWERGRID
188
189
189
190
191
RELIANCE 1,974 1,981
1,989
1,996
2,004
SBILIFE
886
891
899
904
912
SHREECEM 23,619
23,785
24,031
24,196
24,442
SBIN
272
276
278
281
284
SUNPHARMA
580
588
594
602
608
TCS 2,855 2,892
2,916
2,953
2,977
TATAMOTORS
184
185
186
188
189
TATASTEEL
635
639
644
649
654
TECHM
967
972
977
982
987
TITAN 1,545 1,552
1,563
1,569
1,580
ULTRACEMCO 5,237 5,264
5,306
5,333
5,376
UPL
461
465
471
475
481
WIPRO
382
385
388
391
394

www.angelbroking.com
Technical & Derivatives Report
January
04, 2021
*
Research Team Tel: 022 – 39357600 (Extn. 6844) Website: www.angelbroking.com
For Technical Queries E-mail: technicalresearch-cso@angelbroking.com
DISCLAIMER
Angel Broking Limited (hereinafter referred to as “Angel”) is a registered Member of National Stock Exchange of India Limited, Bombay
Stock Exchange Limited and Metropolitan Stock Exchange Limited. It is also registered as a Depository Participant with CDSL and
Portfolio Manager and Investment Adviser with SEBI. It also has registration with AMFI as a Mutual Fund Distributor. Angel Broking
Limited is a registered entity with SEBI for Research Analyst in terms of SEBI (Research Analyst) Regulations, 2014 vide registration
number INH000000164. Angel or its associates has not been debarred/ suspended by SEBI or any other regulatory authority for
accessing /dealing in securities Market. Angel or its associates/analyst has not received any compensation / managed or co-managed
public offering of securities of the company covered by Analyst during the past twelve months.
This document is solely for the personal information of the recipient, and must not be singularly used as the basis of any investment
decision. Nothing in this document should be construed as investment or financial advice. Each recipient of this document should make
such investigations as they deem necessary to arrive at an independent evaluation of an investment in the securities of the companies
referred to in this document (including the merits and risks involved), and should consult their own advisors to determine the merits
and risks of such an investment.
Reports based on technical and derivative analysis center on studying charts of a stock's price movement, outstanding positions and
trading volume, as opposed to focusing on a company's fundamentals and, as such, may not match with a report on a company's
fundamentals. Investors are advised to refer the Fundamental and Technical Research Reports available on our website to evaluate the
contrary view, if any.
The information in this document has been printed on the basis of publicly available information, internal data and other reliable
sources believed to be true, but we do not represent that it is accurate or complete and it should not be relied on as such, as this
document is for general guidance only. Angel Broking Limited or any of its affiliates/ group companies shall not be in any way
responsible for any loss or damage that may arise to any person from any inadvertent error in the information contained in this report.
Angel Broking Limited has not independently verified all the information contained within this document. Accordingly, we cannot
testify, nor make any representation or warranty, express or implied, to the accuracy, contents or data contained within this document.
While Angel Broking Limited endeavors to update on a reasonable basis the information discussed in this material, there may be
regulatory, compliance, or other reasons that prevent us from doing so.
This document is being supplied to you solely for your information, and its contents, information or data may not be reproduced,
redistributed or passed on, directly or indirectly.
Technical and Derivatives Team:
Sameet Chavan Chief Analyst - Technical & Derivatives sameet.chavan@angelbroking.com
Ruchit Jain Senior Analyst - Technical & Derivatives ruchit.jain@angelbroking.com
Rajesh Bhosale Technical Analyst rajesh.bhosle@angelbroking.com
Sneha Seth Derivatives Analyst sneha.seth@angelbroking.com
