www.angelbroking.com
Technical & Derivatives Report
September 03
, 2020
Nifty
Bank Out
look
-
(
23875
)
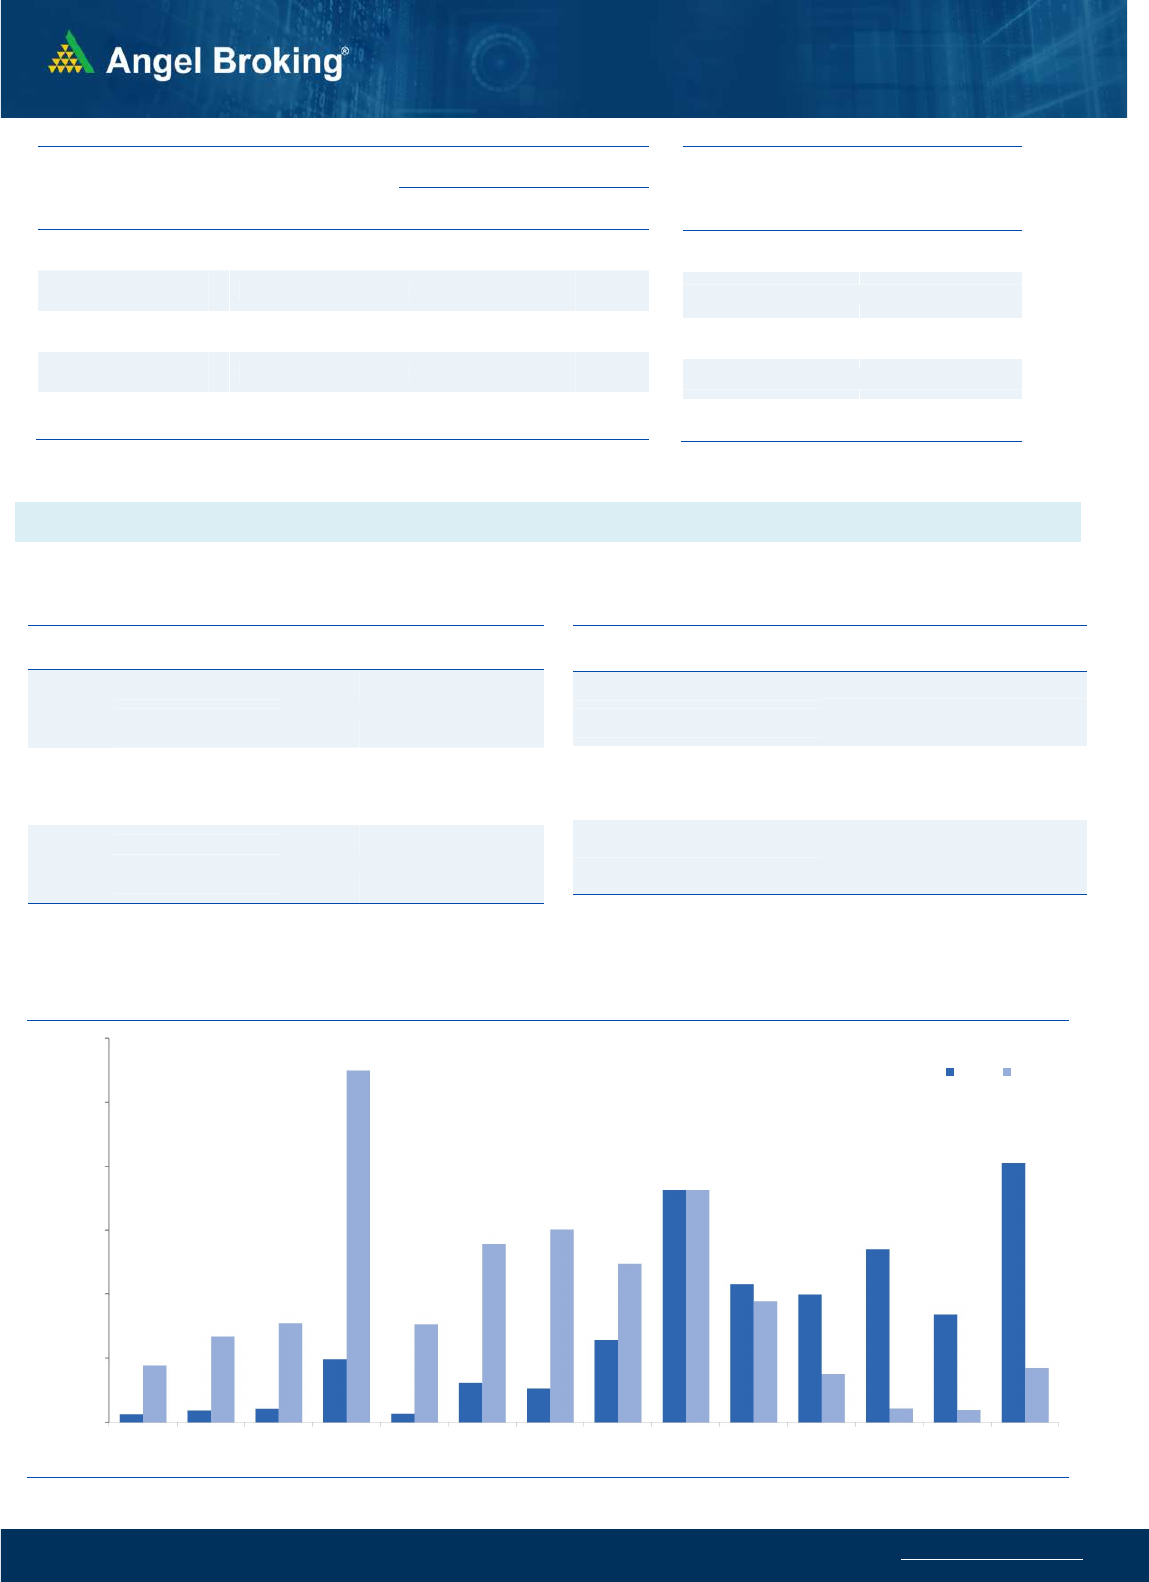
Bank Nifty as well started on a flat note and traded within a range
throughout the session. It eventually ended with marginal gains of
62 points at 23875. Post the sharp fall on Monday, the activity from
the last two sessions has been lethargic as we witnessed back to
back two neutral candles on the daily chart. It seems that market
is waiting for some trigger and as mentioned above it might be
the Supreme Court's verdict on moratorium. Having said that, the
bank index for the last three sessions has managed to hold the
previous breakout levels of July swing high around 23400 levels
and the said now becomes a sacrosanct point. A break below the
same may trigger resumption of Monday's fall towards 23000 and
beyond. On the flip side, if we manage to hold then a bounce may
be seen towards 24500 - 24750 levels. We reiterate, traders should
continue focus on individual stocks which are likely to give strong
trending moves.
Key Levels
Support 1 – 23400 Resistance 1 – 24350
Support 2 – 23000 Resistance 2 – 24500
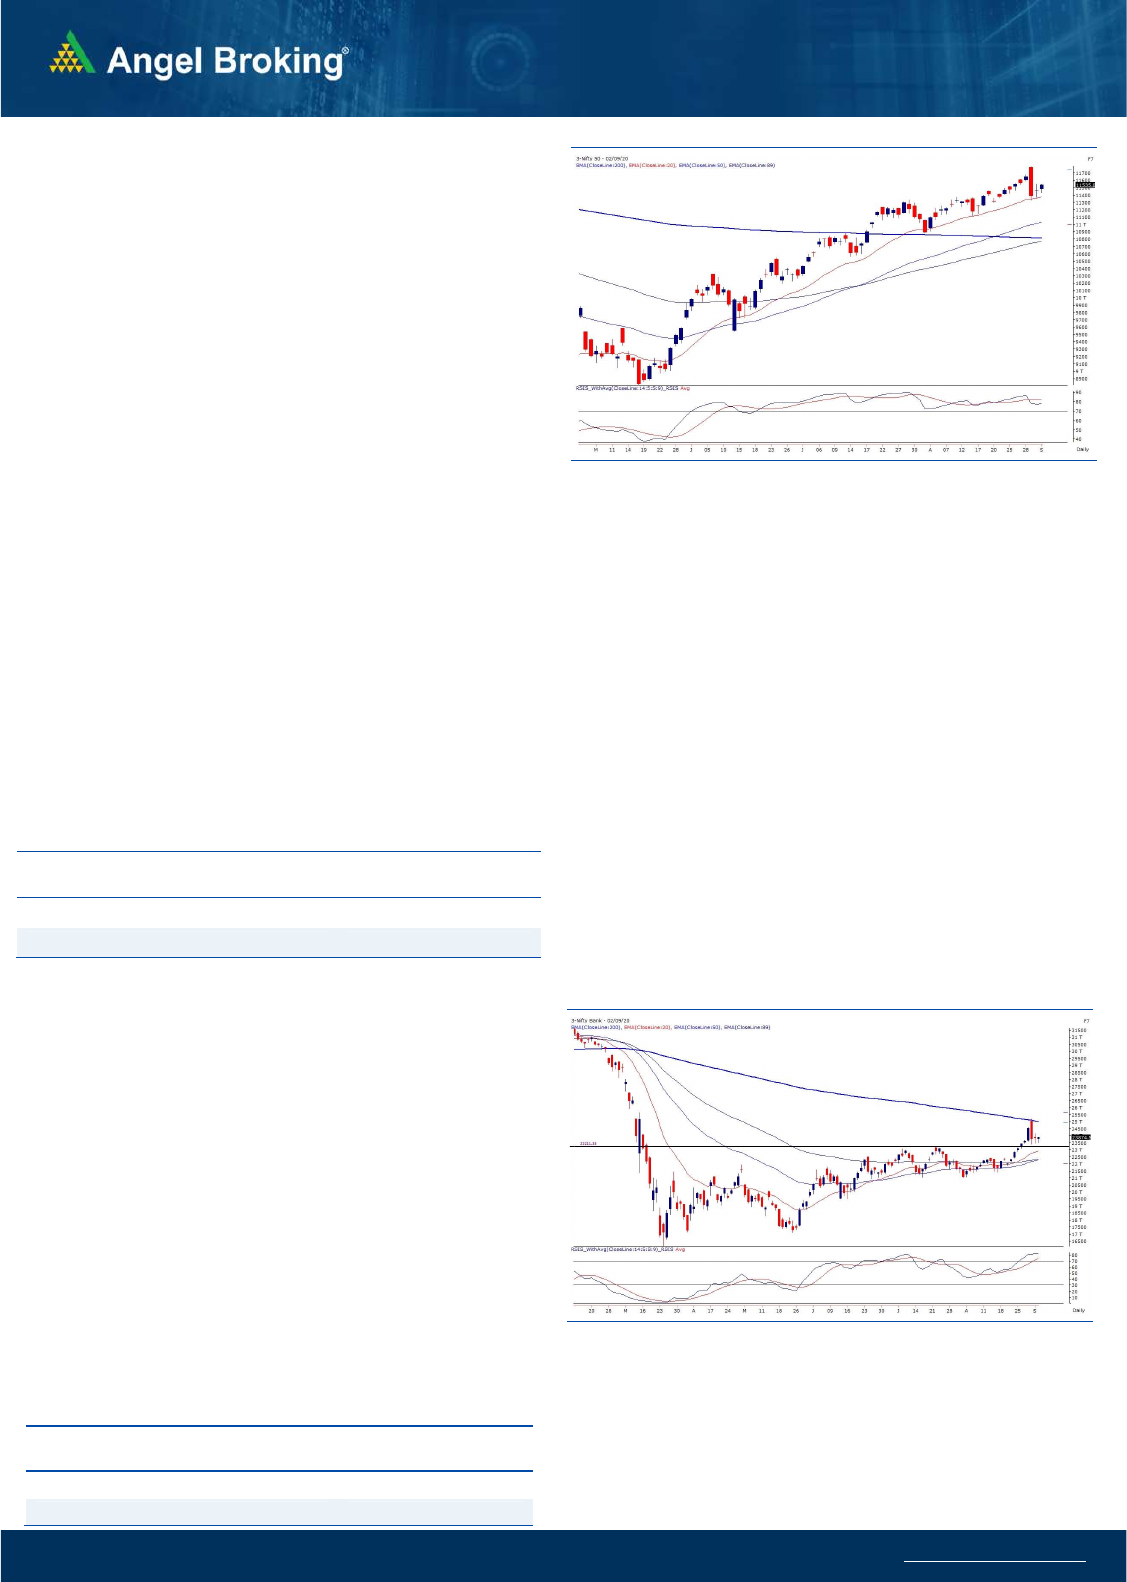
Exhibit 1: Nifty Daily Chart
Sensex (39086) / Nifty (11535)
We had a flat opening yesterday despite sluggish cues from the
global bourses. The index then slipped into a consolidation mode
and did nothing for the major part of the day. In last couple of hours,
some buying emerged in the broader markets as well as few index
heavyweights, which pushed the index comfortably above the
11500 mark.
After Monday’s brutal knock, the market seems to be in a wait and
watch mode. Some of the geopolitical concerns with respect to
India-China border are looming over. In addition, the Supreme
Court’s verdict on moratorium will be out anytime soon. All these
factors have created some uncertainty among the market
participants and this is clearly getting reflected in last two day’s price
action. Despite all this, stocks are not willing to give up, in fact some
of the counters have not only managed to recoup Monday’s loss but
also extended their up move. Going ahead, it would certainly be very
intriguing to see how things pan out in next couple of days.
Meanwhile, 11550 followed by 11650 are the levels to watch out for
in the upward direction; whereas on the flip side, 11450-11400-
11325 is the cluster of supports.
Traders are advised to keep following stock centric approach by
maintaining strict stop losses. Although the overall undertone is still
strongly bullish, it’s better to stay light till the time the uncertainty
disappears.
.Key Levels
Support 1 – 11450 Resistance 1 – 11600
Support 2 – 11400 Resistance 2 – 11650
Exhibit 2: Nifty Bank Daily Chart

www.angelbroking.com
Technical & Derivatives Report
September 03
, 2020
Nifty Vs OI
11100
11200
11300
11400
11500
11600
11700
,0
2,000
4,000
6,000
8,000
10,000
12,000
14,000
16,000
8/20 8/21 8/24 8/25 8/26 8/27 8/28 8/31 9/1 9/2
(`000)
Openinterest Nifty
View
s
The index consolidated within a narrow range for most
part of the session and ended the day around the high
point of the day.
FIIs were net buyers in the cash market segment to the
tune of Rs. 991 crores. In index futures, they sold worth
820 crores with decrease in open interest indicating
long unwinding and short formations in yesterday’s
session
.
FII's bought equities worth 991 crores whereas in index
index futures they unwound some of their longs and
formed marginal shorts. However, their overall
positions continue to be on the long side with their
'Long Short Ratio' at 60 percent.In options segment,
11500 call witnessed some unwinding of positions
whereas addition was seen in 11650-11700 calls. On
the flip side, 11500-11400 put options too saw open
interest addition indicating the support range for the
weekly expiry day. The index could trade within the
above mentioned range as indicated by the options
position, hence traders can look to buy at-the-money
call on dips in the range of 11500-11450.
C
o
mme
n
t
s
The Nifty futures open interest has increased by 4.26%
Bank Nifty futures open interest has decreased by 3.71%
as market closed at 11535 levels.
The Nifty September future closed with a premium of 26.5
point against a premium of 40.70 point in last trading
session. The October series closed at a premium of 43
point.
The INDIA VIX has decreased from 21.80 to 21.10.
At the same time, the PCR-OI of Nifty increased from 1.29
to 1.36.
Few of the liquid counters where we have seen high cost
of carry are GMRINFRA, TATACHEM, PNB, COFORGE,
AND HINDPETRO.
OI Gainers
SCRIP OI
OI
CHG. (%)
PRICE
PRICE
CHG. (%)
ESCORTS 3526600 33.42 1223.55 9.95
HEROMOTOCO 2386800 25.83 2943.60 -1.70
VOLTAS 2319000 13.34 642.50 1.26
PNB 61768000 12.49 34.80 0.29
MUTHOOTFIN 2922750 12.44 1147.35 -1.04
SAIL 44023000 9.55 41.60 3.47
EXIDEIND 10720800 8.81 166.60 0.93
TORNTPOWER 2013000 8.40 340.90 0.40
OI Losers
SCRIP OI
OI
CHG. (%)
PRICE
PRICE
CHG. (%)
TORNTPHARM 1463500 -11.65 2761.80 1.61
SRF 567500 -6.55 4218.30 2.12
BOSCHLTD 88350 -6.41 12952.60 4.53
COLPAL 2861600 -4.02 1391.35 0.50
APOLLOHOSP 867500 -3.82 1698.60 1.15
CHOLAFIN 5710000 -3.75 242.70 0.69
IDFCFIRSTB 136154000 -3.41 31.75 1.12
PAGEIND 124590 -3.13 19689.10 2.66
Put-Call Ratio
SCRIP PCR-OI PCR-VOL
NIFTY 1.36 0.91
BANKNIFTY 0.82 0.83
RELIANCE 0.61 0.40
ICICIBANK 0.51 0.57
INFY 0.49 0.35
Historical Volatility
SCRIP HV
UBL 44.40
ESCORTS 64.40
M&M 51.90
ZEEL 87.49
JUBLFOOD 53.22
www.angelbroking.com
Technical & Derivatives Report
September 03
, 2020
Note: Above mentioned Bullish or Bearish Spreads in Nifty (September Series) are given as an information and not as a recommendation.
Nifty Spot =
11535
FII Statistics for September 02, 2020
Detail Buy
Sell Net
Open Interest
Contracts
Value
(in Cr.)
Change
(%)
INDEX
FUTURES
3847.58
4667.16
(819.58) 131195
10770.68
(2.50)
INDEX
OPTIONS
289412.04
290522.84
(1110.80) 769524
59855.46
2.42
STOCK
FUTURES
13724.39
14332.33
(607.94) 1214299
87639.81
0.56
STOCK
OPTIONS
4560.87
4552.89
7.98
74684
5336.75
10.58
Total 311544.88
314075.22
(2530.34) 2189702
163602.70
1.33
Turnover on September 02, 2020
Instrument
No. of
Contracts
Turnover
( in Cr. )
Change
(%)
Index Futures 4,31,876 29380.41 -32.81
Index Options
2,64,81,209
18,50,942.53
2.83
Stock Futures 7,41,488 56350.95 -17.51
Stock Options
9,25,694 74725.72 8578.35
Total 2,85,80,267
20,11,399.61
0.66
Bull-Call Spreads
Action Strike Price Risk Reward BEP
Buy 11500 250.35
56.50 43.50 11556.50
Sell 11600 193.85
Buy 11500 250.35
104.55 95.45 11604.55
Sell 11700 145.80
Buy 11600 193.85
48.05 51.95 11648.05
Sell 11700 145.80
Bear-Put Spreads
Action Strike Price Risk Reward BEP
Buy 11500 189.40
35.15 64.85 11464.85
Sell 11400 154.25
Buy 11500 189.40
65.25 134.75 11434.75
Sell 11300 124.15
Buy 11400 154.25
30.10 69.90 11369.90
Sell 11300 124.15
Nifty Put-Call Analysis
,0
500,000
1000,000
1500,000
2000,000
2500,000
3000,000
10700 10800 10900 11000 11100 11200 11300 11400 11500 11600 11700 11800 11900 12000
Call Put

www.angelbroking.com
Technical & Derivatives Report
September 03
, 2020
Daily Pivot Levels for Nifty Constituents
Scrips
S2
S1
PIVOT
R1
R2
ADANIPORTS
336
348
356
368
375
ASIANPAINT 1,883 1,914
1,955
1,986
2,027
AXISBANK
466
475
481
491
497
BAJAJ-AUTO 2,776 2,829
2,899
2,951
3,022
BAJFINANCE 3,534 3,601
3,641
3,708
3,747
BAJAJFINSV 6,185 6,275
6,345
6,435
6,505
BPCL
403
408
412
418
421
BHARTIARTL
538
544
552
558
565
INFRATEL
189
192
195
199
202
BRITANNIA 3,727 3,763
3,788
3,825
3,850
CIPLA
719
729
739
748
758
COALINDIA
133
135
136
138
139
DRREDDY 4,275 4,314
4,356
4,395
4,436
EICHERMOT 2,067 2,118
2,153
2,205
2,239
GAIL
95
96
97
98
99
GRASIM
652
665
676
689
699
HCLTECH
683
692
699
708
714
HDFCBANK 1,113 1,124
1,131
1,142
1,150
HDFC
569
575
583
588
596
HEROMOTOCO
1,789
1,808
1,829
1,848
1,869
HINDALCO 2,790 2,867
2,953
3,030
3,117
HINDUNILVR
191
194
195
198
200
ICICIBANK 2,106 2,124
2,154
2,172
2,203
IOC
376
384
389
397
402
INDUSINDBK
84
85
85
86
86
INFY
598
619
635
656
672
ITC
908
916
921
929
934
JSW STEEL
188
190
191
193
195
KOTAKBANK
282
287
291
296
300
LT 1,392 1,408
1,423
1,438
1,453
M&M
943
949
954
961
966
MARUTI
586
615
630
658
674
NESTLEIND 6,790 6,855
6,918
6,983
7,045
NTPC 15,784
15,888
16,074
16,178
16,364
ONGC
97
98
99
100
101
POWERGRID
78
79
81
82
83
RELIANCE
172
177
180
184
188
SHREECEM 2,064 2,096
2,117
2,149
2,170
SBIN 20,289
20,426
20,587
20,725
20,886
SUNPHARMA
209
213
216
219
223
TCS
500
507
516
524
533
TATAMOTORS 2,231 2,248
2,259
2,275
2,286
TATASTEEL
138
144
148
154
158
TECHM
421
430
436
445
450
TITAN
719
727
736
745
754
ULTRACEMCO 1,094 1,108
1,116
1,130
1,138
UPL 3,811 3,877
3,961
4,026
4,111
VEDANTA
487
494
500
507
513
WIPRO
269
271
274
276
279
ZEEL
195
207
214
225
233

www.angelbroking.com
Technical & Derivatives Report
September 03
, 2020
*
Research Team Tel: 022 – 39357600 (Extn. 6844) Website: www.angelbroking.com
For Technical & Derivatives Queries E-mail: technicalresearch-cso@angelbroking.com
DISCLAIMER
Angel Broking Limited (hereinafter referred to as “Angel”) is a registered Member of National Stock Exchange of India Limited, Bombay
Stock Exchange Limited and Metropolitan Stock Exchange Limited. It is also registered as a Depository Participant with CDSL and
Portfolio Manager and Investment Adviser with SEBI. It also has registration with AMFI as a Mutual Fund Distributor. Angel Broking
Limited is a registered entity with SEBI for Research Analyst in terms of SEBI (Research Analyst) Regulations, 2014 vide registration
number INH000000164. Angel or its associates has not been debarred/ suspended by SEBI or any other regulatory authority for
accessing /dealing in securities Market. Angel or its associates/analyst has not received any compensation / managed or co-managed
public offering of securities of the company covered by Analyst during the past twelve months.
This document is solely for the personal information of the recipient, and must not be singularly used as the basis of any investment
decision. Nothing in this document should be construed as investment or financial advice. Each recipient of this document should make
such investigations as they deem necessary to arrive at an independent evaluation of an investment in the securities of the companies
referred to in this document (including the merits and risks involved), and should consult their own advisors to determine the merits
and risks of such an investment.
Reports based on technical and derivative analysis center on studying charts of a stock's price movement, outstanding positions and
trading volume, as opposed to focusing on a company's fundamentals and, as such, may not match with a report on a company's
fundamentals. Investors are advised to refer the Fundamental and Technical Research Reports available on our website to evaluate the
contrary view, if any.
The information in this document has been printed on the basis of publicly available information, internal data and other reliable
sources believed to be true, but we do not represent that it is accurate or complete and it should not be relied on as such, as this
document is for general guidance only. Angel Broking Limited or any of its affiliates/ group companies shall not be in any way
responsible for any loss or damage that may arise to any person from any inadvertent error in the information contained in this report.
Angel Broking Limited has not independently verified all the information contained within this document. Accordingly, we cannot
testify, nor make any representation or warranty, express or implied, to the accuracy, contents or data contained within this document.
While Angel Broking Limited endeavors to update on a reasonable basis the information discussed in this material, there may be
regulatory, compliance, or other reasons that prevent us from doing so.
This document is being supplied to you solely for your information, and its contents, information or data may not be reproduced,
redistributed or passed on, directly or indirectly.
Technical and Derivatives Team:
Sameet Chavan Chief Analyst - Technical & Derivatives sameet.chavan@angelbroking.com
Ruchit Jain Senior Analyst - Technical & Derivatives ruchit.jain@angelbroking.com
Rajesh Bhosale Technical Analyst rajesh.bhosle@angelbroking.com
Sneha Seth Derivatives Analyst sneha.seth@angelbroking.com
