www.angelbroking.com
Technical & Derivatives Report
September 02, 2020
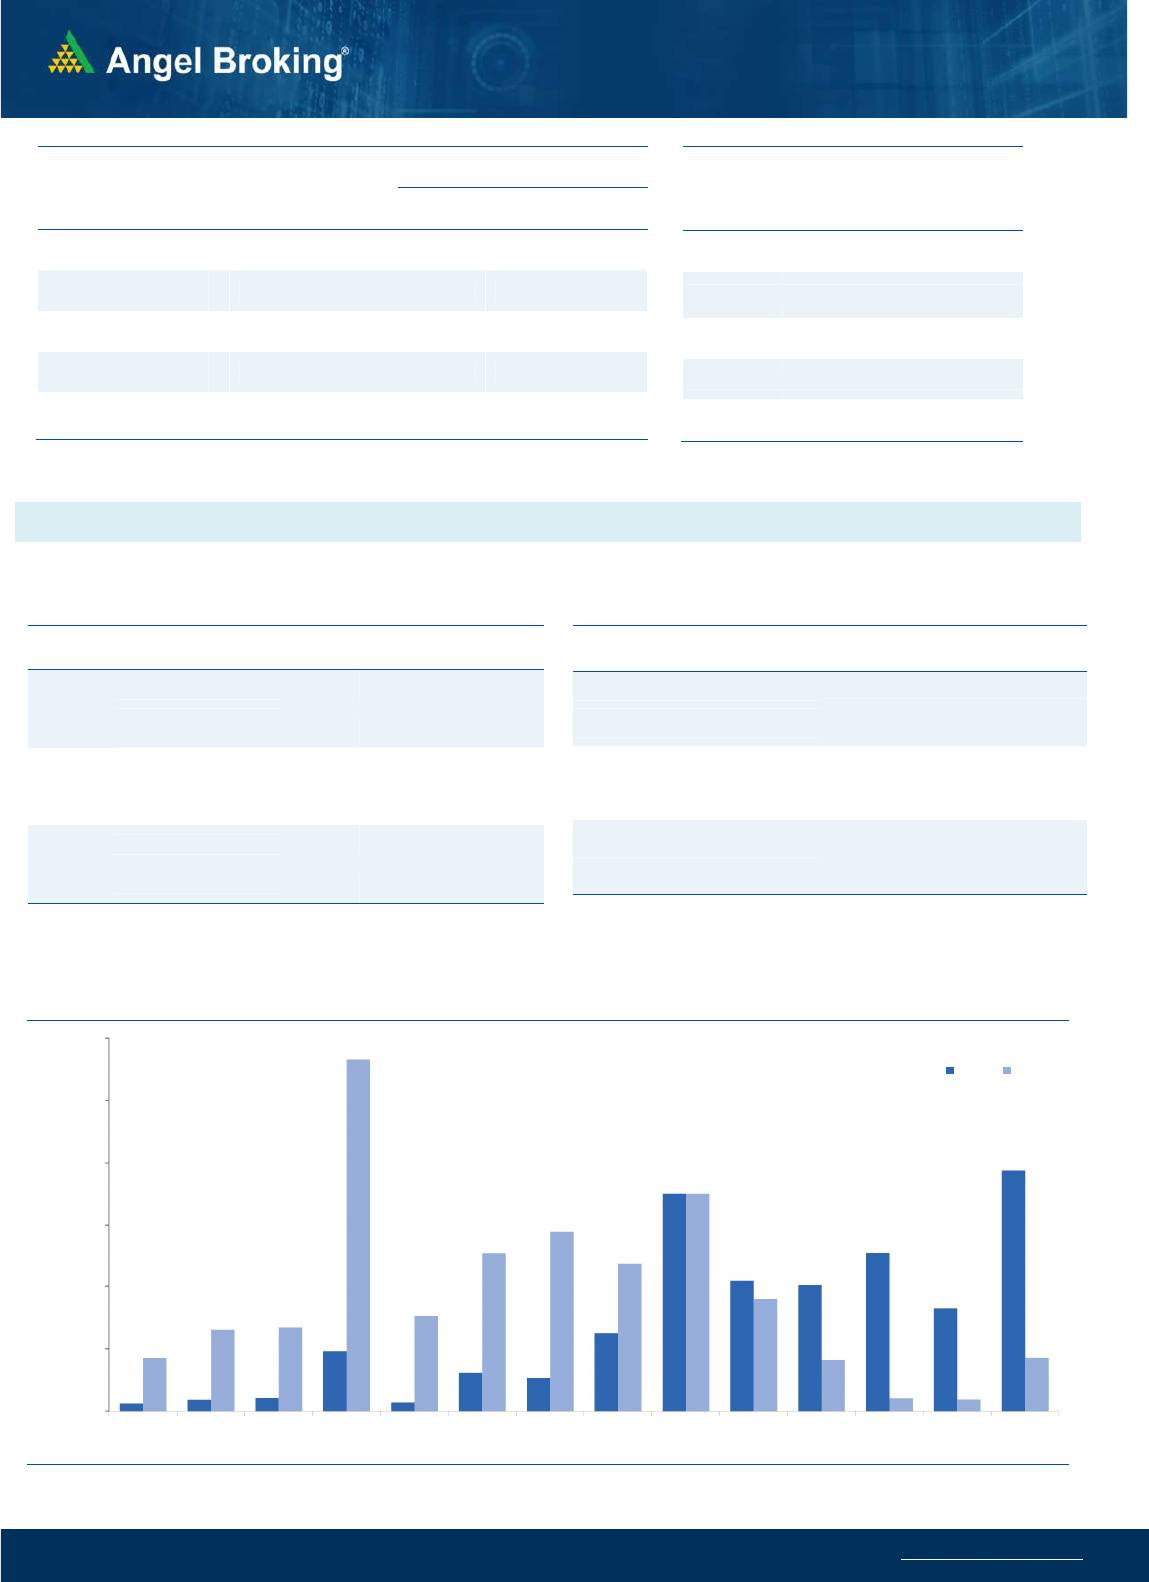
Nifty Bank Outlook - (23812)
Bank Nifty as well started on a positive note and after trading
volatile within a range ended with gains of 0.24% at 23812.
On Monday, the bank index formed a bearish reversal pattern
known as 'Dark Cloud Cover' on the resistance of 200SMA. The low
of the pattern, however, got defended yesterday at 23385 which
coincides around the previous breakout level (July Swing High) and
formed an indecisive pattern known as 'DOJI'. Going ahead, as
long the low of 'Dark cloud cover' at 23385 holds there are hopes
for bulls for some recovery. Having said that 25000 has now
become a daunting task to break and we may see supply on any
attempt to bounce back in the near term. We sense the bank index
may consolidate in a range 23385 - 24500 for the next few
sessions and within the same opportunities can be seen on both
sides of the trend.
Key Levels
Support 1 – 23385 Resistance 1 – 24125
Support 2 – 23200 Resistance 2 – 24500
Exhibit 1: Nifty Daily Chart
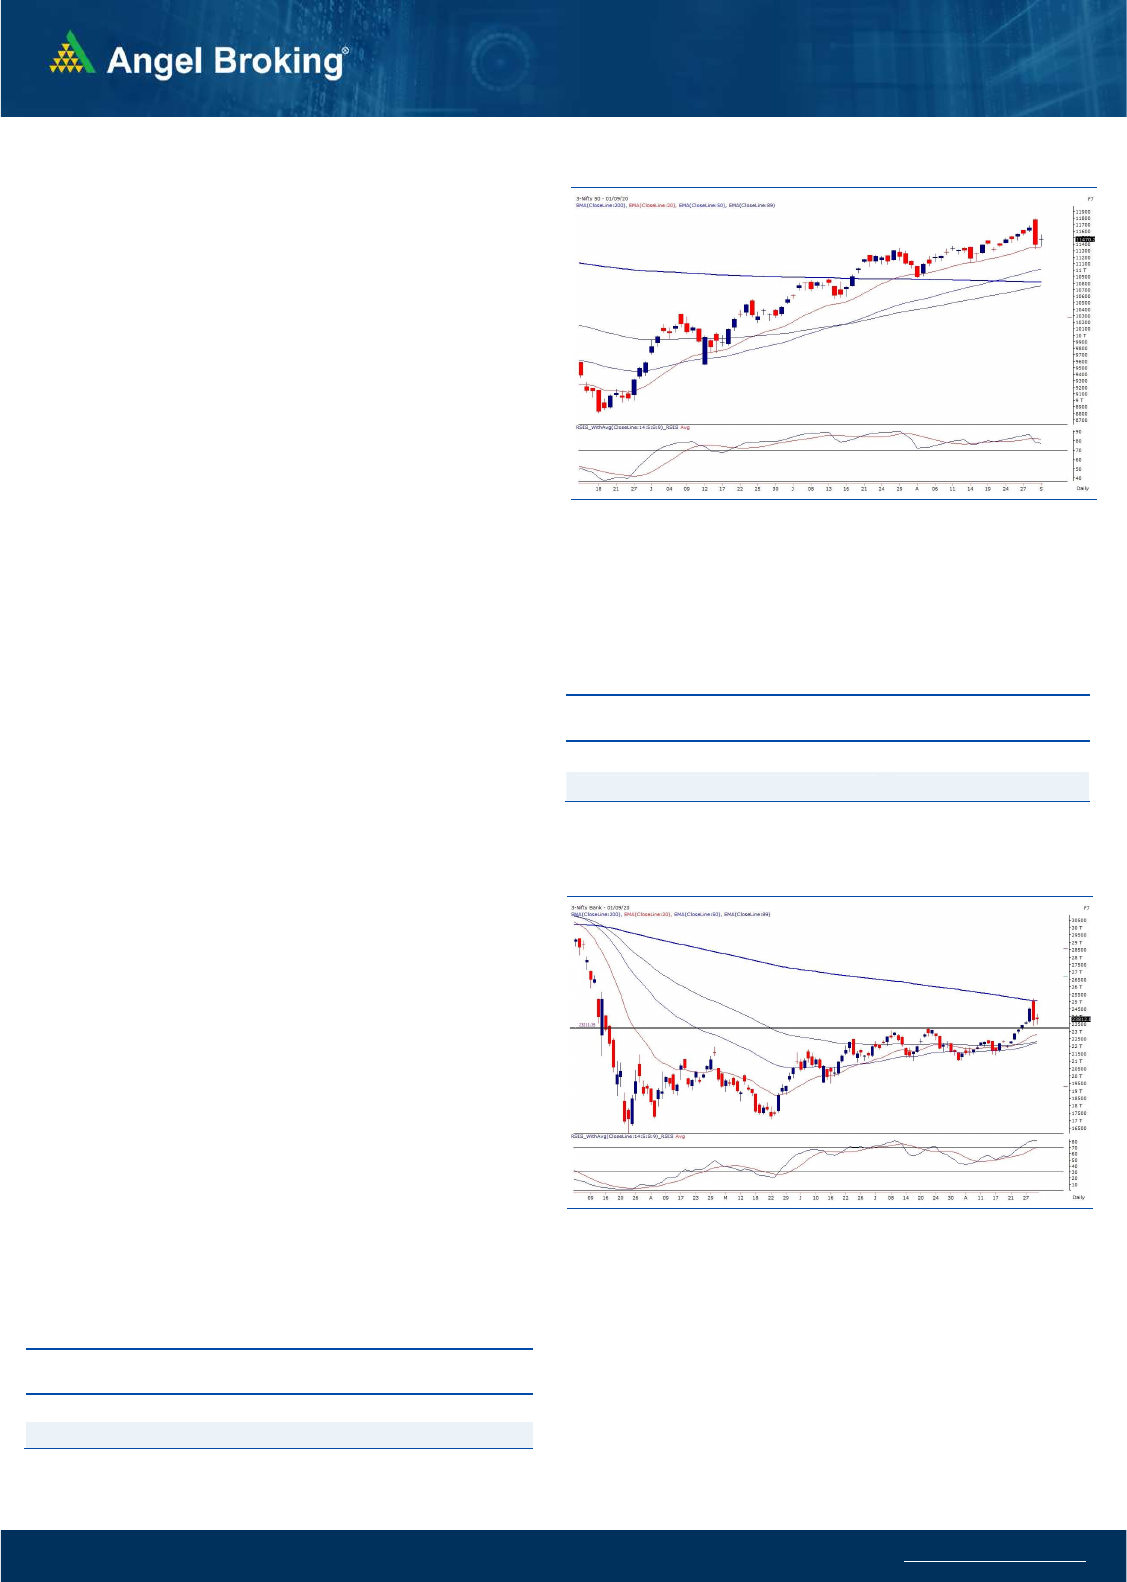
Sensex (38901) / Nifty (11470)
After Monday's sell off, our markets opened higher as the global
rally is still on and yesterday morning. DOW future was trading firmly
in the green. Post the positive start, our markets saw few volatile
swings during the day; but when it comes to the individual stocks,
we witnessed smart recovery in a number of counters. Eventually,
the index ended the session with nearly a percent gain.
Monday's sharp fall might have shaken so many market participants
and it has certainly applied brakes on the recent euphoria.
Fortunately for us, there was no follow through selling seen
yesterday and the Nifty successfully managed to defend the crucial
support of 11325. Since, Monday's correction is the profit
booking move of a strong Bull Run, markets have still not
distorted their structure. So, as long as 11325 is defended, the
momentum traders would still have some hopes of a recovery. If any
weakness has to trigger, it will happen only after breaking this crucial
point. However on the higher side, we do not expect Nifty
surpassing Monday's high soon. Meanwhile, it would be a daunting
task for the Nifty to surpass the sturdy wall of 11550-11650. Let see
how things pan out in the next couple of days, which would possibly
give some idea of the next path of action.
Exhibit 2: Nifty Bank Daily Chart
Going ahead, we continue to advocate some caution and one should
avoid aggressive bets, considering the rise in volatility, Till the time
we are stuck in a range of 11325 - 11650, we are likely to get trades
on both sides and hence, swings traders can capitalise on such
higher volatile moves.
.Key Levels
Support 1 – 11400 Resistance 1 – 11550
Support 2 – 11325 Resistance 2 – 11600

www.angelbroking.com
Technical & Derivatives Report
September 02, 2020
Nifty Vs OI
11100
11200
11300
11400
11500
11600
11700
,0
2,000
4,000
6,000
8,000
10,000
12,000
14,000
16,000
8/20 8/21 8/24 8/25 8/26 8/27 8/28 8/31 9/1
(`000)
Openinterest Nifty
View
s
Post the previous session's sharp sell-off, Nifty
recovered marginally in yesterday's session and ended
the day with gains of about three-fourths of a percent.
FIIs were net buyers in the cash market segment to the
tune of Rs. 486 crores. In index futures, they bought
worth 1035 crores with decrease in open interest
indicating short covering and long formations in
yesterday’s session
.
For the second session we witnessed unwinding of
positions in Nifty as open interest declined by another
9 percent yesterday. However, the recent long positions
formed in Bank Nifty still seem to be intact as we have
not seen any unwinding in the banking index. While FII's
formed short positions on Monday, they covered some
of their shorts and formed some longs in index futures
yesterday. In options segment, 11500 call option added
some open interest whereas some open interest
addition was also seen in put options of 11500 and
below strikes. For the near term, traders are advised to
trade with a stock specific approach and look for
opportunities on both sides of trade.
C
o
mme
n
t
s
The Nifty futures open interest has decreased by 8.94%
Bank Nifty futures open interest has increased by 1.90%
as market closed at 11470.25 levels.
The Nifty September future closed with a premium of
40.70 point against a premium of 14.45 point in last
trading session. The October series closed at a premium
of 55.3 point.
The INDIA VIX has decreased from 22.83 to 21.80.
At the same time, the PCR-OI of Nifty increased from 1.17
to 1.29.
Few of the liquid counters where we have seen high cost
of carry are GMRINFRA, TATACHEM, SAIL, UPL AND
HDFCLIFE.
OI Gainers
SCRIP OI
OI
CHG. (%)
PRICE
PRICE
CHG. (%)
MGL 2132400 38.23 905.90 -4.74
ASHOKLEY 31689000 16.47 68.80 1.54
JINDALSTEL 24935000 16.25 218.00 6.59
MFSL 1933100 14.30 603.25 2.93
VOLTAS 2046000 14.05 635.00 0.08
IDFCFIRSTB 140961000 13.23 31.40 -1.57
PVR 1511598 10.31 1402.80 5.26
IOC 57815100 8.81 84.65 -1.45
OI Losers
SCRIP OI
OI
CHG. (%)
PRICE
PRICE
CHG. (%)
TORNTPOWER 1857000 -17.90 340.85 2.03
IDEA 380100000 -17.23 8.85 -13.73
BOSCHLTD 94400 -14.53 12392.95 -3.65
ITC 95148800 -9.48 190.20 -0.50
INFRATEL 14476000 -8.61 188.80 -5.28
BAJFINANCE 4974250 -8.44 3643.85 4.50
APOLLOHOSP 902000 -8.05 1670.80 2.22
SRTRANSFIN 4481573 -7.62 706.30 0.67
Put-Call Ratio
SCRIP PCR-OI PCR-VOL
NIFTY 1.29 0.88
BANKNIFTY 0.78 0.89
RELIANCE 0.59 0.48
ICICIBANK 0.56 0.52
INFY 0.50 0.41
Historical Volatility
SCRIP HV
BHARTIARTL 48.69
BIOCON 69.17
PVR 64.68
IDEA 139.40
MGL 48.64
www.angelbroking.com
Technical & Derivatives Report
September 02, 2020
Note: Above mentioned Bullish or Bearish Spreads in Nifty (September Series) are given as an information and not as a recommendation.
Nifty Spot =
11470.25
FII Statistics for September 01, 2020
Detail Buy
Sell Net
Open Interest
Contracts
Value
(in Cr.)
Change
(%)
INDEX
FUTURES
7601.49
6566.22
1035.27
134560
10898.30
(3.37)
INDEX
OPTIONS
323049.99
322389.87
660.12
751329
59137.10
2.29
STOCK
FUTURES
18363.65
18547.51
(183.86) 1207516
86552.02
(0.25)
STOCK
OPTIONS
5984.10
6166.03
(181.93) 67537
4798.31
10.66
Total 354999.23
353669.63
1329.60
2160942
161385.73
0.73
Turnover on September 01, 2020
Instrument
No. of
Contracts
Turnover
( in Cr. )
Change
(%)
Index Futures 6,33,649 43730.41 -26.25
Index Options
2,53,79,798
18,00,019.00
-14.07
Stock Futures 9,29,906 68311.05 -22.36
Stock Options
10,93,890
86105.90 -19.01
Total 2,80,37,243
19,98,166.36
-14.91
Bull-Call Spreads
Action Strike Price Risk Reward BEP
Buy 11500 234.45
52.75 47.25 11552.75
Sell 11600 181.70
Buy 11500 234.45
97.00 103.00 11597.00
Sell 11700 137.45
Buy 11600 181.70
44.25 55.75 11644.25
Sell 11700 137.45
Bear-Put Spreads
Action Strike Price Risk Reward BEP
Buy 11500 220.45
38.35 61.65 11461.65
Sell 11400 182.10
Buy 11500 220.45
73.55 126.45 11426.45
Sell 11300 146.90
Buy 11400 182.10
35.20 64.80 11364.80
Sell 11300 146.90
Nifty Put-Call Analysis
,0
500,000
1000,000
1500,000
2000,000
2500,000
3000,000
10700 10800 10900 11000 11100 11200 11300 11400 11500 11600 11700 11800 11900 12000
Call Put

www.angelbroking.com
Technical & Derivatives Report
September 02, 2020
Daily Pivot Levels for Nifty Constituents
Scrips
S2
S1
PIVOT
R1
R2
ADANIPORTS
328
338
352
362
376
ASIANPAINT 1,878 1,929
1,958
2,009
2,039
AXISBANK
466
476
490
500
513
BAJAJ-AUTO 2,890 2,924
2,964
2,998
3,038
BAJFINANCE 3,432 3,538
3,606
3,712
3,780
BAJAJFINSV 6,051 6,205
6,301
6,455
6,551
BPCL
395
401
407
413
418
BHARTIARTL
497
522
539
563
580
INFRATEL
162
175
192
206
222
BRITANNIA 3,690 3,730
3,759
3,800
3,828
CIPLA
698
717
729
748
760
COALINDIA
128
131
133
136
138
DRREDDY 4,176 4,264
4,320
4,408
4,464
EICHERMOT 2,069 2,100
2,137
2,168
2,205
GAIL
93
95
96
98
99
GRASIM
626
655
680
709
734
HCLTECH
670
680
692
702
714
HDFCBANK 1,091 1,109
1,126
1,145
1,162
HDFC
563
571
579
587
594
HEROMOTOCO
1,804
1,827
1,856
1,880
1,908
HINDALCO 2,916 2,956
3,015
3,055
3,114
HINDUNILVR
181
188
192
198
202
ICICIBANK 2,086 2,124
2,149
2,187
2,213
IOC
378
384
392
399
406
INDUSINDBK
82
83
85
86
88
INFY
552
590
626
664
700
ITC
898
906
920
929
943
JSW STEEL
186
188
190
192
194
KOTAKBANK
262
274
281
294
301
LT 1,364 1,397
1,420
1,453
1,475
M&M
932
944
955
966
978
MARUTI
595
601
611
618
628
NESTLEIND 6,692 6,799
6,909
7,016
7,125
NTPC 15,549
15,873
16,064
16,388
16,579
ONGC
95
97
99
102
104
POWERGRID
75
77
80
82
85
RELIANCE
177
179
180
182
184
SHREECEM 2,031 2,059
2,091
2,119
2,151
SBIN 19,722
20,094
20,347
20,719
20,972
SUNPHARMA
208
213
216
221
224
TCS
497
509
518
531
540
TATAMOTORS 2,219 2,232
2,255
2,269
2,292
TATASTEEL
138
141
143
146
148
TECHM
404
416
424
437
445
TITAN
704
716
734
746
764
ULTRACEMCO 1,081 1,101
1,115
1,135
1,149
UPL 3,794 3,853
3,911
3,970
4,028
VEDANTA
483
494
502
513
521
WIPRO
263
267
273
278
284
ZEEL
191
196
202
207
213

www.angelbroking.com
Technical & Derivatives Report
September 02, 2020
*
Research Team Tel: 022 – 39357600 (Extn. 6844) Website: www.angelbroking.com
For Technical & Derivatives Queries E-mail: technic[email protected]
DISCLAIMER
Angel Broking Limited (hereinafter referred to as “Angel”) is a registered Member of National Stock Exchange of India Limited, Bombay
Stock Exchange Limited and Metropolitan Stock Exchange Limited. It is also registered as a Depository Participant with CDSL and
Portfolio Manager and Investment Adviser with SEBI. It also has registration with AMFI as a Mutual Fund Distributor. Angel Broking
Limited is a registered entity with SEBI for Research Analyst in terms of SEBI (Research Analyst) Regulations, 2014 vide registration
number INH000000164. Angel or its associates has not been debarred/ suspended by SEBI or any other regulatory authority for
accessing /dealing in securities Market. Angel or its associates/analyst has not received any compensation / managed or co-managed
public offering of securities of the company covered by Analyst during the past twelve months.
This document is solely for the personal information of the recipient, and must not be singularly used as the basis of any investment
decision. Nothing in this document should be construed as investment or financial advice. Each recipient of this document should make
such investigations as they deem necessary to arrive at an independent evaluation of an investment in the securities of the companies
referred to in this document (including the merits and risks involved), and should consult their own advisors to determine the merits
and risks of such an investment.
Reports based on technical and derivative analysis center on studying charts of a stock's price movement, outstanding positions and
trading volume, as opposed to focusing on a company's fundamentals and, as such, may not match with a report on a company's
fundamentals. Investors are advised to refer the Fundamental and Technical Research Reports available on our website to evaluate the
contrary view, if any.
The information in this document has been printed on the basis of publicly available information, internal data and other reliable
sources believed to be true, but we do not represent that it is accurate or complete and it should not be relied on as such, as this
document is for general guidance only. Angel Broking Limited or any of its affiliates/ group companies shall not be in any way
responsible for any loss or damage that may arise to any person from any inadvertent error in the information contained in this report.
Angel Broking Limited has not independently verified all the information contained within this document. Accordingly, we cannot
testify, nor make any representation or warranty, express or implied, to the accuracy, contents or data contained within this document.
While Angel Broking Limited endeavors to update on a reasonable basis the information discussed in this material, there may be
regulatory, compliance, or other reasons that prevent us from doing so.
This document is being supplied to you solely for your information, and its contents, information or data may not be reproduced,
redistributed or passed on, directly or indirectly.
Technical and Derivatives Team:
Sameet Chavan Chief Analyst - Technical & Derivatives sameet.chavan@angelbroking.com
Ruchit Jain Senior Analyst - Technical & Derivatives ruchit.jain@angelbroking.com
Rajesh Bhosale Technical Analyst rajesh.bhosle@angelbroking.com
Sneha Seth Derivatives Analyst sneha.seth@angelbroking.com
