www.angelbroking.com
June 02
, 2021
Technical & Derivatives Report
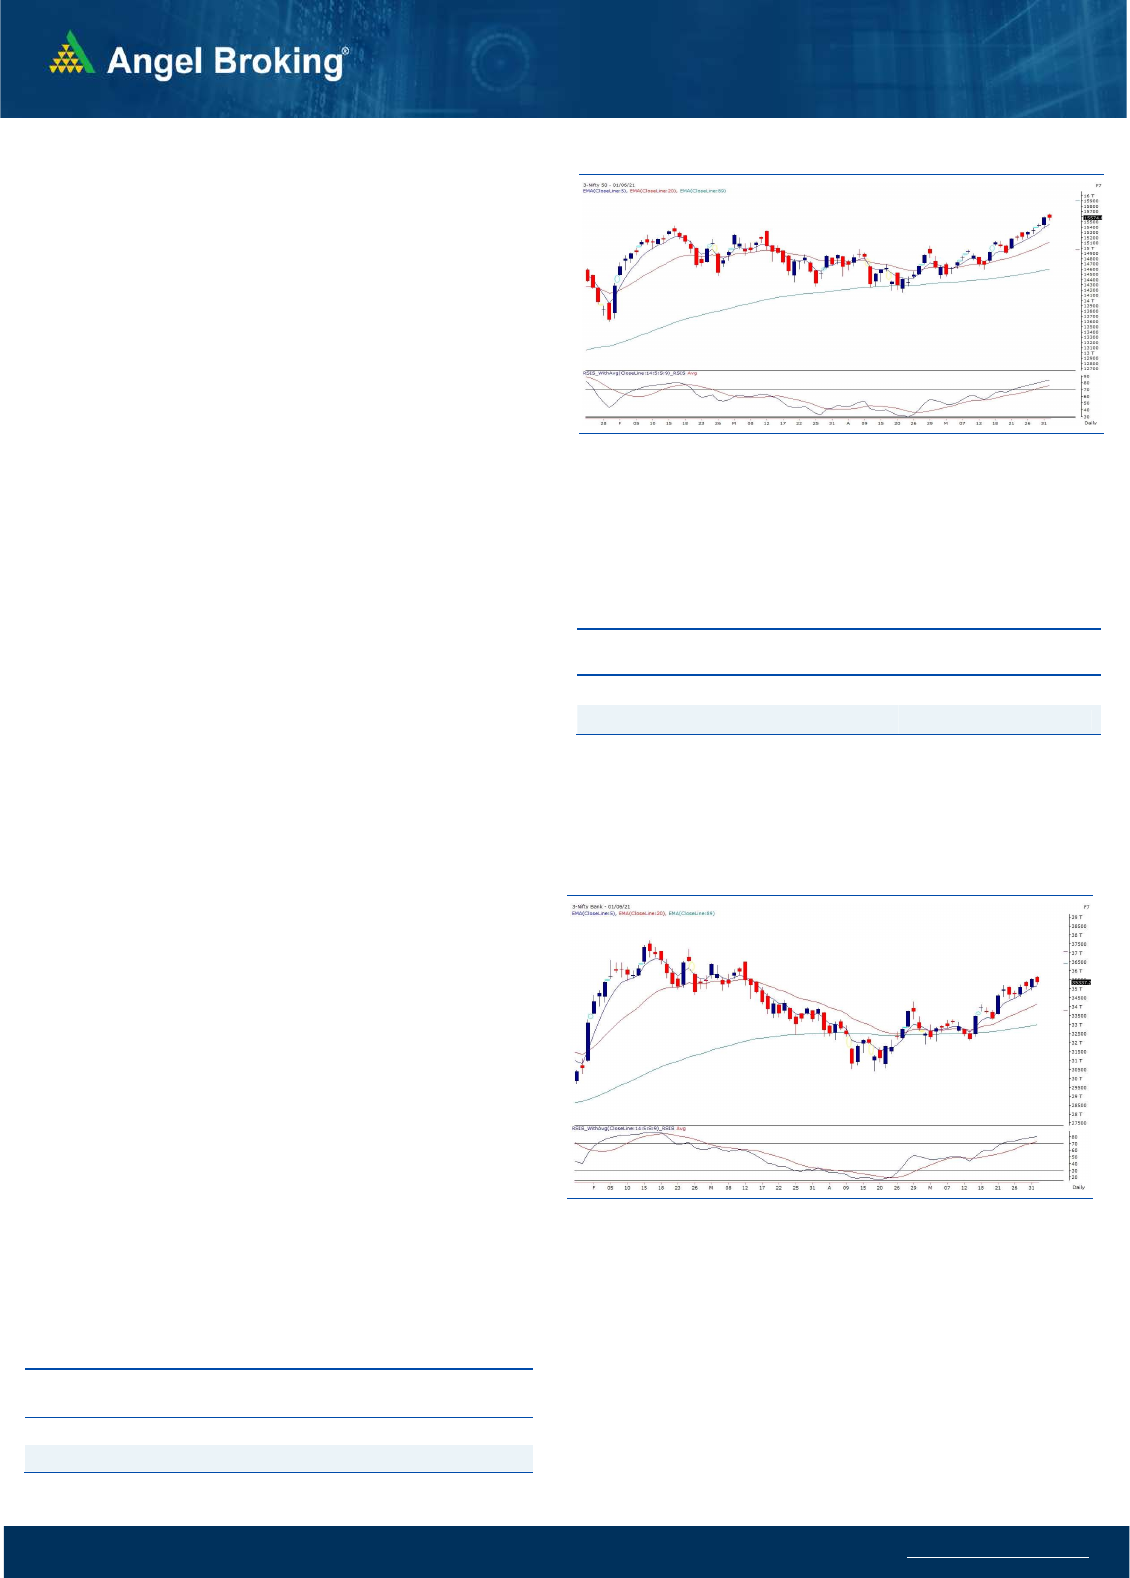
Exhibit 1: Nifty Daily Chart
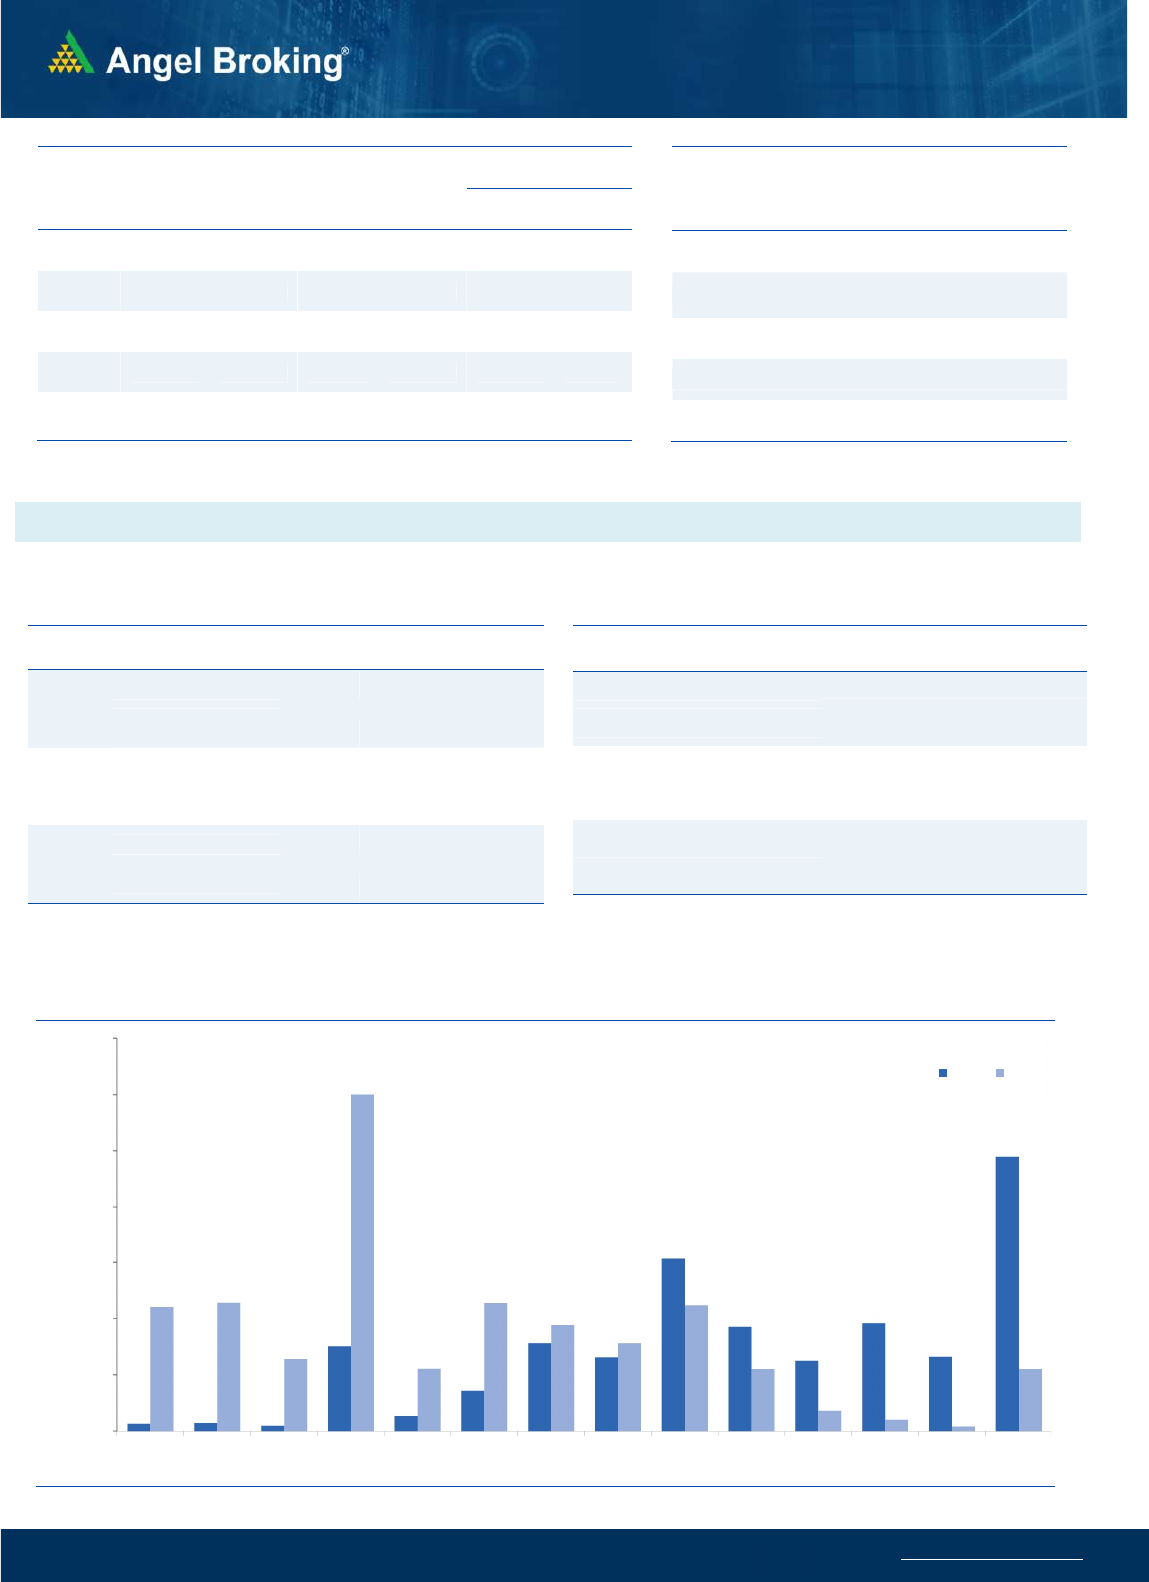
Nifty
Bank
Out
look
-
(
35337
)
We had a positive start for the day; however, the banking index
failed to sustain at higher levels and hence we witnessed some
pull back move to hit intraday low of 35241.20. In the latter
half, index consolidated in a narrow range to eventually
conclude the dull session around half a percent lower to its
previous close.
It we take a glance on the hourly chart, the BankNifty has been
recently taking support around 20 EMA and yesterday as well
this moving average was respected. There isn’t any dent in the
overall chart structure and hence, we expect extension of the
recent upmove first towards 36400-36500 and then around the
life time highs. At current juncture, 34500-35000 is a strong
support zone and until we manage to sustain above same
traders are advised avoiding any bearish bets.
Key Levels
Support 1 – 35000 Resistance 1 – 36000
Support 2 – 34500 Resistance 2 – 36400
Exhibit 2: Nifty Bank Daily Chart
Unlike previous sessions, the stock specific action
yesterday
was
also not encouraging at all. The stock picking was a bit tedious
task and hence going forward one needs to be very choosy while
doing this exercise. We reiterate on avoiding aggressive bets and
one should strictly follow a proper risk management.
Key Levels
Support 1 – 15430 Resistance 1 – 15660
Support 2 – 15400 Resistance 2 – 15700
Se
nsex
(
51935
)
/ Nifty
(
15575
)
Yet another session started higher to post a new high beyond
15600. However in the absence of few heavyweights’
contribution, market could not extend the lead; in fact, we saw
some minor profit taking in the first half. This was followed by a
complete lull for the remaining part of the session. Eventually
Nifty ended the session slightly below 15600 with negligible
losses.
Barring the initial movement in the first half, the index remained
in a slender range of merely 70 points, which is a clear indication
of no real movement in index. Since we are trading in an
uncharted territory some sort of in between breather is quite
evident. We may even see a couple of profit booking sessions as
well and even if that happens it should be treated as a general
phenomenon because market cannot keep rising every day. The
undertone remains bullish and till the time we do not see some
reversal signs, one should use every decline as a buying
opportunity. For the coming session, 15430 – 15400 are to be
seen as key supports; whereas on the higher side, every 100 points
(round figure) move from hereon should be considered an
intraday level in the northward direction. Before this yesterday’s
high of 15660 to be considered as immediate resistance.

www.angelbroking.com
Technical & Derivatives Report
June 02
, 2021
Nifty Vs OI
13800
14000
14200
14400
14600
14800
15000
15200
15400
15600
15800
,0
20,000
40,000
60,000
80,000
100,000
120,000
140,000
4/30 5/4 5/6 5/10 5/12 5/17 5/17 5/24 5/26 5/28 6/1
(`000)
Openinterest Nifty
View
It was a day of consolidation where the indices traded
within a narrow range and Nifty ended yesterday's
session on a flat note.
FIIs were net sellers in the cash segment to the tune of
Rs. 450 crores. In index futures front, they bought worth
Rs. 414 crores with increase in open interest indicating
long formations in yesterday’s session.
Both the indices witnessed marginal open interest
addition while FII's added some longs to their index
futures positions. In the weekly options segment, open
interest addition was seen in 15600-15700 calls. The
overall trend continues to be positive but we may see
some consolidation for a day or two. The supports for
Nifty are placed around 15500 and 15400 while
resistances are seen around 15600 and 15700.
C
o
mme
n
t
s
The Nifty futures open interest has increased by 1.72%.
Bank Nifty futures open interest has increase by 1.14% as
market closed at 15574.85 levels.
The Nifty June future closed with a premium of 43.3 point
against a premium of 0.40 point in last trading session.
The July series closed at a premium of 98.25 point.
The INDIA VIX increasedd from 16.88 to 17.39.
At the same time, the PCR-OI of Nifty decreased from
1.51 to 1.32.
Few of the liquid counters where we have seen high cost
of carry are IDEA, SUNTV, VEDL, JUBLFOOD, AND ALKEM
OI Gainers
SCRIP OI
OI
CHG. (%)
PRICE
PRICE
CHG. (%)
ALKEM 481800 33.61 3102.00 3.88
ASHOKLEY 37800000 13.33 121.65 -1.73
AARTIIND 809625 8.79 1710.85 2.29
CUB 5992300 8.23 167.05 -3.07
SAIL 191776500 8.18 121.20 -4.59
LICHSGFIN 7124000 8.07 477.60 2.35
BHEL 94920000 7.93 71.10 -0.21
MINDTREE 1756000 7.13 2418.30 1.33
OI Losers
SCRIP OI
OI
CHG. (%)
PRICE
PRICE
CHG. (%)
LALPATHLAB 451500 -8.42 2897.85 -2.31
BANKBARODA 211992300 -6.89 79.35 -1.60
EICHERMOT 2308600 -6.19 2665.80 -0.30
ZEEL 75693000 -6.06 213.20 1.79
GUJGASLTD 1751250 -5.85 540.40 0.69
MUTHOOTFIN 2512500 -5.34 1308.90 -0.29
AUBANK 2518000 -5.03 989.10 0.25
PVR 1344728 -4.98 1307.35 -0.49
Put-Call Ratio
SCRIP PCR-OI PCR-VOL
NIFTY 1.32 0.96
BANKNIFTY 0.72 0.87
RELIANCE 0.52 0.35
ICICIBANK 0.65 0.55
INFY 0.60 0.39
Historical Volatility
SCRIP HV
ADANIENT 63.93
ALKEM 35.03
ADANIPORTS 50.03
SAIL 70.40
ONGC 51.93
www.angelbroking.com
Technical & Derivatives Report
June 02
, 2021
Note: Above mentioned Bullish or Bearish Spreads in Nifty (June Series) are given as an information and not as a recommendation.
Nifty Spot =
15574.85
FII Statistics for June 01, 2021
Detail Buy
Net Contracts
Open Interest
Sell
Value
(in Cr.)
Change
INDEX
FUTURES
4170.51
3756.69
413.82
122217
13431.23
4.07
INDEX
OPTIONS
399942.23
401815.66
(1873.43) 996322
104581.15
12.51
STOCK
FUTURES
12864.16
12649.33
214.83
1415807
111042.94
0.09
STOCK
OPTIONS
13540.33
13854.87
(314.54) 168916
12997.61
6.96
Total 430517.23
432076.55
(1559.32) 2703262
242052.93
4.96
Turnover on June 01, 2021
Instru
ment
No. of
Contracts
Turnover
( in Cr. )
Change
(%)
Index Futures
2,58,375 25716.39 5.55
Index Options
3,68,22,484 36,84,270.87 30.86
Stock Futures
8,06,483 64403.91 -3.58
Stock Options
19,64,762 1,58,234.60 -8.47
Total 3,98,52,104 39,32,625.77 27.70
Bull-Call Spreads
Action Strike Price Risk Reward BEP
Buy 15600 237.65
55.20 44.80 15655.20
Sell 15700 182.45
Buy 15600 237.65
100.95 99.05 15700.95
Sell 15800 136.70
Buy 15700 182.45
45.75 54.25 15745.75
Sell 15800 136.70
Bear-Put Spreads
Action Strike Price Risk Reward BEP
Buy 15600 217.70
38.95 61.05 15561.05
Sell 15500 178.75
Buy 15600 217.70
71.75 128.25 15528.25
Sell 15400 145.95
Buy 15500 178.75
32.80 67.20 15467.20
Sell 15400 145.95
Nifty Put-Call Analysis
,0
500,000
1000,000
1500,000
2000,000
2500,000
3000,000
3500,000
14700 14800 14900 15000 15100 15200 15300 15400 15500 15600 15700 15800 15900 16000
Call Put

www.angelbroking.com
Technical & Derivatives Report
June 02
, 2021
Da
ily
Pivot Level
s for
Nifty Constituents
Scrips
S2
S1
PIVOT
R1
R2
ADANIPORTS
751
774
788
812
826
ASIANPAINT 2,875 2,903
2,943
2,971
3,010
AXISBANK
734
740
747
752
760
BAJAJ-AUTO 4,122 4,180
4,264
4,322
4,406
BAJFINANCE 5,550 5,667
5,743
5,860
5,935
BAJAJFINSV 11,481
11,655
11,802
11,976
12,122
BPCL
466
468
473
475
479
BHARTIARTL
526
529
534
537
542
BRITANNIA 3,426 3,436
3,453
3,463
3,480
CIPLA
935
941
949
955
964
COALINDIA
145
147
148
149
150
DIVISLAB 4,129 4,174
4,201
4,246
4,273
DRREDDY 5,233 5,275
5,307
5,349
5,381
EICHERMOT 2,566 2,616
2,660
2,710
2,754
GRASIM 1,411 1,428
1,454
1,470
1,496
HCLTECH
938
945
948
954
958
HDFCBANK 1,496 1,504
1,515
1,523
1,535
HDFCLIFE
659
662
667
670
674
HDFC 2,534 2,558
2,584
2,607
2,633
HEROMOTOCO 2,910 2,944
2,999
3,033
3,088
HINDALCO
382
389
393
399
403
HINDUNILVR 2,318 2,338
2,351
2,371
2,383
ICICIBANK
638
644
654
661
671
IOC
108
109
110
111
112
INDUSINDBK
990
1,000
1,016
1,026
1,041
INFY 1,367 1,377
1,389
1,399
1,411
ITC
211
213
216
218
221
JSW STEEL
670
682
700
712
729
KOTAKBANK 1,767 1,782
1,803
1,818
1,839
LT 1,447 1,461
1,477
1,490
1,506
M&M
790
798
808
816
826
MARUTI 6,998 7,044
7,094
7,140
7,190
NESTLEIND 17,352
17,555
17,683
17,886
18,013
NTPC
108
109
110
111
112
ONGC
113
115
117
119
121
POWERGRID
221
223
225
227
230
RELIANCE 2,117 2,143
2,172
2,198
2,228
SBILIFE
948
957
969
979
991
SHREECEM 27,037
27,330
27,708
28,001
28,379
SBIN
421
427
431
437
441
SUNPHARMA
661
666
670
675
679
TCS 3,114 3,133
3,152
3,171
3,190
TATACONSUM
653
659
663
670
674
TATAMOTORS
312
315
320
323
329
TATASTEEL 1,066 1,083
1,103
1,121
1,141
TECHM 1,007 1,019
1,025
1,037
1,044
TITAN 1,575 1,583
1,598
1,606
1,620
ULTRACEMCO 6,465 6,533
6,628
6,696
6,791
UPL
799
807
817
825
835
WIPRO
536
539
543
547
551

www.angelbroking.com
Technical & Derivatives Report
June 02
, 2021
*
Research Team Tel: 022 – 39357600 (Extn. 6844) Website: www.angelbroking.com
For Technical Queries E-mail: technicalresearch-cso@angelbroking.com
DISCLAIMER
Angel Broking Limited (hereinafter referred to as “Angel”) is a registered Member of National Stock Exchange of India Limited, Bombay
Stock Exchange Limited and Metropolitan Stock Exchange Limited. It is also registered as a Depository Participant with CDSL and
Portfolio Manager and Investment Adviser with SEBI. It also has registration with AMFI as a Mutual Fund Distributor. Angel Broking
Limited is a registered entity with SEBI for Research Analyst in terms of SEBI (Research Analyst) Regulations, 2014 vide registration
number INH000000164. Angel or its associates has not been debarred/ suspended by SEBI or any other regulatory authority for
accessing /dealing in securities Market. Angel or its associates/analyst has not received any compensation / managed or co-managed
public offering of securities of the company covered by Analyst during the past twelve months.
This document is solely for the personal information of the recipient, and must not be singularly used as the basis of any investment
decision. Nothing in this document should be construed as investment or financial advice. Each recipient of this document should make
such investigations as they deem necessary to arrive at an independent evaluation of an investment in the securities of the companies
referred to in this document (including the merits and risks involved), and should consult their own advisors to determine the merits
and risks of such an investment.
Reports based on technical and derivative analysis center on studying charts of a stock's price movement, outstanding positions and
trading volume, as opposed to focusing on a company's fundamentals and, as such, may not match with a report on a company's
fundamentals. Investors are advised to refer the Fundamental and Technical Research Reports available on our website to evaluate the
contrary view, if any.
The information in this document has been printed on the basis of publicly available information, internal data and other reliable
sources believed to be true, but we do not represent that it is accurate or complete and it should not be relied on as such, as this
document is for general guidance only. Angel Broking Limited or any of its affiliates/ group companies shall not be in any way
responsible for any loss or damage that may arise to any person from any inadvertent error in the information contained in this report.
Angel Broking Limited has not independently verified all the information contained within this document. Accordingly, we cannot
testify, nor make any representation or warranty, express or implied, to the accuracy, contents or data contained within this document.
While Angel Broking Limited endeavors to update on a reasonable basis the information discussed in this material, there may be
regulatory, compliance, or other reasons that prevent us from doing so.
This document is being supplied to you solely for your information, and its contents, information or data may not be reproduced,
redistributed or passed on, directly or indirectly.
Technical and Derivatives Team:
Sameet Chavan Chief Analyst - Technical & Derivatives sameet.chavan@angelbroking.com
Ruchit Jain Senior Analyst - Technical & Derivatives ruchit.jain@angelbroking.com
Rajesh Bhosale Technical Analyst rajesh.bhosle@angelbroking.com
Sneha Seth Derivatives Analyst sneha.seth@angelbroking.com
