Technical & Derivatives Report
September 01, 2017
Sensex (31730) / Nifty (9918)
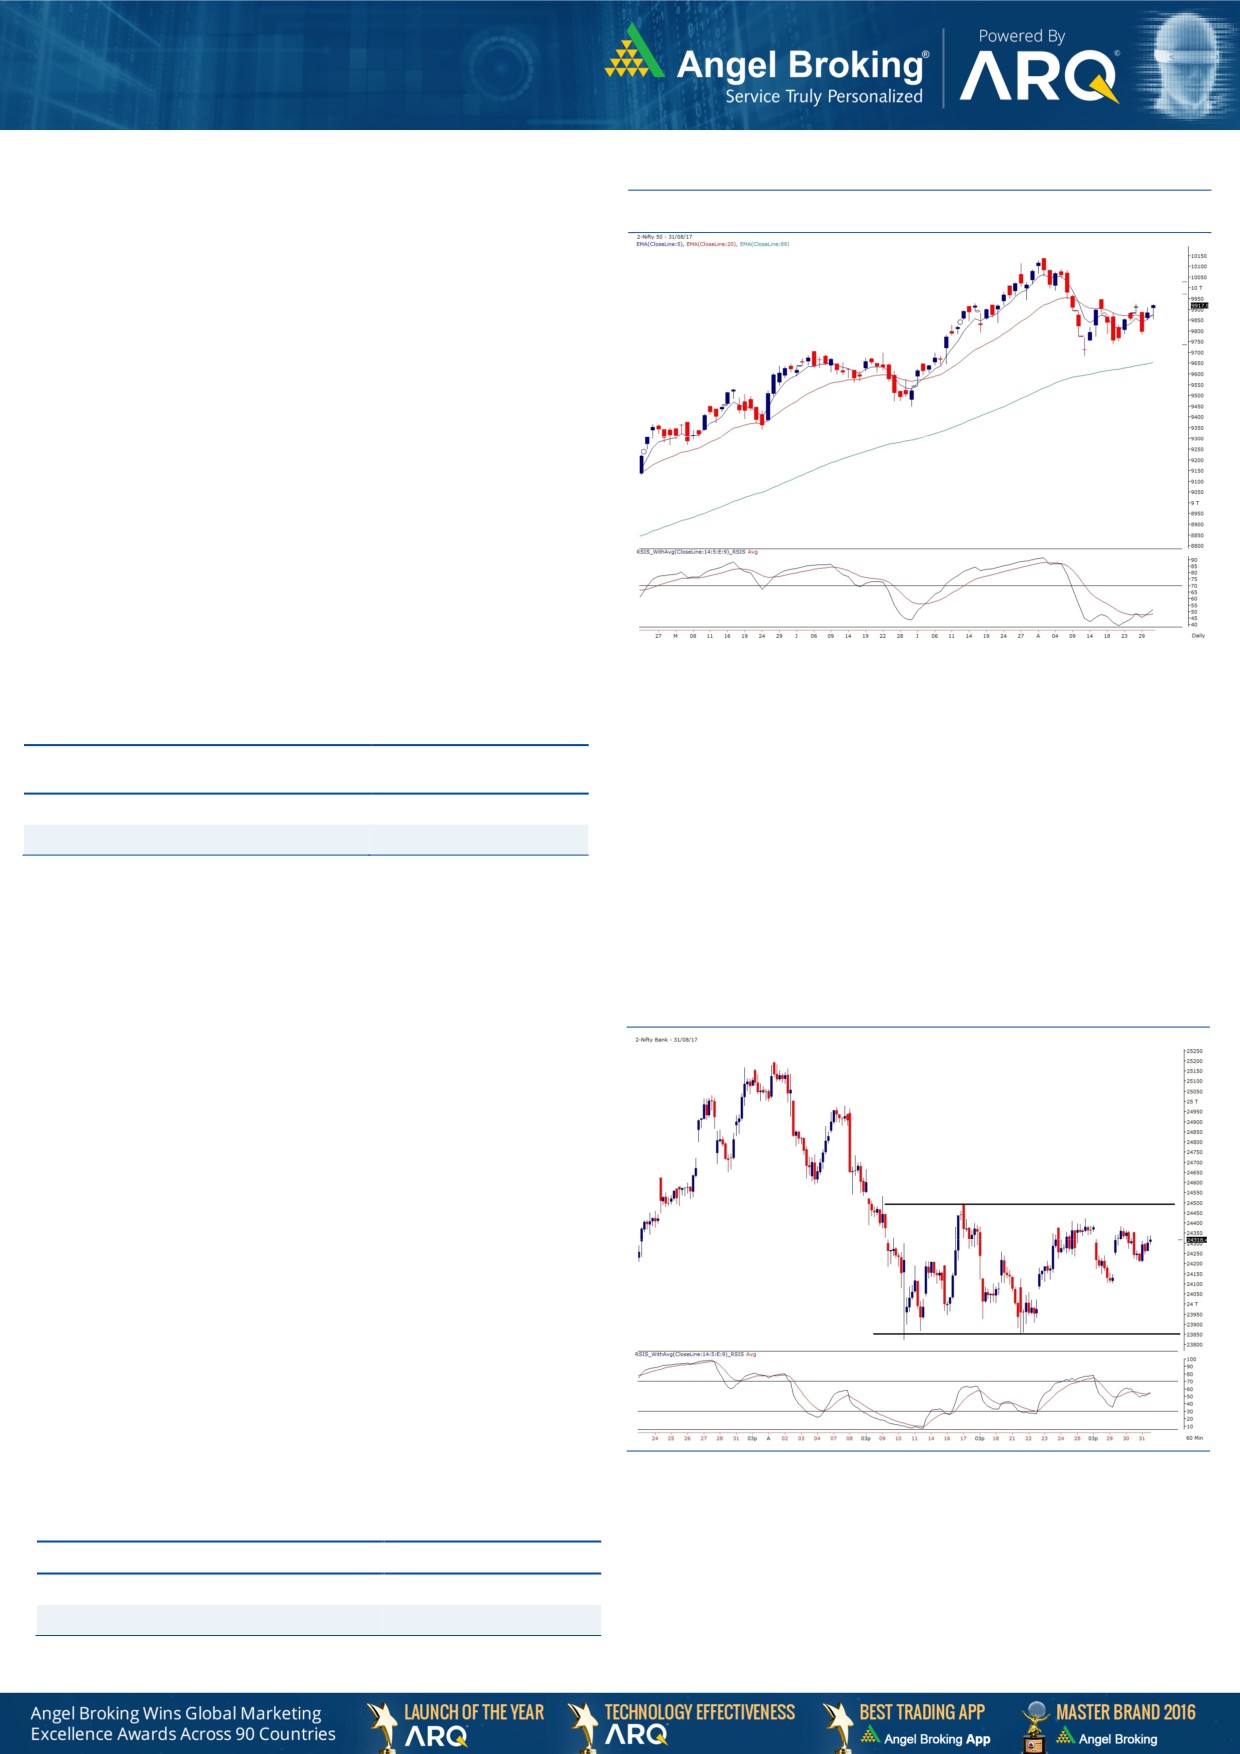
Exhibit 1: Nifty Daily Chart
Our markets opened on a flat note and then consolidated in a
range for the major part of the day. However, the expiry factor
came into play in the last hour of the session during which we
saw index surpassing the 9900 mark to conclude on a
cheerful note.
Yesterday's close has been quite encouraging for the bulls but
since it was F&O expiry day, we'll have to closely watch today's
developments. If our markets manage to carry this momentum
today also to surpass the 9940 mark, then we may see index
extending this rally in next few days. But till that happens, we
would continue to expect profit booking at higher levels.
Honestly speaking, the index is directionless and hence, there
is no point trading in index at this moment. Traders are
advised to keep focusing on individual stocks that are offering
much better trading opportunities. For the coming session,
supports would be seen at 9880 - 9850 levels.
Key Levels
Support 1 - 9880
Resistance 1 - 9940
Support 2 - 9850
Resistance 2 - 9965
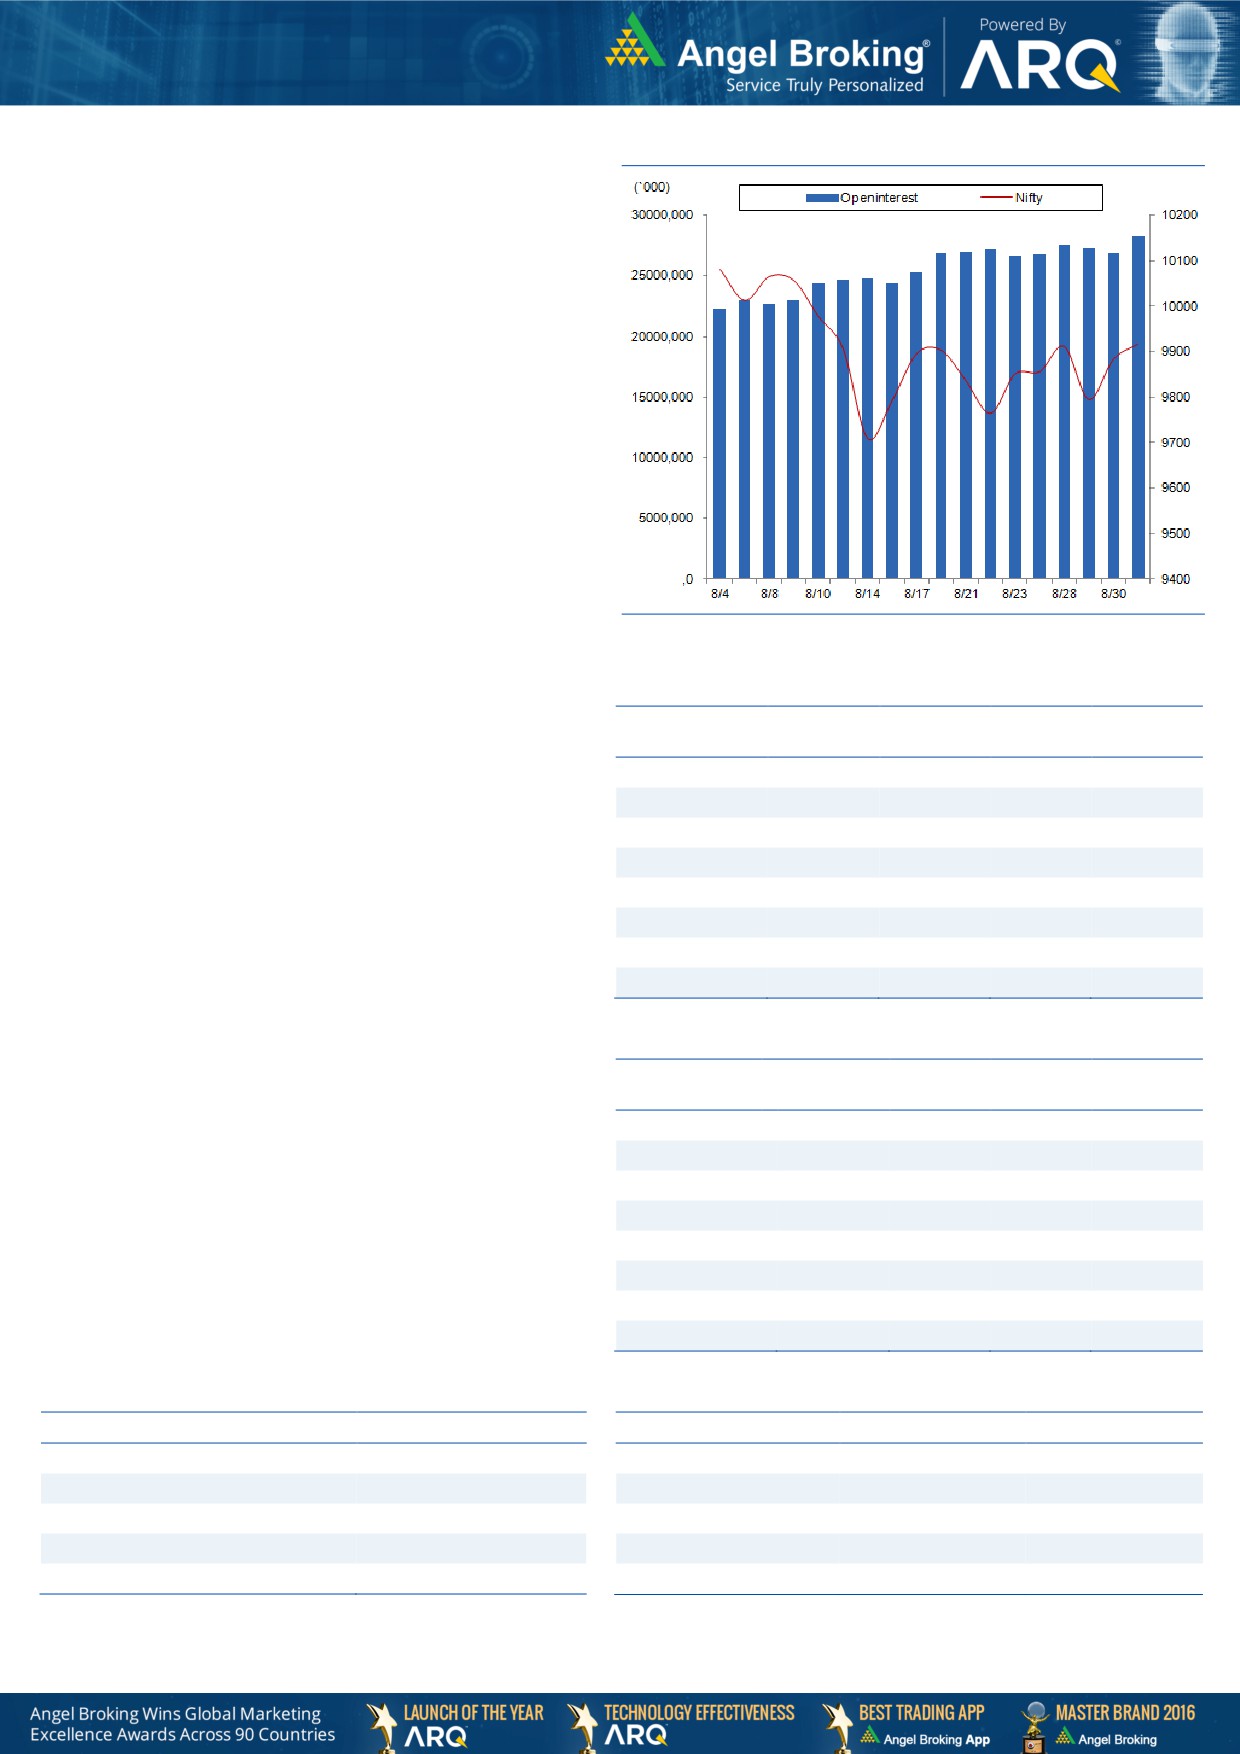
Nifty Bank Outlook - (24318)
Exhibit 2: Nifty Bank Hourly Chart
In yesterday's trading session too, the Nifty Bank index traded
in a narrow range and ended the session with negligible
gains.
The rangebound move continued on the F&O expiry session
too and as mentioned in our earlier report, a directional move
in the index is expected only on a breakout of the range.
However, the broader markets have witnessed positive traction
in last couple of sessions and hence, there are more stock
specific opportunities seen from a short-term perspective.
Thus, we advise traders to focus on stock specific
opportunities. Only in case the index manages to breach the
resistance of 23450-23500, it would then resume the uptrend.
The intraday supports for the Nifty Bank index are placed
around 24205 and 24100 whereas resistance is seen in the
range of 24450-24500.
Key Levels
Support 1 - 24205
Resistance 1 - 24450
Support 2 - 24100
Resistance 2 - 24500
Technical & Derivatives Report
September 01, 2017
Comments
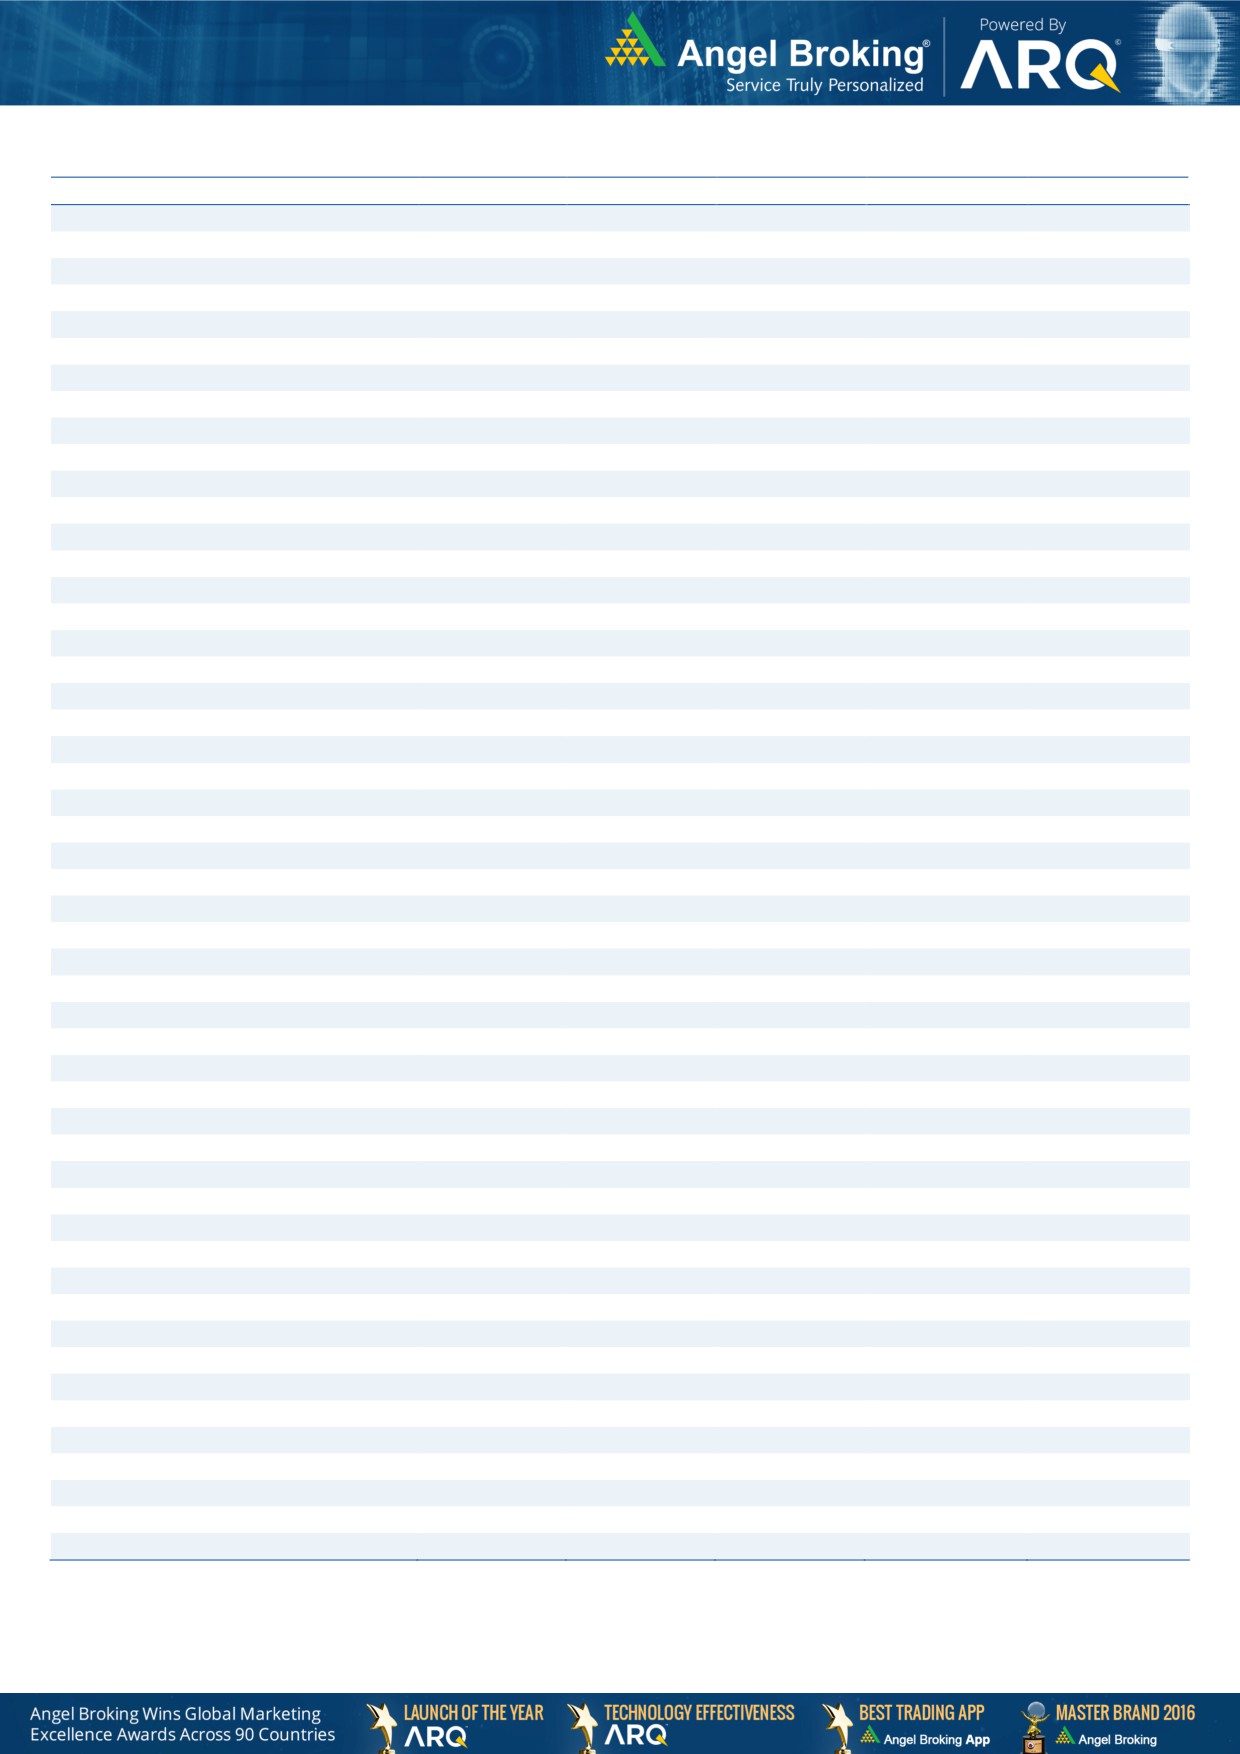
Nifty Vs OI
The Nifty futures open interest has decreased by 39.04%
BankNifty futures open interest has decreased by 30.47%
as market closed at 9917.90 levels.
The Nifty September future closed with a premium of
19.30 points against the premium of 28.05 points in last
trading session. The October series closed at a premium
of 45.75 points.
The Implied Volatility of at the money options has
decreased from 12.54 to 10.06. At the same time, the
PCR-OI of Nifty has increased from 1.19 to 1.33.
Few of the liquid counters where we have seen high cost
of carry are IBREALEST, JPASSOCIAT, JSWENERGY,
SYNDIBANK and SOUTHBANK.
Views
FIIs activity in cash market segment remained subdued.
OI Gainers
While, in index futures they were net buyers worth
OI
PRICE
Rs. 1158 crores with fall in OI by 59%, due to expiry.
SCRIP
OI
PRICE
CHG. (%)
CHG. (%)
In index options segment, they were net buyers of
NATIONALUM
11112000
4.67
72.75
4.00
Rs. 1112 crores with fall in open interest. Being start of
EQUITAS
7696000
4.07
176.50
4.07
new series the overall build-up remained quite scattered
INDIANB
4000000
2.41
288.20
-1.44
In call options, 9900-10500 strikes were active and they
SRTRANSFIN
4908000
1.97
991.50
0.98
added good amount of fresh position. On the flip side,
UPL
5373600
1.36
832.20
-1.47
meaningful open interest addition was seen in 9700-
OIL
1808268
1.27
282.40
-2.17
9900 and 9500 put options. Maximum concentration of
MANAPPURAM
29934000
0.85
99.95
3.63
open interest in September series is placed at 10000 call
CHOLAFIN
289000
0.70
1168.70
-1.42
9700 put options.
Nifty rollover is at 57.96% which is lowest in last one
OI Losers
year, suggesting traders refrained from carrying forward
OI
PRICE
their positions to next series. However, FIIs exited some of
SCRIP
OI
PRICE
CHG. (%)
CHG. (%)
the longs in index futures and at the same time rolled
NTPC
26752000
-56.18
167.15
0.60
decent amount of shorts formed in August series,
RBLBANK
4028000
-52.70
543.55
0.67
resulting ‘Long Short Ratio’ declining to 71% from 84%
INFRATEL
6740500
-39.38
377.50
-2.18
seen in last series. Thus, this indicates they have carried
VGUARD
1647000
-34.64
187.00
2.35
forward their bearish positions for the first time in the
VOLTAS
2330000
-34.62
527.65
0.17
calendar year 2017. Looking at the above data, we
RAMCOCEM
460800
-32.55
689.75
-0.81
would advise traders to remain cautious and avoid going
RELCAPITAL
6756000
-28.75
806.65
3.32
long in index futures.
DISHTV
13027000
-27.25
79.95
-0.56
Historical Volatility
Put-Call Ratio
SCRIP
HV
SCRIP
PCR-OI
PCR-VOL
RDEL
48.18
NIFTY
1.33
0.98
WIPRO
23.07
BANKNIFTY
1.15
1.04
BAJAJ-AUTO
21.01
INFY
0.34
0.45
SRF
36.44
RELIANCE
0.66
0.42
HCLTECH
19.68
SBIN
0.67
0.52
Technical & Derivatives Report
September 01, 2017
FII Statistics for August 31, 2017
Turnover on August 31, 2017
Open Interest
No. of
Turnover
Change
Detail
Buy
Sell
Net
Instrument
Value
Change
Contracts
( in Cr. )
(%)
Contracts
(in Cr.)
(%)
INDEX
INDEX
5795.49
4610.30
1185.19
150157
11517.88
(58.95)
441252
35409.89
50.75
FUTURES
FUTURES
INDEX
INDEX
59119.24
58007.73
1111.51
767694
58499.47
(34.79)
11224342
948079.63
66.93
OPTIONS
OPTIONS
STOCK
28421.42
28502.42
(81.00)
721594
50171.65
(12.35)
STOCK
FUTURES
1909258
134751.80
39.64
FUTURES
STOCK
STOCK
2926.96
2756.38
170.59
1289
86.25
(99.21)
679461
52539.98
23.36
OPTIONS
OPTIONS
Total
96263.11
93876.82
2386.29
1640734
120275.25
(35.13)
TOTAL
14254313
1170781.30
60.27
Nifty Spot = 9917.90
Lot Size = 75
Bull-Call Spreads
Bear-Put Spreads
Action
Strike
Price
Risk
Reward
BEP
Action
Strike
Price
Risk
Reward
BEP
Buy
9900
135.75
Buy
9900
98.35
52.35
47.65
9952.35
30.15
69.85
9869.85
Sell
10000
83.40
Sell
9800
68.20
Buy
9900
135.75
Buy
9900
98.35
89.70
110.30
9989.70
50.70
149.30
9849.30
Sell
10100
46.05
Sell
9700
47.65
Buy
10000
83.40
Buy
9800
68.20
37.35
62.65
10037.35
20.55
79.45
9779.45
Sell
10100
46.05
Sell
9700
47.65
Note: Above mentioned Bullish or Bearish Spreads in Nifty (September Series) are given as an information and not as a recommendation.
Nifty Put-Call Analysis
Technical & Derivatives Report
September 01, 2017
Daily Pivot Levels for Nifty Constituents
Scrips
S2
S1
PIVOT
R1
R2
ACC
1,780
1,790
1,804
1,814
1,828
ADANIPORTS
384
388
393
398
402
AMBUJACEM
277
279
280
282
284
ASIANPAINT
1,133
1,151
1,162
1,180
1,192
AUROPHARMA
711
718
729
736
747
AXISBANK
495
497
501
504
508
BAJAJ-AUTO
2,694
2,754
2,791
2,852
2,889
BANKBARODA
135
137
138
140
142
BPCL
509
519
527
537
544
BHARTIARTL
420
424
428
432
436
INFRATEL
356
366
377
386
397
BOSCHLTD
21,397
21,692
22,196
22,491
22,995
CIPLA
555
563
571
579
587
COALINDIA
233
235
238
241
244
DRREDDY
1,981
2,001
2,026
2,046
2,072
EICHERMOT
30,280
30,866
31,205
31,791
32,130
GAIL
367
373
378
384
389
HCLTECH
828
847
859
877
889
HDFCBANK
1,747
1,762
1,771
1,785
1,794
HDFC
1,733
1,755
1,768
1,790
1,803
HEROMOTOCO
3,942
3,968
3,995
4,021
4,048
HINDALCO
233
236
238
240
242
HINDUNILVR
1,184
1,202
1,212
1,230
1,241
IBULHSGFIN
1,191
1,203
1,213
1,225
1,235
ICICIBANK
295
296
299
300
303
IOC
440
448
455
462
470
INDUSINDBK
1,637
1,647
1,658
1,667
1,678
INFY
903
909
919
925
935
ITC
279
281
282
283
285
KOTAKBANK
956
966
973
983
991
LT
1,123
1,130
1,137
1,144
1,152
LUPIN
962
971
983
992
1,004
M&M
1,319
1,332
1,346
1,359
1,373
MARUTI
7,463
7,581
7,651
7,770
7,839
NTPC
162
165
167
171
173
ONGC
153
155
158
160
162
POWERGRID
213
216
218
221
223
RELIANCE
1,565
1,580
1,589
1,603
1,612
SBIN
272
275
277
280
282
SUNPHARMA
471
476
482
487
492
TCS
2,451
2,474
2,489
2,512
2,527
TATAMTRDVR
216
218
220
221
223
TATAMOTORS
373
375
378
379
382
TATAPOWER
77
78
79
80
81
TATASTEEL
627
633
638
643
649
TECHM
423
425
429
432
435
ULTRACEMCO
3,953
3,977
4,008
4,032
4,064
VEDANTA
298
303
307
312
316
WIPRO
292
295
298
302
304
YESBANK
1,728
1,741
1,758
1,770
1,787
ZEEL
512
516
520
524
528
Technical & Derivatives Report
September 01, 2017
Research Team Tel: 022 - 39357800
For Technical Queries
For Derivatives Queries
DISCLAIMER
Angel Broking Private Limited (hereinafter referred to as “Angel”) is a registered Member of National Stock Exchange of India Limited,
Bombay Stock Exchange Limited and Metropolitan Stock Exchange Limited. It is also registered as a Depository Participant with CDSL
and Portfolio Manager and Investment Adviser with SEBI. It also has registration with AMFI as a Mutual Fund Distributor. Angel Broking
Private Limited is a registered entity with SEBI for Research Analyst in terms of SEBI (Research Analyst) Regulations, 2014 vide
registration number INH000000164. Angel or its associates has not been debarred/ suspended by SEBI or any other regulatory
authority for accessing /dealing in securities Market. Angel or its associates/analyst has not received any compensation / managed or
co-managed public offering of securities of the c*ompany covered by Analyst during the past twelve months.
This document is solely for the personal information of the recipient, and must not be singularly used as the basis of any investment
decision. Nothing in this document should be construed as investment or financial advice. Each recipient of this document should
make such investigations as they deem necessary to arrive at an independent evaluation of an investment in the securities of the
companies referred to in this document (including the merits and risks involved), and should consult their own advisors to determine
the merits and risks of such an investment.
Reports based on technical and derivative analysis center on studying charts of a stock's price movement, outstanding positions and
trading volume, as opposed to focusing on a company's fundamentals and, as such, may not match with a report on a company's
fundamentals. Investors are advised to refer the Fundamental and Technical Research Reports available on our website to evaluate the
contrary view, if any.
The information in this document has been printed on the basis of publicly available information, internal data and other reliable
sources believed to be true, but we do not represent that it is accurate or complete and it should not be relied on as such, as this
document is for general guidance only. Angel Broking Pvt. Limited or any of its affiliates/ group companies shall not be in any way
responsible for any loss or damage that may arise to any person from any inadvertent error in the information contained in this report.
Angel Broking Pvt. Limited has not independently verified all the information contained within this document. Accordingly, we cannot
testify, nor make any representation or warranty, express or implied, to the accuracy, contents or data contained within this document.
While Angel Broking Pvt. Limited endeavors to update on a reasonable basis the information discussed in this material, there may be
regulatory, compliance, or other reasons that prevent us from doing so.
This document is being supplied to you solely for your information, and its contents, information or data may not be reproduced,
redistributed or passed on, directly or indirectly.
Neither Angel Broking Pvt. Limited, nor its directors, employees or affiliates shall be liable for any loss or damage that may arise from
or in connection with the use of this information.