Advisory Desk
TVS Srichakra Ltd.
BUY
CMP
`355
Target Price
`468
TVS Srichakra Ltd. (TVSSL), a part of TVS Group, is a leading manufacturer of two
Investment Period
12 Months
and three-wheeler tyres with a 25% market share. Two-wheeler demand growth
(~16% yoy YTD) continues to be insulated from the current slowdown in the
automobile sector. Given this growth and increased installed capacity of
automotive tyres by 170% to 3.3cr units over FY2009-11, TVSSL’s volume is
expected to grow at a CAGR of 11% over FY2011-13E. Also, the promoters have
increased their stake in the company from 39.5% in June 2007 to 44.4% in June
2011, demonstrating their confidence in the company’s future growth outlook.
We recommend Buy on TVSSL with a target price of `468, based on a target PE of
5x for FY2013E.
Investment rationale
Better performance of two-wheeler sales to drive the company’s volume
Two-wheeler domestic sales have witnessed growth of ~16% yoy YTD. Being into
the manufacturing of two and three-wheeler tyres, TVSSL is not much exposed to
the risks of demand slowdown, as the two-wheeler segment continues to be
insulated from the current slowdown in the automobile sector and is expected to
grow at a CAGR of 13% over FY2011-13E. Backed by this and increased capacity
utilisation, we expect the company’s volume to grow at a CAGR of 11% over
FY2011-13.
Increase in capacity utilisation to drive operating leverage
TVSSL has increased its installed capacity of automotive tyres by 170% to 3.3cr
units over FY2009-11. This capacity increase is expected to drive the operating
leverage for the company. However, capacity utilisation is only 48% (as of March
2011), which is expected to increase to 59% over FY2011-13E.
Increase in promoters’ stake - A positive for the company
The company’s promoters have increased their share from 39.5% in June 2007 to
44.4% in June 2011. This consistent increase in their share in the company is a
good signal for investors, as it demonstrates the confidence of promoters in the
company’s future growth outlook.
Outlook and valuation
At `355, the stock is trading at 4.8x and 3.8x its FY2012E and FY2013E earnings,
respectively. We expect the company’s revenue and profit to witness CAGRs of
22% and 35%, respectively, on the back of the expected increase in capacity
utilisation, which will result in an 11% CAGR in volumes over FY2011-13E.
We recommend Buy on TVSSL with a target PE of 5x for FY2013E and a target
price of `468 for an investment period of 12 months.
Key financials
Sales
OPM PAT EPS RoE P/E P/BV
EV/
EV/
Year
(` cr)
(%)
(` cr)
(`)
(%)
(x)
(x)
EBITDA (x) Sales (x)
FY2011
1,085
8.4
39
51.2
34.4
6.9
2.4
5.7
0.5
FY2012E
1,430
8.6
56
73.7
35.1
4.8
1.7
4.5
0.4
FY2013E
1,607
9.2
72
93.5
32.2
3.8
1.2
3.6
0.3
Source: Company
Please refer to important disclosures at the end of this report
1
Advisory Desk
TVS Srichakra
Investment arguments
Better performance of two-wheeler sales to drive volumes
Two-wheeler domestic sales have witnessed growth of ~16% yoy YTD, whereas
M&HCVs grew by 7.1% and passenger vehicles grew only by 1.9% for the same
period. As TVSSL is largely into the two and three-wheeler tyres segments, it has
not been exposed to demand slowdown. The two-wheeler segment continues to be
insulated from the current slowdown in the automobile sector and is expected to
grow at a CAGR of 13% over FY2011-13E. Based on this growth and increased
capacity utilisation, we expect the company’s volume to grow at a CAGR of 11%
over FY2011-13.
Exhibit 1: Domestic sales of automobiles (April-August) (in’000)
FY2011
FY2012
% Change
Passenger vehicles
959
977
1.9
M&HCVs
121
130
7.1
Three-wheelers
200
200
(0.3)
Two-wheelers
4,621
5,358
15.9
Total
5,901
6,664
12.9
Source: SIAM
TVSSL is in a position to pass on any increase in rubber prices to consumers as it is
the second largest manufacturer in the segment and is considered to be a
premium brand.
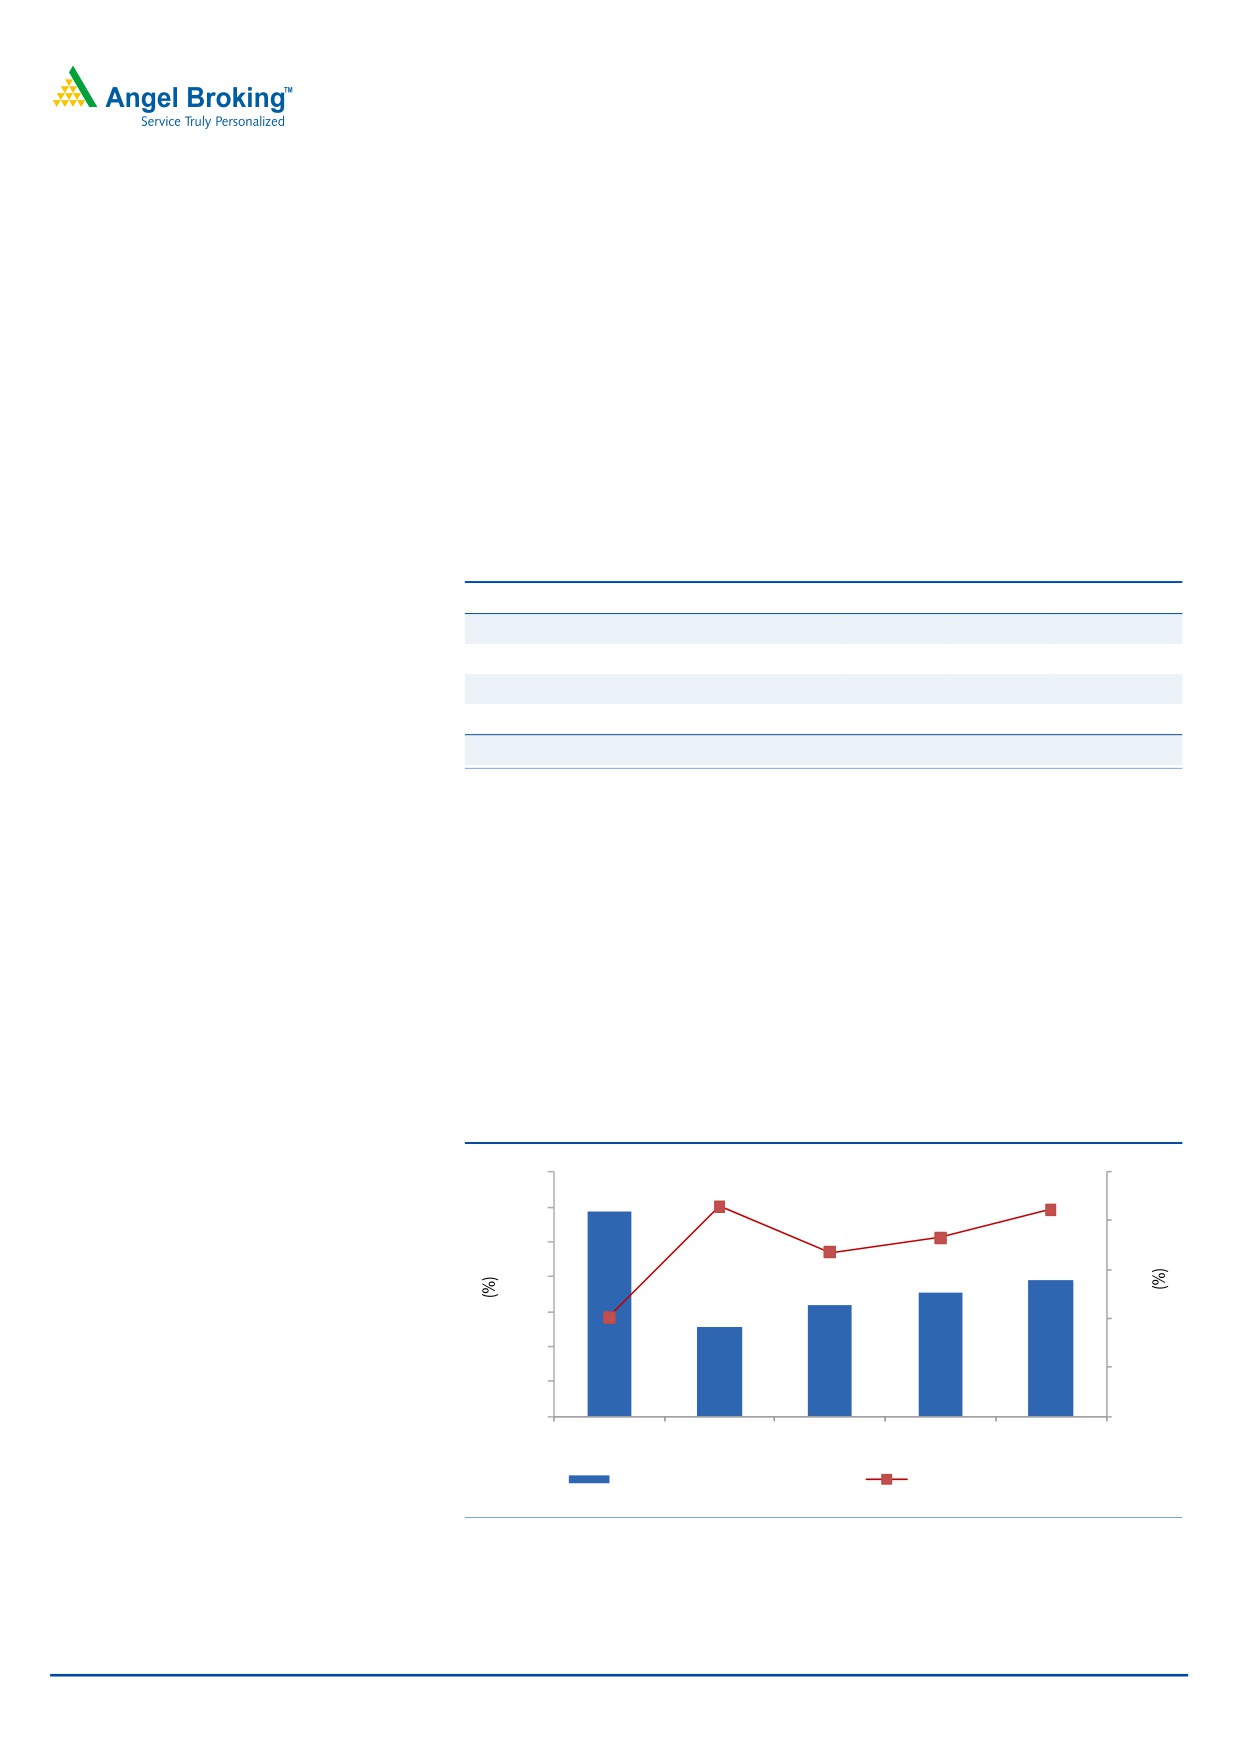
Increase in capacity utilisation to drive operating leverage
TVSSL has set up a new plant at Pantnagar, Uttarakhand, (production started in
July 2009) and has increased the capacity at its Madurai plant. This led to a
significant increase of 170% in its installed capacity of automotive tyres to 3.3cr
units over FY2009-11.
Exhibit 2: Operating leverage to drive margin
105
10
90
9
75
8
60
45
7
30
6
15
0
5
FY2009
FY2010
FY2011
FY2012E
FY2013E
Capacity utilization (LHS)
Operating margin (RHS)
Source: Company, Angel Research
September 21, 2011
2
Advisory Desk
TVS Srichakra
However, capacity utilisation is only 48% for tyres (as of March 2011). The
company has a significant opportunity in terms of increasing its capacity utilisation
to historical levels. We expect capacity utilisation to increase to
59% over
FY2011-13E and improve the company’s operating leverage. This will increase the
operating margin by 87bp to 9.2% in FY2013 from 8.4% in 2011.
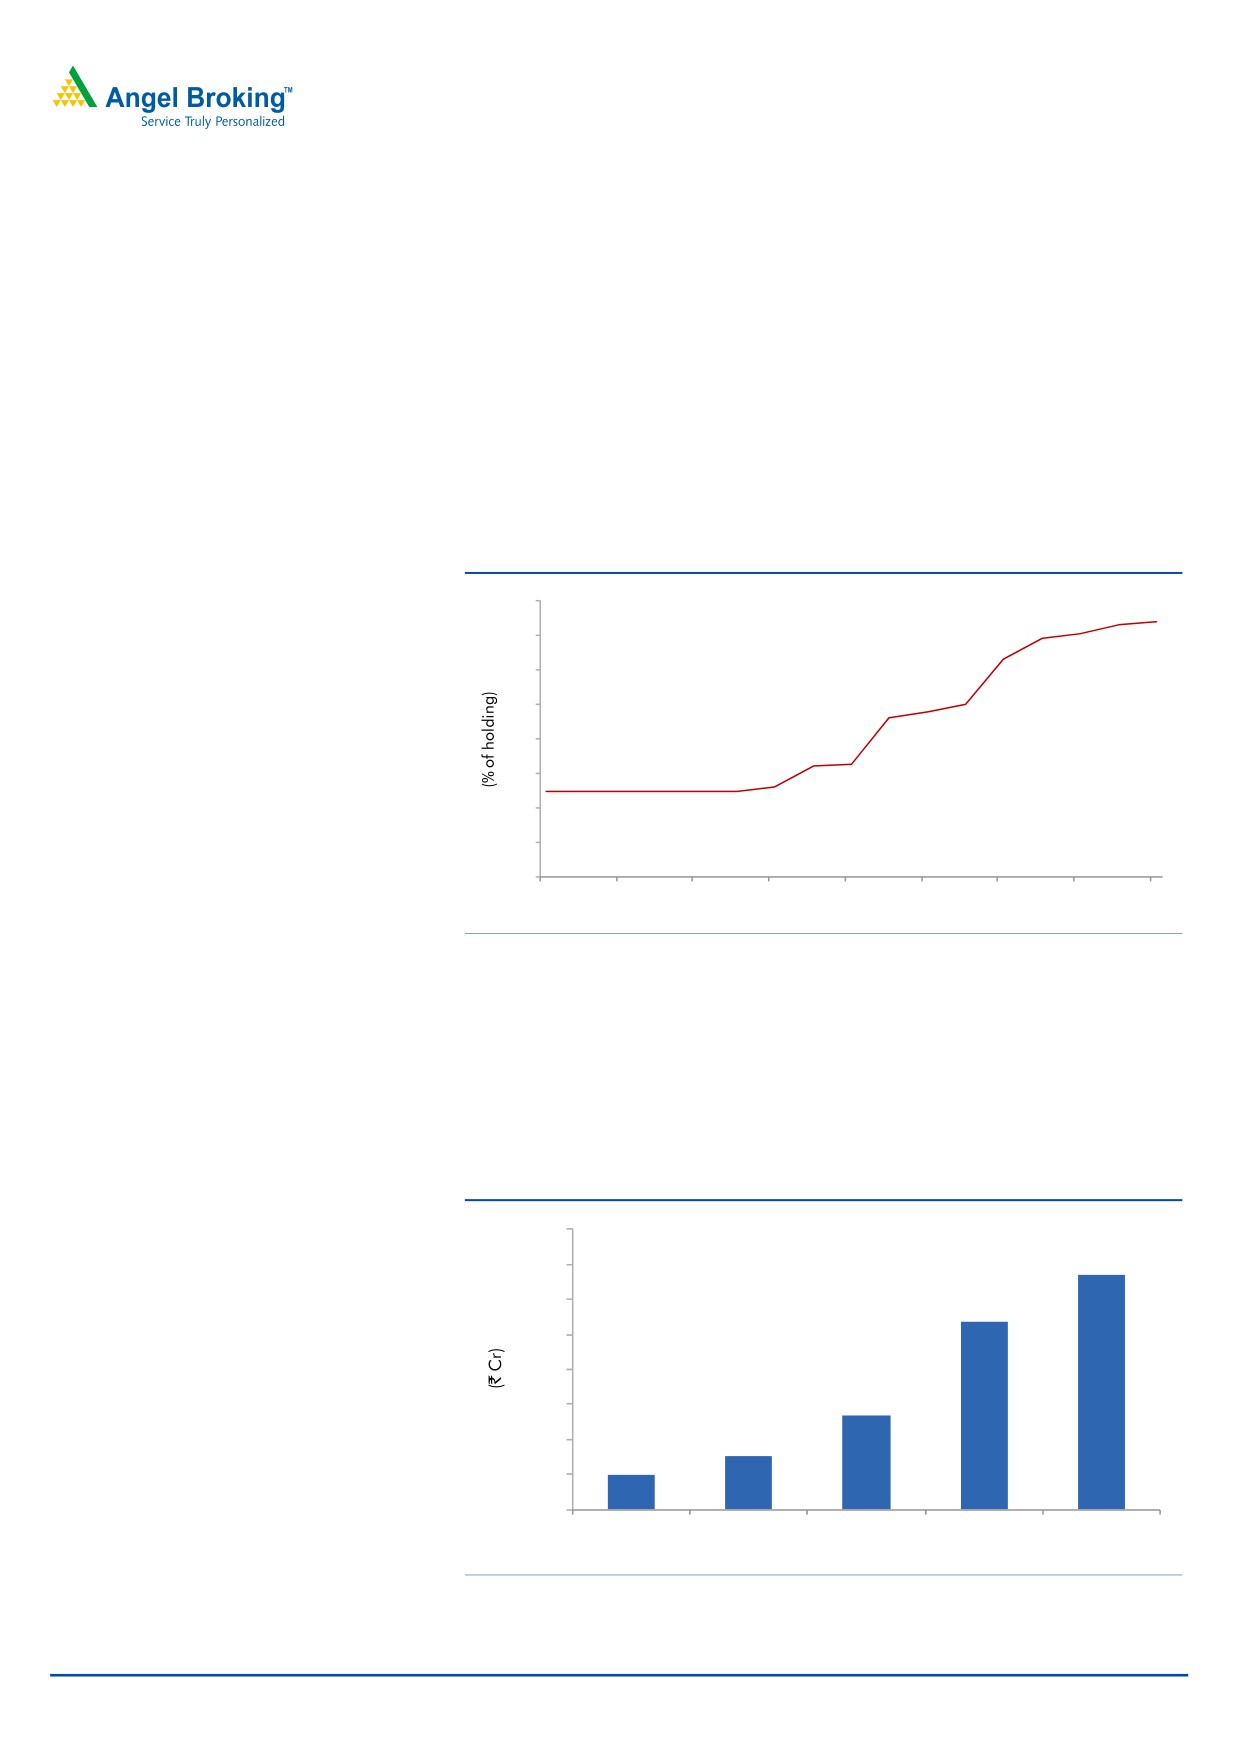
Increase in promoters’ stake - A positive for the company
The company’s promoters have increased their share from 39.5% in June 2007 to
44.4% in June 2011. This consistent increase in their share in the company is a
good signal for investors, as it demonstrates the confidence of promoters in the
company’s future growth outlook.
Exhibit 3: Promoters’ stake
45
44
44.4
43
42
41
40
39
39.5
38
37
Jun-07
Dec-07
Jun-08
Dec-08
Jun-09
Dec-09
Jun-10
Dec-10
Jun-11
Source: Company
Branding
TVSSL is aggressively focusing on brand-building exercises to strengthen the quality
of its dealer network and improve its market share in the after sales business. The
company doubled its advertisement cost in FY2010; and in FY2011, the company
further increased it by 25% to `13.4cr.
Exhibit 4: Advertisement cost
16.0
13.4
14.0
12.0
10.7
10.0
8.0
5.4
6.0
4.0
3.0
2.0
2.0
0.0
FY2007
FY2008
FY2009
FY2010
FY2011
Source: Company
September 21, 2011
3
Advisory Desk
TVS Srichakra
Competition
TVSSL has a market share of 25% (in FY2011) in the two and three-wheeler tyre
segments, next to MRF - who is the leader with a 28% market share. Other players
in the same segment include CEAT and Falcon Tyres.
On the valuation front, TVSSL enjoys the highest RoE among other players in the
tyre manufacturing industry. With a PE of 4.8x and 3.8x for FY2012E and
FY2013E, respectively, TVSSL looks very attractive among its peers.
Exhibit 5: Relative valuation
Sales
OPM
PAT
EPS
ROE
P/E
P/BV
EV/
EV/
Company
Year
(` cr)
(%)
(` cr)
(`)
(%)
(x)
(x)
EBITDA (x)
Sales (x)
TVSSL
2012E
1,430
8.6
56
73.7
35.1
4.8
1.7
4.5
0.4
TVSSL
2013E
1,607
9.2
72
93.5
32.2
3.8
1.2
3.6
0.3
Goodyear
CY2011E
1,510
8.0
75
32.5
23.0
9.9
2.3
3.9
0.3
Goodyear
CY2012E
1,744
10.9
123
53.3
28.8
6.0
1.7
2.0
0.2
MRF
SY2011E
10,026
8.1
292
688.0
14.9
10.2
1.5
6.3
0.5
MRF
SY2012E
11,743
10.1
462
1088.8
19.3
6.5
1.2
4.4
0.4
Apollo Tyres
2012E
11,112
9.5
342
7.0
11.6
8.8
1.1
5.1
0.9
Apollo Tyres
2013E
12,710
10
469
9.0
15.0
6.4
1.0
4.3
0.9
Source: Company, Angel Research
September 21, 2011
4
Advisory Desk
TVS Srichakra
Financials
Exhibit 6: Key assumptions
2012E
2013E
Volume growth (%)
10.6
11.1
Average realisation growth (%)
16.0
1.0
Change in raw-material prices (%)
25.0
(4.0)
Source: Company, Angel Research
Volume growth at an 11% CAGR over FY2011-13E
TVSSL significantly increased its installed capacity of automotive tyres by 170% to
3.3cr units over FY2009-11 to meet up with the increasing demand of two and
three-wheeler tyres. We expect sales of two-wheelers and three-wheelers in the
industry to grow at a CAGR of 13% over FY2011-13E. Further, we expect the
company’s volume to grow at a CAGR of 11% over the same period on the back
of the above-mentioned factors and considering replacement demand.
Exhibit 7: TVSSL's volume growth
FY2008 FY2009 FY2010 FY2011 FY2012E FY2013E
Vehicle population growth (%)
10.1
9.8
11.3
12.9
12.8
12.7
Volume growth for TVSSL (%)
1.0
9.6
15.5
27.1
10.6
11.1
Source: Company, Angel Research
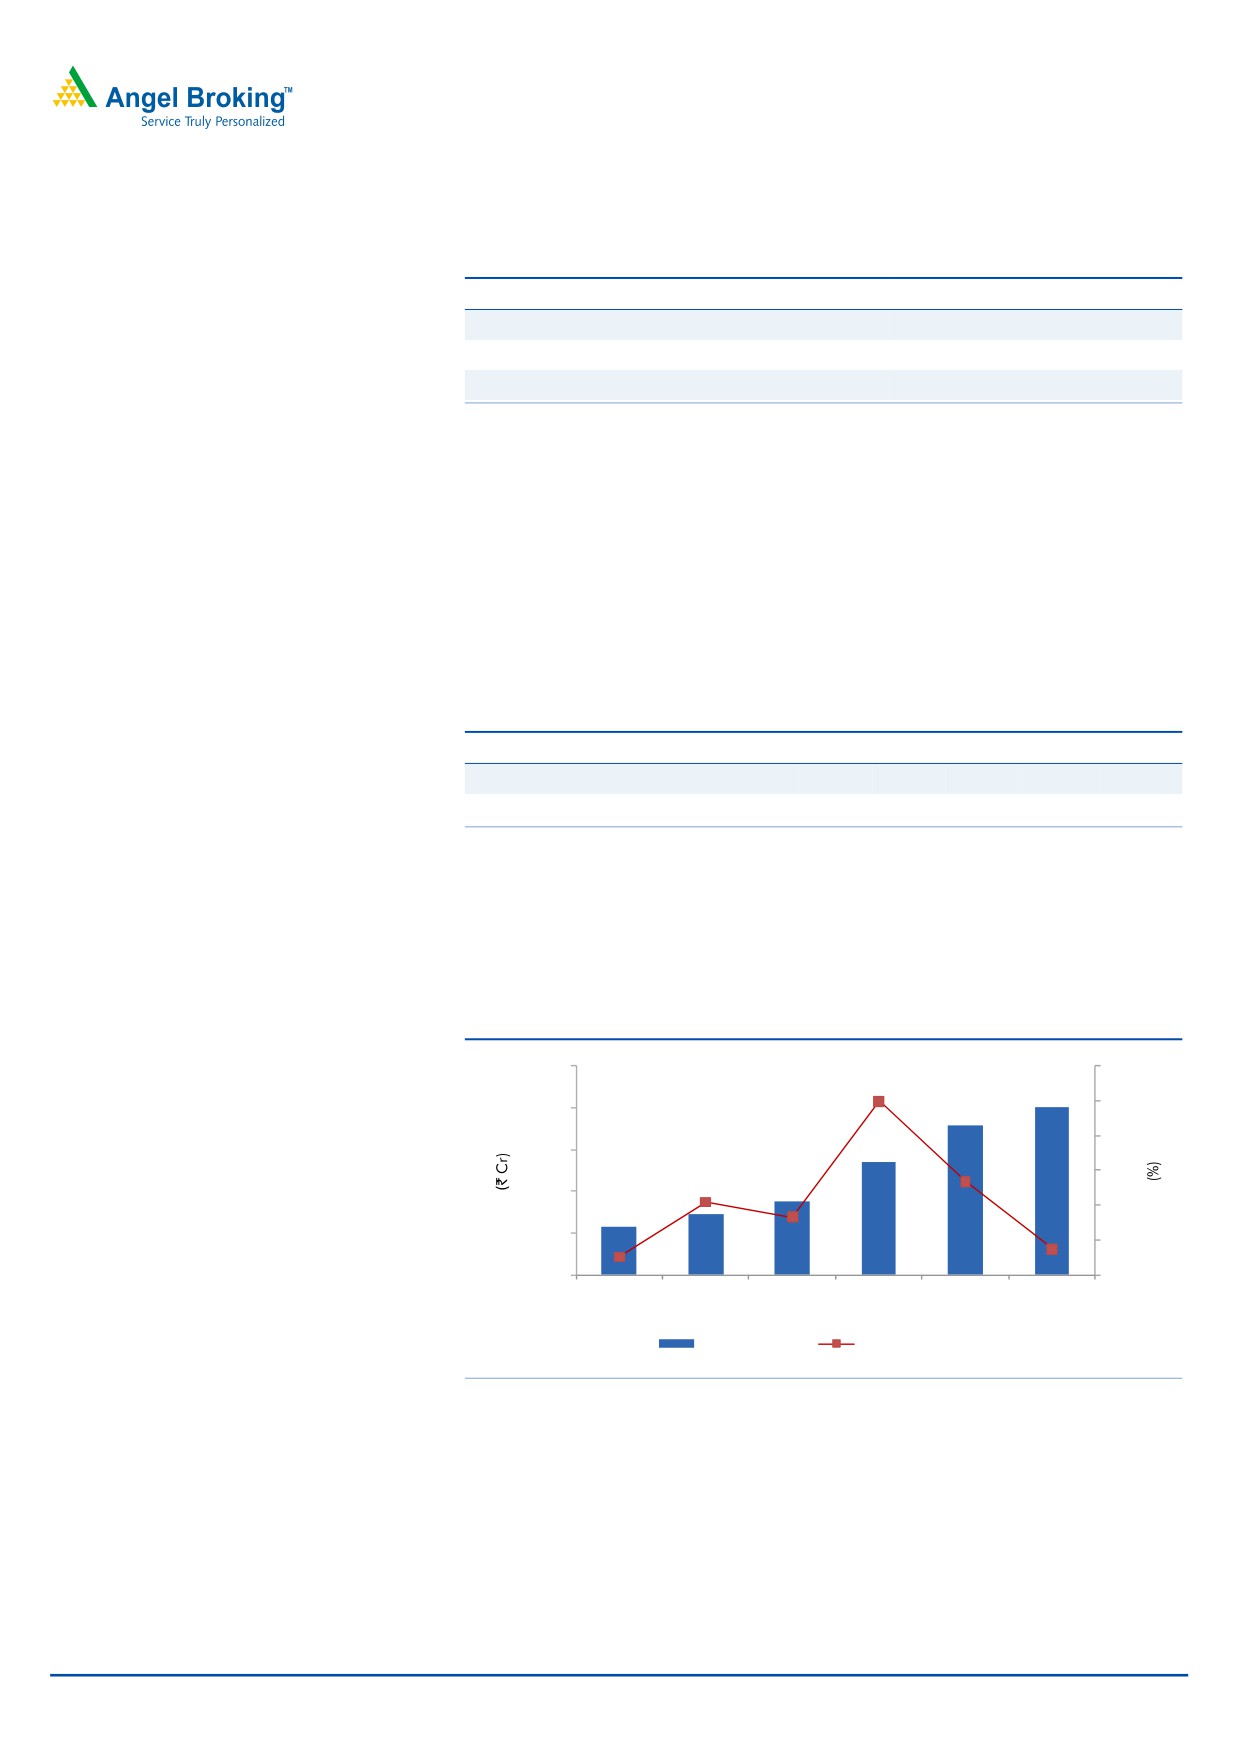
Revenue to grow at a 22% CAGR over FY2011-13E
TVSSL’s revenue is expected to grow at a 22% CAGR over FY2011-13E to
`1,607cr as volume is expected to post an 11% CAGR over the same period.
Exhibit 8: Revenue and revenue growth
2000
65
55
1600
45
1200
35
800
25
400
15
0
5
FY2008
FY2009
FY2010
FY2011
FY2012E FY2013E
Revenue (LHS)
Revenue growth (RHS)
Source: Company, Angel Research
September 21, 2011
5
Advisory Desk
TVS Srichakra
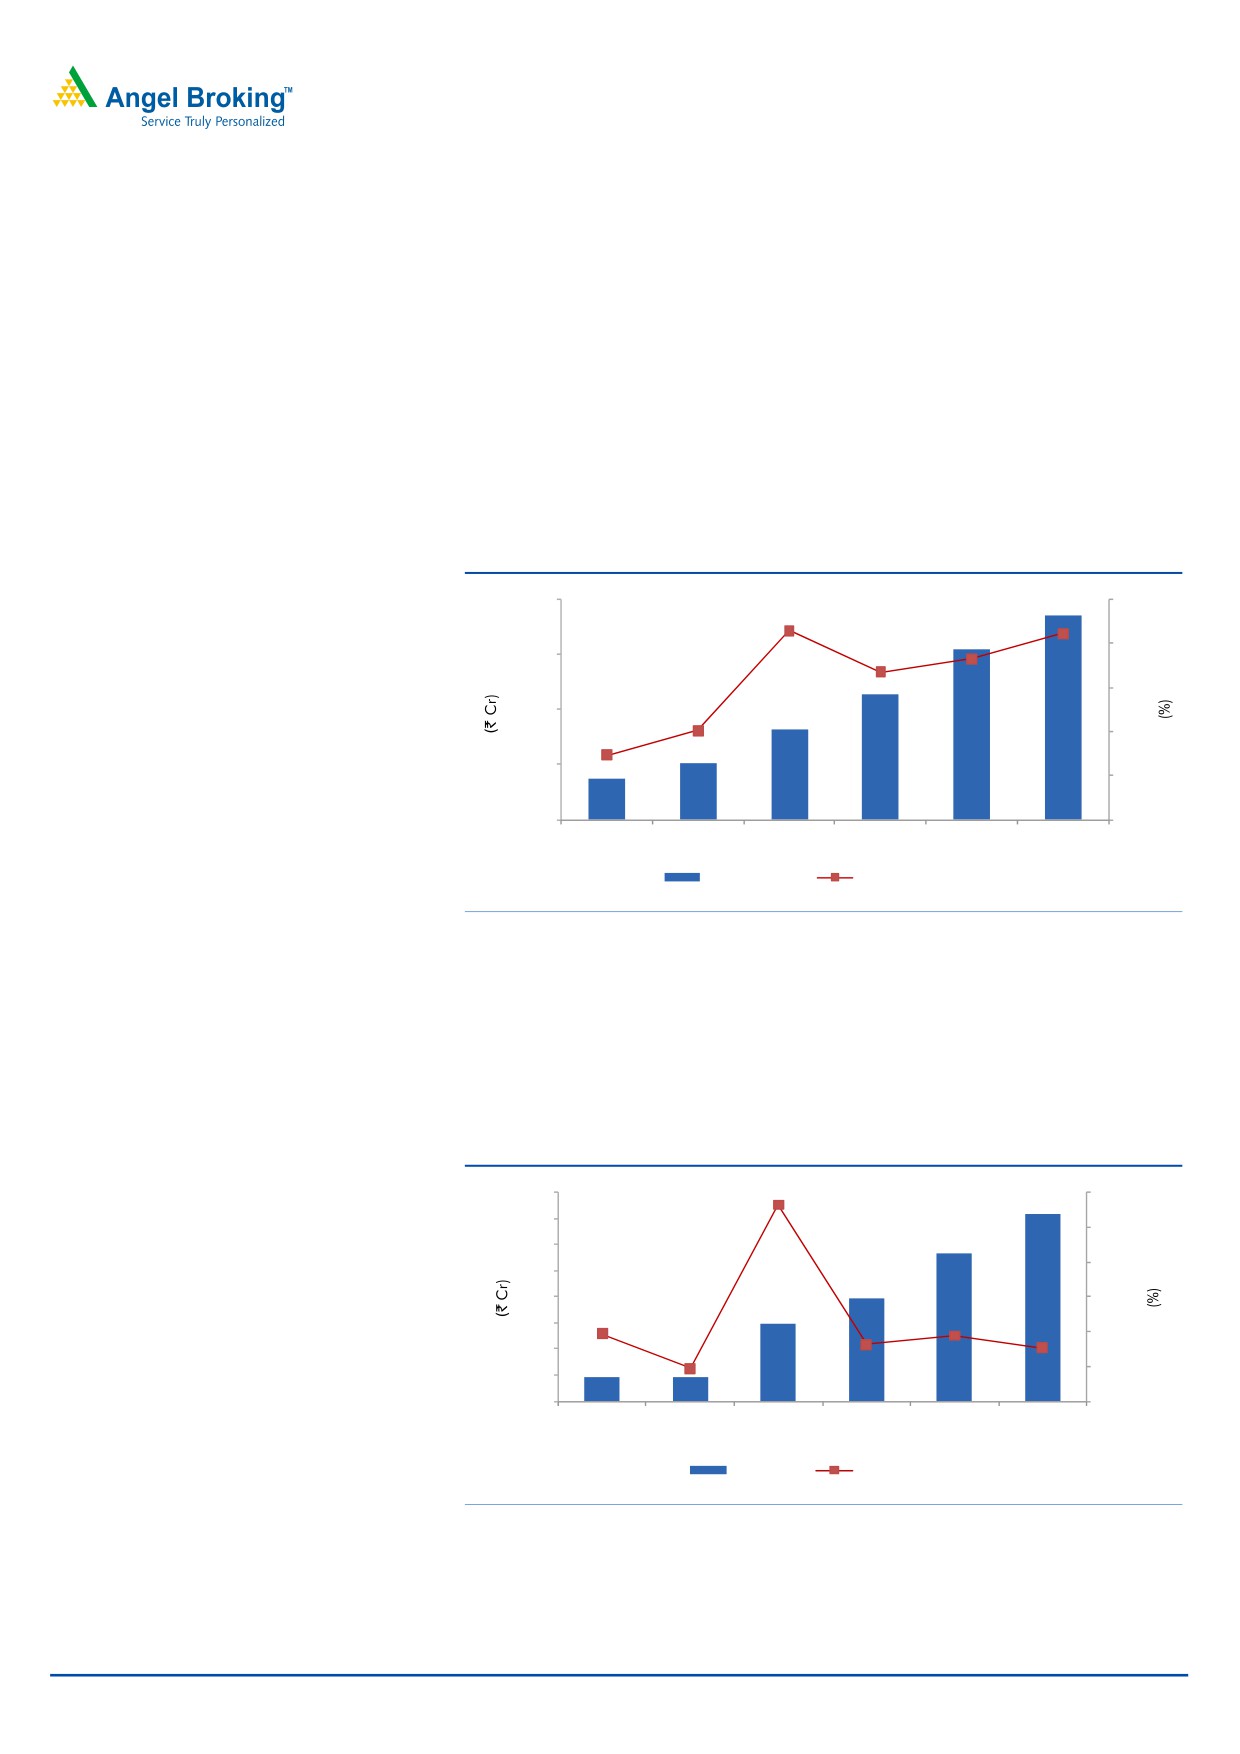
Profit to grow at a 35% CAGR for FY2011-13E
The company’s operating profit margin is expected to improve by 87bp to 9.2% in
FY2013E from 8.4% in FY2011, mainly on the back of increased capacity
utilisation from 48% to 59% over FY2011-13E.
The company’s rubber consumption is lower vis-à-vis the industry’s average rubber
consumption i.e., 57% of sales vis-à-vis industry average of 61%, which gives the
company an edge over its peers in terms of getting affected by any increase in
rubber prices. Also, TVSSL is in a position to pass on any increase in rubber prices
to consumers and maintain its operating margin as it is the second largest
manufacturer in the segment and is considered to be a premium brand.
Exhibit 9: EBITDA and EBITDA margin
160
10
9
120
8
80
7
40
6
0
5
FY2008
FY2009
FY2010
FY2011
FY2012E FY2013E
EBITDA (LHS)
EBITDA Margin (RHS)
Source: Company, Angel Research
The interest cost of for the company stood at `30cr at a rate of 11.6% for FY2011.
Considering the increase in the interest rates for the past 18 months, we have
assumed an interest rate of 13.5% for FY2013E on a conservative basis. Given the
company’s revenue growth and improved operating margin, we expect TVSSL’s
profit to grow at a 35% CAGR to `72cr over FY2011-13E.
Exhibit 10: PAT and PAT growth
80
250
70
200
60
150
50
40
100
30
50
20
0
10
0
-50
FY2008
FY2009
FY2010
FY2011
FY2012E FY2013E
PAT (LHS)
PAT growth (RHS)
Source: Company, Angel Research
September 21, 2011
6
Advisory Desk
TVS Srichakra
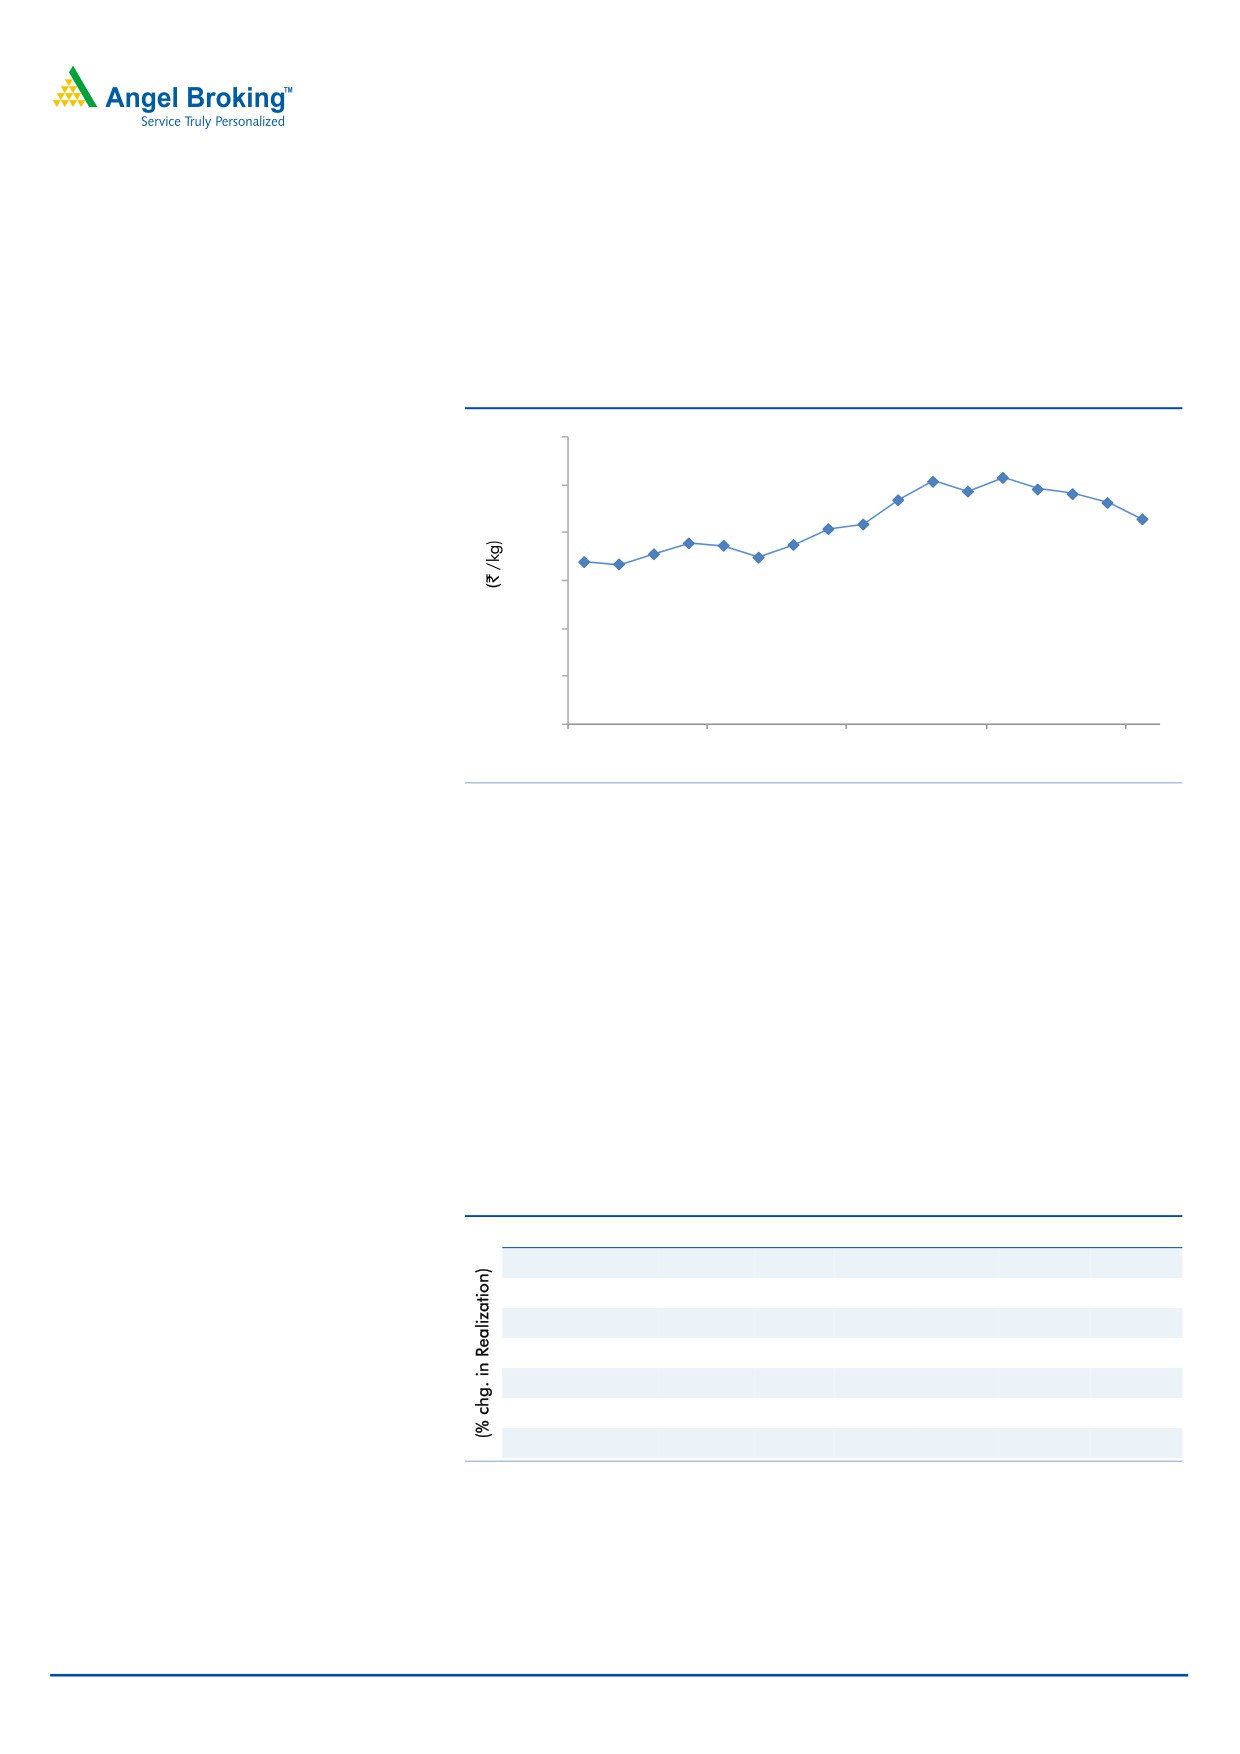
Risks
Further rise in raw-material prices
Rubber, the key raw material of the company, witnessed a price rise of 59% from
`169/kg in April 2010 to `244/kg in March 2011.
Exhibit 11: Rubber prices
300
250
214
200
150
169
100
50
0
Apr-10
Aug-10
Dec-10
Apr-11
Aug-11
Source: Rubber Board
Though rubber prices are witnessing a downtrend from April 2011, any further
price rise may pressurise the company’s operating margin. Due to a difference in
mix, rubber cost is typically 30% lower for TVSSL than other tyre companies.
Sensitivity analysis of EPS
The sensitivity analysis reflects the changes in EPS w.r.t. the percentage change in
rubber price and realisation. On our assumption of 4% decrease in rubber price
and 1% increase in realisation, the EPS for FY2013E stands at `93.5. However, if
rubber price goes down by 10% and realisation increases by 10%, EPS can grow to
`223; but if rubber price goes up by 10% with the same increase in realisation,
EPS will be `97.
Exhibit 12: Impact on EPS w.r.t. % chg. in realisation and rubber price
(% chg. in Rubber prices)
-10%
-4%
0%
10%
20%
30%
-10%
19.4
-18.5
-43.7
-106.7
-169.7
-232.8
0%
121.2
83.4
58.2
-4.9
-67.9
-130.9
1%
131.4
93.5
68.3
5.3
-57.7
-120.7
10%
223.0
185.2
160.0
97.0
33.9
-29.1
20%
324.8
287.0
261.8
198.8
135.8
72.7
30%
426.7
388.8
363.6
300.6
237.6
174.6
Source: Company, Angel Research
September 21, 2011
7
Advisory Desk
TVS Srichakra
Slowdown in the two-wheeler automobile segment
Any slowdown in the domestic sales of two wheelers may pose a risk to the
company as tyre demand (OE segment) is directly dependent on automobile
demand.
September 21, 2011
8
Advisory Desk
TVS Srichakra
Tyre industry in India
According to Crisil Research, the Indian tyre industry is estimated at `29,000cr (as
of June 2011), registering a CAGR of 16% over FY2007-11. The industry has an
aggregate installed capacity of 13.7cr units and production of 9.7cr units of tyres
(FY2009-10). The industry has three segments: original equipment (OE) (26%),
replacement (63%) and exports (11%).
The industry’s margins are directly linked to raw-material cost, as it constitutes 66%
of sales turnover and 70% of operational cost. In FY2011, the industry’s operating
margin declined by 450-480bp from 13.4% in FY2009-10 because of the sharp
increase of 66% in natural rubber prices in the domestic market. In contrast, price
realisation for the same period was 17-19%, which was insufficient to sustain
margins.
Exhibit 13: Industry segments (As of March 2011)
Others
4%
LCV
8%
2/3 wheelers
12%
Truck and bus
53%
Tractors
10%
Cars and UVs
13%
Source: Crisil Research
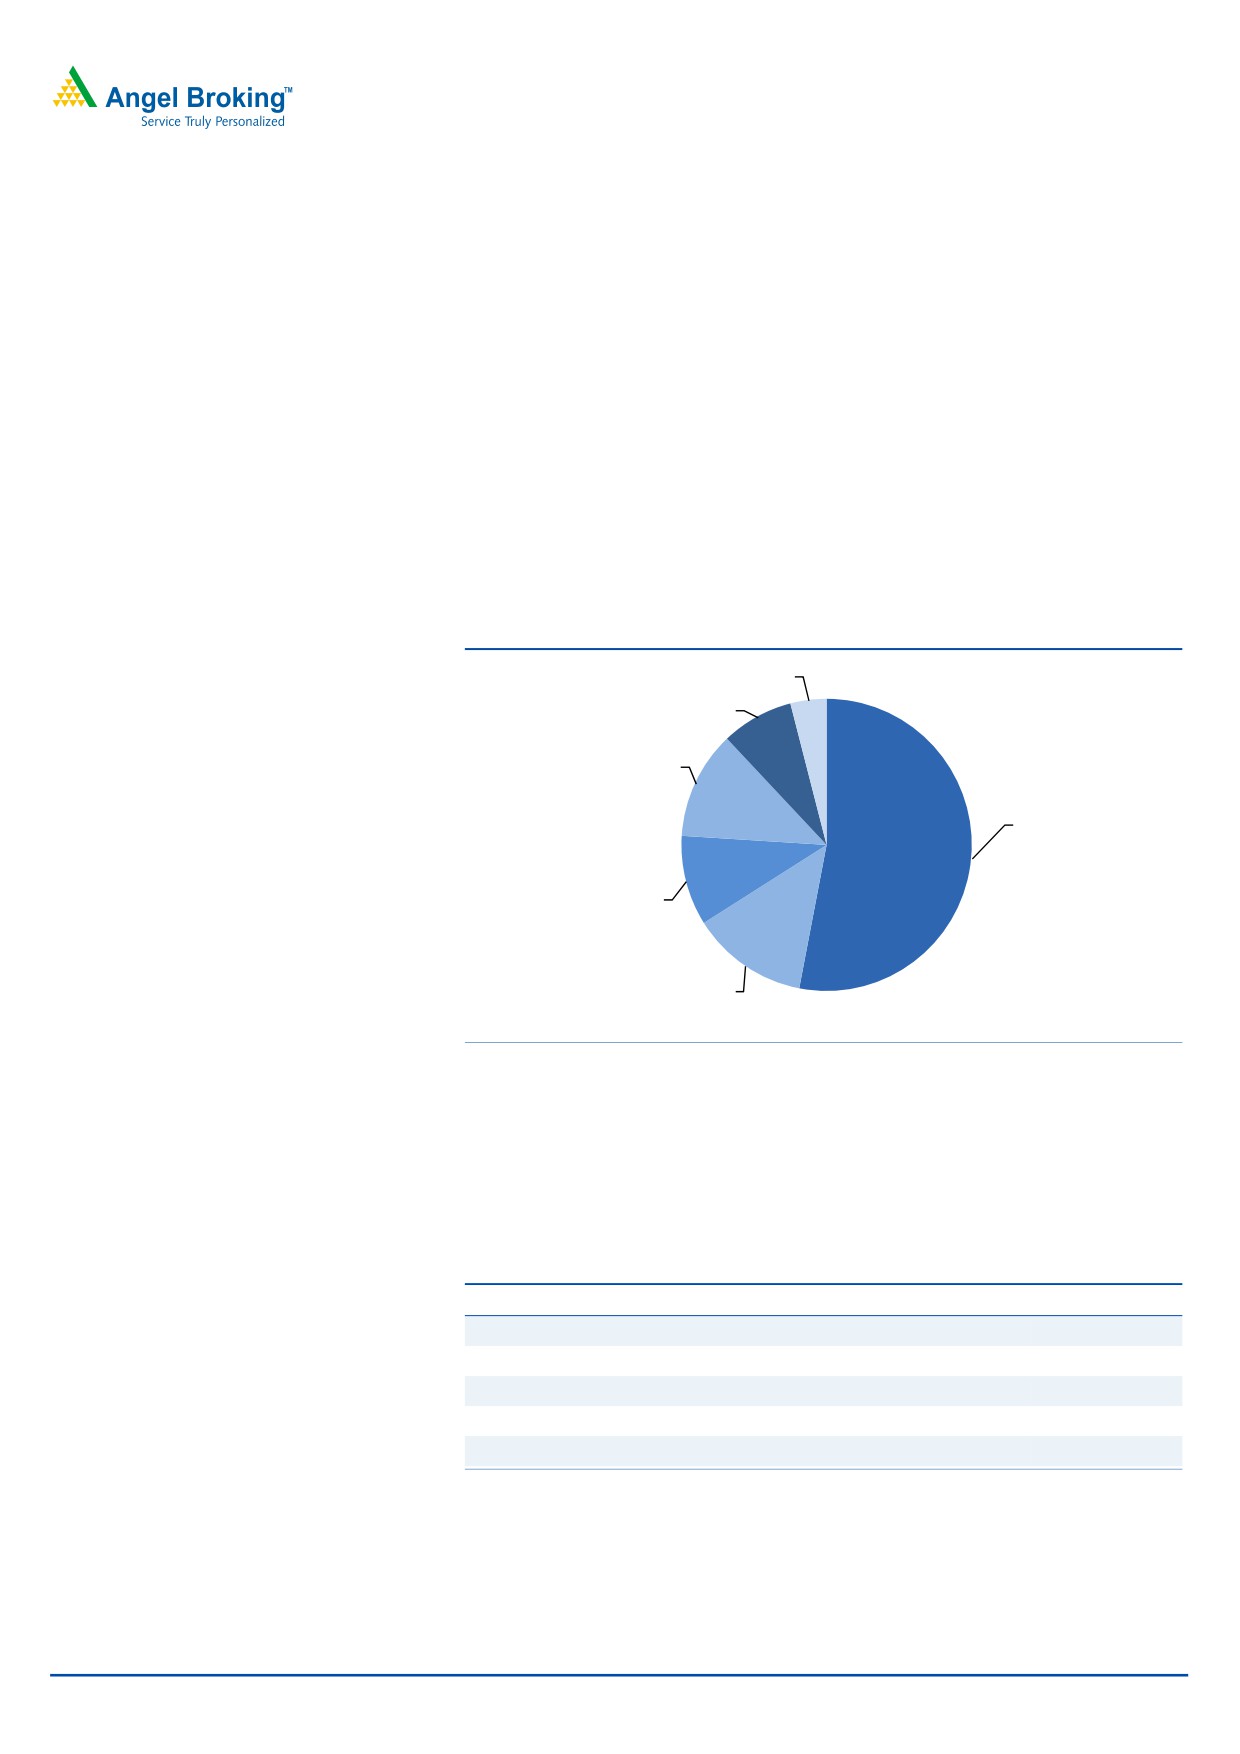
Two-wheeler and three-wheeler tyre industry
The two and three-wheeler tyre industry is expected to grow at a CAGR of 13%
over FY2011-13E. MRF is the leader in this segment, with a market share of 28%
followed by TVSSL (25%).
Exhibit 14: Market share of two and three-wheeler tyres (FY2011)
Company
Market share (%)
MRF Ltd.
28
TVS Srichakra Ltd.
25
Falcon Tyres Ltd.
18
Ceat Ltd.
8
Others
21
Source: Crisil Research
September 21, 2011
9
Advisory Desk
TVS Srichakra
The company
TVSSL is part of the TVS Group. The company is a leading manufacturer of two
and three-wheeler tyres and enjoys a market share of
25% (FY2011).
The company manufactures a complete range of two and three-wheeler tyres for
the domestic market. For the export market, the company manufactures industrial
pneumatic tyres, farm and implements tyres, skid steer tyres, multipurpose tyres
and floatation tyres, among others. TVSSL’s manufacturing units are located at
Madurai, Tamil Nadu and Pantnagar (Uttarakhand). The company has a total
installed capacity of 330lakh units of tyres (as of March 2011).
In FY2010, TVSSL setup a new plant at Pantnagar, Uttarakhand, (production
started in July 2009) and increased the capacity at its Madurai plant. This resulted
in a significant increase of 170% in its installed capacity of automotive tyres to
3.3cr units in FY2011 from FY2009.
With a network of over 2,050 dealers and 20 warehouses across the country, the
company is a major supplier to TVS Motors, Hero MotoCorp, Bajaj Auto and India
Yamaha Motor. Exports constitute 11% of the company’s net sales, which includes
exports to the US, Europe, Africa, South America and Southeast Asia.
September 21, 2011
10
Advisory Desk
TVS Srichakra
Standalone profit and loss account
Y/E March (` cr)
FY2008
FY2009
FY2010
FY2011
FY2012E
FY2013E
Gross sales
520
643
753
1,181
1,557
1,749
Less: Excise duty
62
67
53
96
126
142
Net Sales
458
576
701
1,085
1,430
1,607
Other operating income
-
-
-
-
-
-
Total operating income
458
576
701
1,085
1,430
1,607
% chg
-
25.8
21.6
54.9
31.8
12.3
Net Raw Materials
304
390
432
691
940
1,047
% chg
28.2
10.6
60.0
36.2
11.4
Other Mfg costs
28
37
56
89
106
119
% chg
32.2
48.9
60.0
18.6
12.3
Personnel
35
42
54
84
103
116
% chg
20.8
26.9
57.7
22.0
12.3
Other
61
66
95
130
157
177
% chg
8.1
43.9
37.7
20.6
12.3
Total Expenditure
429
536
636
995
1,306
1,459
EBITDA
30
40
65
91
124
148
% chg
-
36.6
60.8
39.3
36.4
19.9
(% of Net Sales)
6.5
7.0
9.3
8.4
8.6
9.2
Depreciation& Amort.
9
10
12
16
22
24
EBIT
21
31
53
75
102
124
% chg
-
49.0
74.2
40.5
36.4
21.8
(% of Net Sales)
4.5
5.3
7.6
6.9
7.1
7.7
Interest & other Charges
11
19
16
30
36
38
Other Income
4
1
6
12
14
16
(% of sales)
0.9
0.2
0.8
1.1
1.0
1.0
Recurring PBT
9
12
38
45
66
86
% chg
-
25.3
221.6
20.0
46.8
30.0
Extraordinary Exps./(Inc.)
0
(0)
-
(0)
-
-
PBT (reported)
14
13
43
57
81
102
Tax
4
4
14
18
24
31
(% of PBT)
32.3
31.9
31.2
31.5
30.0
30.0
PAT (reported)
9
9
30
39
56
72
ADJ. PAT
9
9
30
39
56
72
% chg
-
(3.0)
232.4
31.4
44.1
26.9
(% of Net Sales)
2.0
1.6
4.3
3.6
3.9
4.5
Basic EPS (`)
12
12
39
51
74
94
Fully Diluted EPS (`)
12
12
39
51
74
94
% chg
-
(3.0)
232.4
31.4
44.1
26.9
Dividend
3
3
8
10
10
10
Retained Earning
7
6
22
30
47
62
September 21, 2011
11
Advisory Desk
TVS Srichakra
Standalone balance sheet
Y/E March (` cr)
FY2008
FY2009
FY2010
FY2011
FY2012E
FY2013E
SOURCES OF FUNDS
Equity Share Capital
8
8
8
8
8
8
Preference Capital
-
-
-
-
-
-
Reserves& Surplus
51
57
78
106
153
215
Shareholders’ Funds
59
65
86
114
161
223
Minority Interest
-
-
-
-
-
-
Total Loans
159
157
174
256
294
271
Deferred Tax Liability
8
8
8
10
10
10
Total Liabilities
225
230
268
380
465
504
APPLICATION OF FUNDS
Gross Block
127
146
192
250
270
291
Less: Acc. Depreciation
64
74
80
95
117
141
Net Block
63
72
112
155
153
151
Capital Work-in-Progress
1
1
3
10
10
10
Lease adjustment
-
-
-
-
-
-
Goodwill
-
-
-
-
-
-
Investments
1
1
3
3
3
3
Current Assets
219
213
315
481
650
732
Cash
4
13
9
5
9
12
Loans & Advances
37
27
32
37
49
55
Inventory
94
65
155
264
348
391
Debtors
85
107
119
174
243
273
Current liabilities
59
57
166
269
351
392
Net Current Assets
160
156
150
212
299
341
Misc. Exp. not written off
-
-
-
-
-
-
Deferred tax assets
-
-
-
-
-
-
Total Assets
225
230
268
380
465
504
September 21, 2011
12
Advisory Desk
TVS Srichakra
Key ratios
Y/E March
FY2008
FY2009
FY2010
FY2011
FY2012E
FY2013E
Valuation Ratio (x)
P/E (on FDEPS)
29.3
30.2
9.1
6.9
4.8
3.8
P/CEPS
14.8
14.4
6.5
4.9
3.5
2.8
P/BV
4.6
4.2
3.2
2.4
1.7
1.2
Dividend yield (%)
1.0
1.0
2.8
3.5
3.5
3.5
EV/Sales
0.9
0.7
0.6
0.5
0.4
0.3
EV/EBITDA
14.3
10.2
6.7
5.7
4.5
3.6
EV / Total Assets
1.9
1.8
1.6
1.4
1.2
1.0
Per Share Data (`)
EPS (Basic)
12.1
11.7
38.9
51.2
73.7
93.5
EPS (fully diluted)
12.1
11.7
38.9
51.2
73.7
93.5
Cash EPS
24.0
24.6
54.3
71.8
101.9
124.7
DPS
3.5
3.5
10.0
12.5
12.5
12.5
Book Value
77.2
84.8
112.1
148.7
209.9
291.0
DuPont Analysis
-
-
-
-
EBIT margin
4.5
5.3
7.6
6.9
7.1
7.7
Tax retention ratio
0.7
0.7
0.7
0.7
0.7
0.7
Asset turnover (x)
2.1
2.7
2.8
3.0
3.2
3.4
ROIC (Post-tax)
6.4
9.7
14.4
14.2
16.1
18.2
Cost of Debt (Post Tax)
4.8
8.2
6.2
7.9
8.5
9.9
Leverage (x)
2.6
2.2
1.9
2.2
1.8
1.1
Operating ROE
10.4
13.1
30.2
27.8
29.5
27.7
Returns (%)
ROCE (Pre-tax)
9.1
13.3
19.9
19.7
21.9
24.7
Angel ROIC (Pre-tax)
9.4
14.3
21.0
20.7
23.1
26.0
ROE
15.6
13.8
34.7
34.4
35.1
32.2
Turnover ratios (x)
Asset TO (Gross Block)
3.6
4.0
3.6
4.3
5.3
5.5
Inventory / Sales (days)
75
41
81
89
89
89
Receivables (days)
67
68
62
59
62
62
Payables (days)
50
39
95
99
98
98
WC cycle (ex-cash) (days)
124
90
74
70
74
75
Solvency ratios (x)
Net debt to equity
2.6
2.2
1.9
2.2
1.8
1.1
Net debt to EBITDA
5.2
3.5
2.5
2.7
2.3
1.7
Int. Coverage (EBIT/ Int.)
1.8
1.6
3.4
2.5
2.9
3.3
September 21, 2011
13
Advisory Desk
TVS Srichakra
Advisory Team Tel: (91) (022) 39500777
DISCLAIMER
This document is solely for the personal information of the recipient, and must not be singularly used as the basis of any investment
decision. Nothing in this document should be construed as investment or financial advice. Each recipient of this document should make
such investigations as they deem necessary to arrive at an independent evaluation of an investment in the securities of the companies
referred to in this document (including the merits and risks involved), and should consult their own advisors to determine the merits and
risks of such an investment.
Angel Broking Limited, its affiliates, directors, its proprietary trading and investment businesses may, from time to time, make
investment decisions that are inconsistent with or contradictory to the recommendations expressed herein. The views contained in this
document are those of the analyst, and the company may or may not subscribe to all the views expressed within.
Reports based on technical and derivative analysis center on studying charts of a stock's price movement, outstanding positions and
trading volume, as opposed to focusing on a company's fundamentals and, as such, may not match with a report on a company's
fundamentals.
The information in this document has been printed on the basis of publicly available information, internal data and other reliable
sources believed to be true, but we do not represent that it is accurate or complete and it should not be relied on as such, as this
document is for general guidance only. Angel Broking Limited or any of its affiliates/ group companies shall not be in any way
responsible for any loss or damage that may arise to any person from any inadvertent error in the information contained in this report.
Angel Broking Limited has not independently verified all the information contained within this document. Accordingly, we cannot testify,
nor make any representation or warranty, express or implied, to the accuracy, contents or data contained within this document. While
Angel Broking Limited endeavors to update on a reasonable basis the information discussed in this material, there may be regulatory,
compliance, or other reasons that prevent us from doing so.
This document is being supplied to you solely for your information, and its contents, information or data may not be reproduced,
redistributed or passed on, directly or indirectly.
Angel Broking Limited and its affiliates may seek to provide or have engaged in providing corporate finance, investment banking or
other advisory services in a merger or specific transaction to the companies referred to in this report, as on the date of this report or in
the past.
Neither Angel Broking Limited, nor its directors, employees or affiliates shall be liable for any loss or damage that may arise from or in
connection with the use of this information.
Note: Please refer to the important `Stock Holding Disclosure' report on the Angel website (Research Section). Also, please refer to the
latest update on respective stocks for the disclosure status in respect of those stocks. Angel Broking Limited and its affiliates may have
investment positions in the stocks recommended in this report.
Disclosure of Interest Statement
TVS Srichakra
1. Analyst ownership of the stock
No
2. Angel and its Group companies ownership of the stock
No
3. Angel and its Group companies' Directors ownership of the stock
No
4. Broking relationship with company covered
No
Note: We have not considered any Exposure below ` 1 lakh for Angel, its Group companies and Directors
Ratings (Returns):
Buy (> 15%)
Accumulate (5% to 15%)
Neutral (-5 to 5%)
Reduce (-5% to 15%)
Sell (< -15%)
September 21, 2011
14