2QFY2019 Result Update | IT
October 16, 2018
Tata Consultancy Services (TCS)
REDUCE
CMP
`1,918
Performance highlights
Target Price
`1,800
(` cr)
2QFY19
1QFY19 % chg (QoQ) 2QFY18
% chg (yoy)
Net revenue
36,854
34,261
7.6
30,541
20.7
Investment Period
12 Months
Adj. EBITDA
7,065
8,976
(21.3)
8,307
(14.9)
Adj. EBITDA margin (%)
28.1
26.2
27.2
Adj. PAT
7,901
7,340
7.6
6,446
22.6
Source: Company, Angel Research
Stock Info
TCS posted a
3.2% sequential growth in USD revenues to US$5,215mn v/s
Sector
IT
US$5,051mn in 1QFY2019. In rupee terms, revenues came in at `36,854cr V/s `34,261cr,
Market Cap (` cr)
719,858
up 7.6% QoQ. In Constant Currency (CC) terms, the company posted a 3.7% QoQ
Net Debt (` cr)
(45,288)
Beta
0.3
growth. On profitability front, EBIT margin showed an upside of ~148bps QoQ to
52 Week High / Low
2,273/1,214
26.5%. Consequently, PAT came in at 7,901cr v/s `7,340cr expected, up of 7.6% QoQ.
Avg. D aily Volum e
79,800
We recommend a reduce rating on the stock.
Face Value (`)
1
BSE Sensex
34,734
Quarterly highlights: TCS posted a 3.2% sequential growth in USD revenues to
Nifty
10,473
US$5,215mn v/s US$5,051mn in 1QFY2019. In Constant Currency (CC) terms, the
Reuters Code
TCS.BO
Bloom berg Code
TCS@IN
company posted a 3.7% QoQ growth. Geography wise, the growth was broadly well
spread. In terms of verticals, Life Sciences & Healthcare posted 5.7% a QoQ CC growth,
Shareholding Pattern (%)
Retail & CPG & BSFI came in next registering a QoQ CC growth of 3.4% and 3.5%
Prom oters
72.1
respectively. Other verticals like Energy & Utility & communication posted no growth
MF / Banks / Indian Fls
7.5
QoQ on CC terms. On profitability front, EBIT margin showed an upside of ~148bps
FII / NRIs / OCBs
16.1
QoQ to 26.5%. Consequently, PAT came in at 7,901cr V/s `7,340cr expected, up 7.6%
Indian Public / Others
4.4
QoQ.
Abs .(% )
3m
1 yr
3 yr
Outlook and valuation: Management expects to maintain a double-digit yoy
Sensex
(5.0)
7.9
29.1
growth trajectory over the next two quarters and hopes to exit 4QFY2019 at a
TCS
(2.7)
50.5
48.0
better run-rate than 4QY2018. We maintain our 9.7% USD revenue CAGR in
FY2018-20E. The stock is trading at 21.3x FY2020E EPS of `89.9.Valuations
already discount a robust medium growth & favorable operating
environment and valuations are higher than its P/E averages. However,
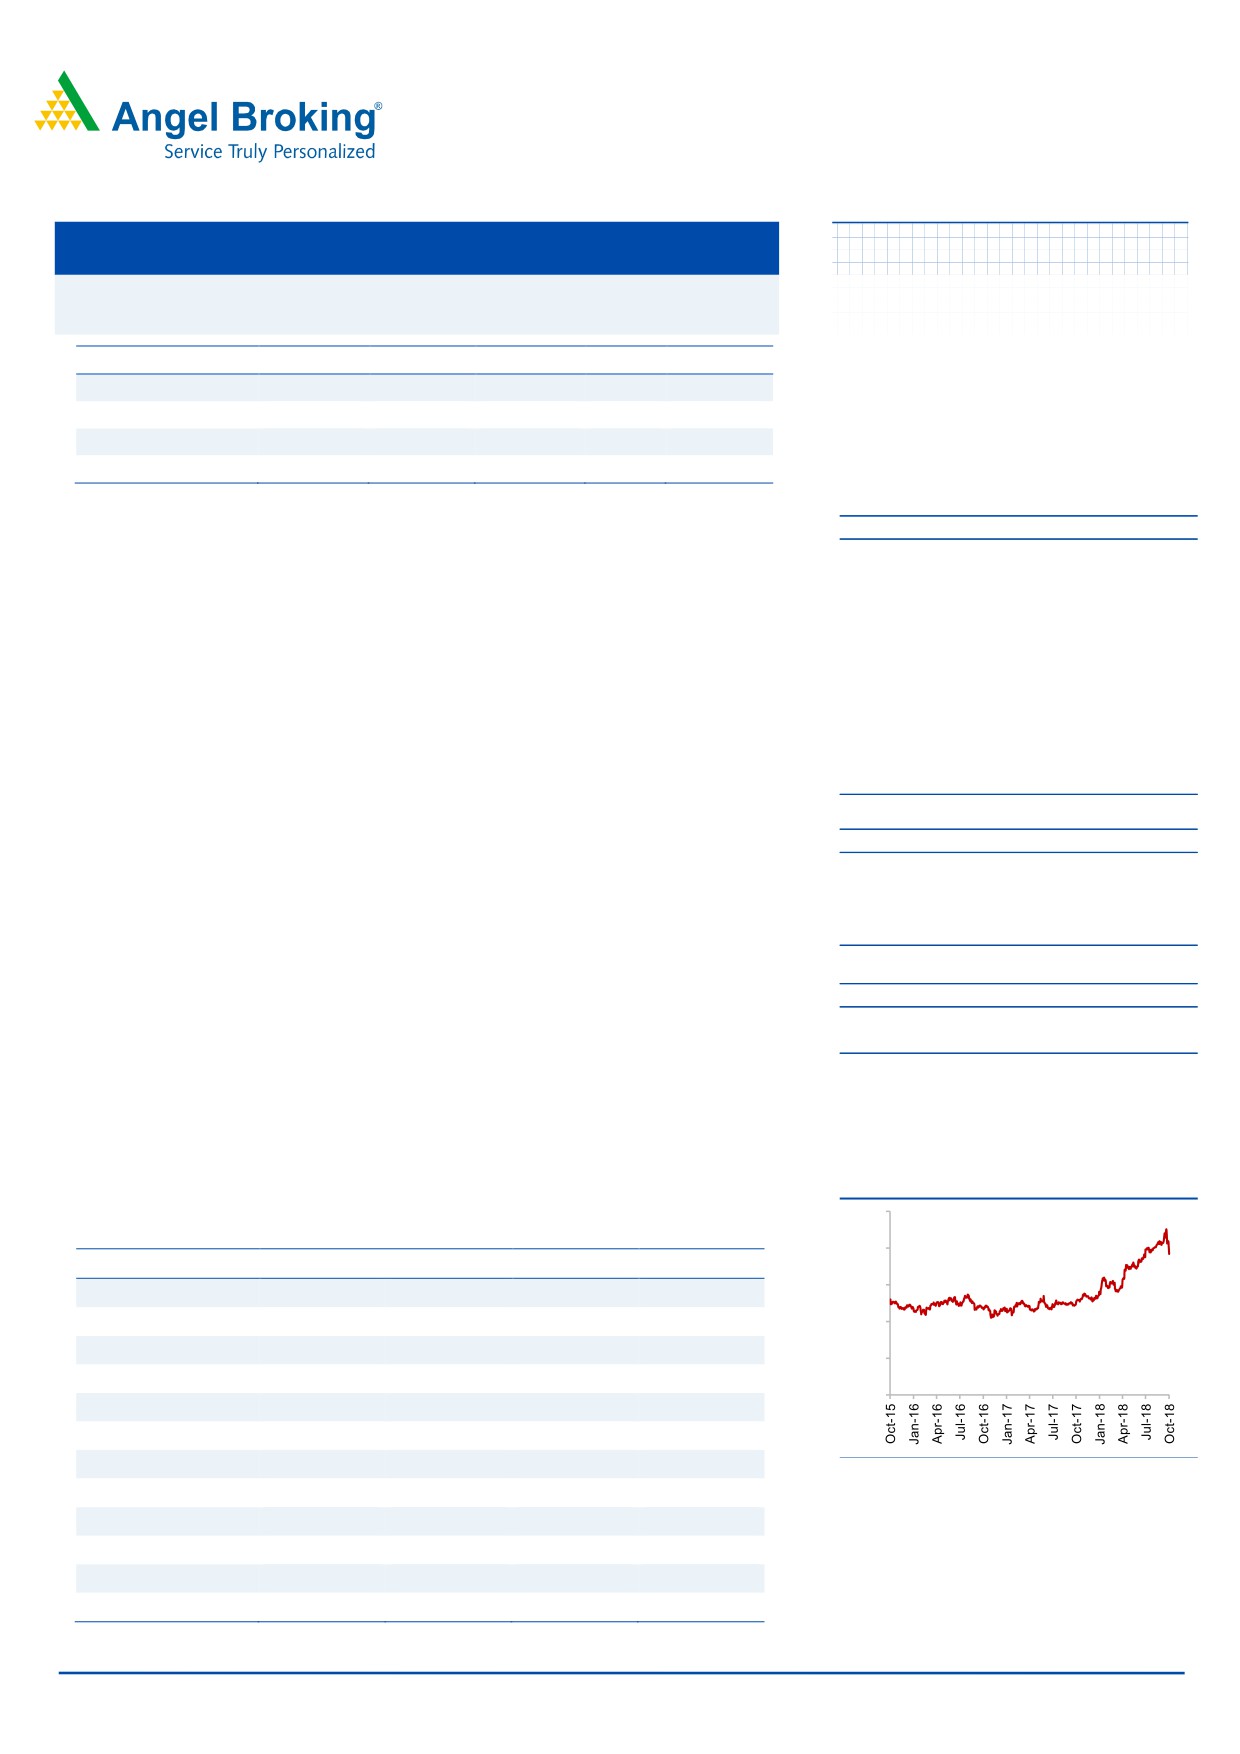
3-Year Daily Price Chart
given the good cash yield we recommend a Reduce.
2,500
Key financials (Consolidated, IFRS)
2,000
Y/E March (` cr)
FY2017
FY2018
FY2019E
FY2020E
1,500
Net sales
117,966
123,104
148,455
162,558
% chg
8.6
4.4
20.6
9.5
1,000
Net profit
26,289
25,826
31,851
34,370
500
% chg
8.6
(1.8)
23.3
7.9
0
EBITDA margin (%)
27.5
26.6
27.6
27.4
EPS (`)
68.7
67.5
83.3
89.9
P/E (x)
27.9
28.4
23.0
21.3
Source: Company, Angel Research
P/BV (x)
8.3
8.4
7.3
6.4
RoE (%)
29.8
29.5
31.6
29.9
RoCE (%)
28.8
28.0
31.2
29.9
Sarabjit kour Nangra
EV/Sales (x)
5.7
5.5
4.5
4.0
+91 22 3935 7800 Ext: 6806
EV/EBITDA (x)
20.8
20.6
16.1
14.5
sarabjit @angelbroking.com
Source: Company, Angel Research; Note: CMP as of October 12, 2018
Please refer to important disclosures at the end of this report
1
TCS | 2QFY2019 Result Update
Exhibit 1: 2QFY2019 performance (Consolidated, IFRS)
(` cr)
2QFY2019 1QFY2019
% chg (QoQ) 2QFY2018
% chg (yoy) 1HFY2019 1HFY2018 % chg(yoy)
Net revenue
36,854
34,261
7.6
30,541
20.7
71,115
60,125
18.3
Cost of revenue
20,607
19,685
4.7
17,218
19.7
40,292
32,755
23.0
Gross profit
16,247
14,576
11.5
13,323
21.9
30,823
27,370
12.6
SG&A expense
5,883
5,600
5.1
5,270
11.6
11,483
11,793
(2.6)
EBITDA
10,364
8,976
15.5
8,053
28.7
19,340
15,577
24.2
Dep. and Amortization
593
398
49.0
393
50.9
991
1,003
(1.2)
EBIT
9,771
8,578
13.9
7,660
27.6
18,349
14,574
25.9
Other income
593
1,208
(50.9)
812
(27.0)
1,801
1,744
3.3
PBT
10,364
9,786
5.9
8,472
22.3
20,150
16,318
23.5
Income tax
2,437
2,424
0.5
2,012
21.1
4,861
3,908
24.4
PAT
7,927
7,362
7.7
6,460
22.7
15,289
12,410
23.2
Earnings in affiliates
-
-
-
-
-
-
-
Minority interest
26
22
14
-
-
-
Reported PAT
7,901
7,340
7.6
6,446
22.6
15,289
12,410
23.2
Adj. PAT
7,901
7,340
7.6
6,446
22.6
15,289
12,410
23.2
EPS
20.7
19.2
7.8
16.8
22.7
40.0
32.4
23.2
Gross margin (%)
44.1
42.5
154bp
43.6
46bp
43.3
45.5
(218)bp
EBITDA margin (%)
28.1
26.2
192bp
26.4
175bp
27.2
25.9
129bp
EBIT margin (%)
26.5
25.0
148bp
25.1
143bp
25.8
24.2
156bp
Source: Company, Angel Research
Key geographies & verticals doing well
TCS posted a 3.2% sequential growth in USD revenues to US$5,215mn v/s US$5,051mn
in 1QFY2019. In Constant Currency (CC) terms, the company posted a 3.7% QoQ growth.
Geography wise, the growth was broadly well spread. USA - North America & Latin
America registered a QoQ CC growth of 2.6% and 7.1% respectively. In Europe- UK &
Continental Europe registered a QoQ CC growth of 6.0% and 4.1% respectively. India &
Asia Pacific registered a QoQ CC growth of 5.0% and 4.5% respectively.
In terms of verticals, Life Sciences & Healthcare posted 5.7% a QoQ CC growth, Retail &
CPG & BSFI came in next registering a QoQ CC growth of 3.4% and 3.5% respectively.
Other verticals like Energy & Utility & communication posted no growth QoQ on CC
terms. Manufacturing posted a decent QoQ Cc growth of 1.6%, while Technology
services posted a QoQ Cc growth of 2.3%. Growth in Digital was 16.5% QoQ in CC terms
and it now constitutes to 28.1% of total revenue. On a YoY basis, Digital revenue grew
by 59.8% in CC terms.
October 16, 2018
2
TCS | 2QFY2019 Result Update
Exhibit 2: Revenue growth (Industry wise on CC basis)
% to revenue
% chg (CC QoQ)
% chg (yoy)
BFSI
31.2
3.5
6.1
Manufacturing
7.2
1.6
6.9
Communication & Media
6.9
0.0
8.0
Life sciences and healthcare
7.5
5.7
14.7
Retail and CPG
16.6
3.4
15.6
Energy and utilities
4.6
0.0
22.2
Technology & Services
7.6
2.3
5.8
Regional Markets & Others
18.4
7.3
19.8
Source: Company, Angel Research
Exhibit 3: Revenue growth (Geography wise in INR terms)
% of revenue
% chg (CC QoQ)
% chg (yoy)
U.S.
51.1
2.6
8.1
Latin America
2.0
7.1
6.8
U.K.
15.6
6.0
22.8
Continental Europe
14.0
4.1
17.4
India
5.6
5.0
7.4
Asia Pacific
9.6
4.5
12.5
MEA
2.1
0.3
(4.4)
Source: Company, Angel Research
Attrition rate dips
In 2QFY2019, TCS witnessed a gross addition of 12,534 employees and net addition of
5,877 employees, taking its total employee base to 4,11,102. During the quarter, the
attrition rate (last twelve-month [LTM] basis) for the company decreased to 10.9% from
11.7% in 1QFY2019.
Exhibit 4: Hiring & attrition trend
Particulars
2QFY18 3QFY18
4QFY18
1QFY19
2QFY19
Gross addition
15,868
12,534
11,202
15,868
12,534
Net addition
(1,414)
3,404
1,667
4,118
5,877
Total employee base
3,89,213
3,90,880
3,94,998
4,00,875
4,11,102
Attrition (%) - LTM basis
12.1
11.9
11.8
11.7
10.9
Source: Company, Angel Research
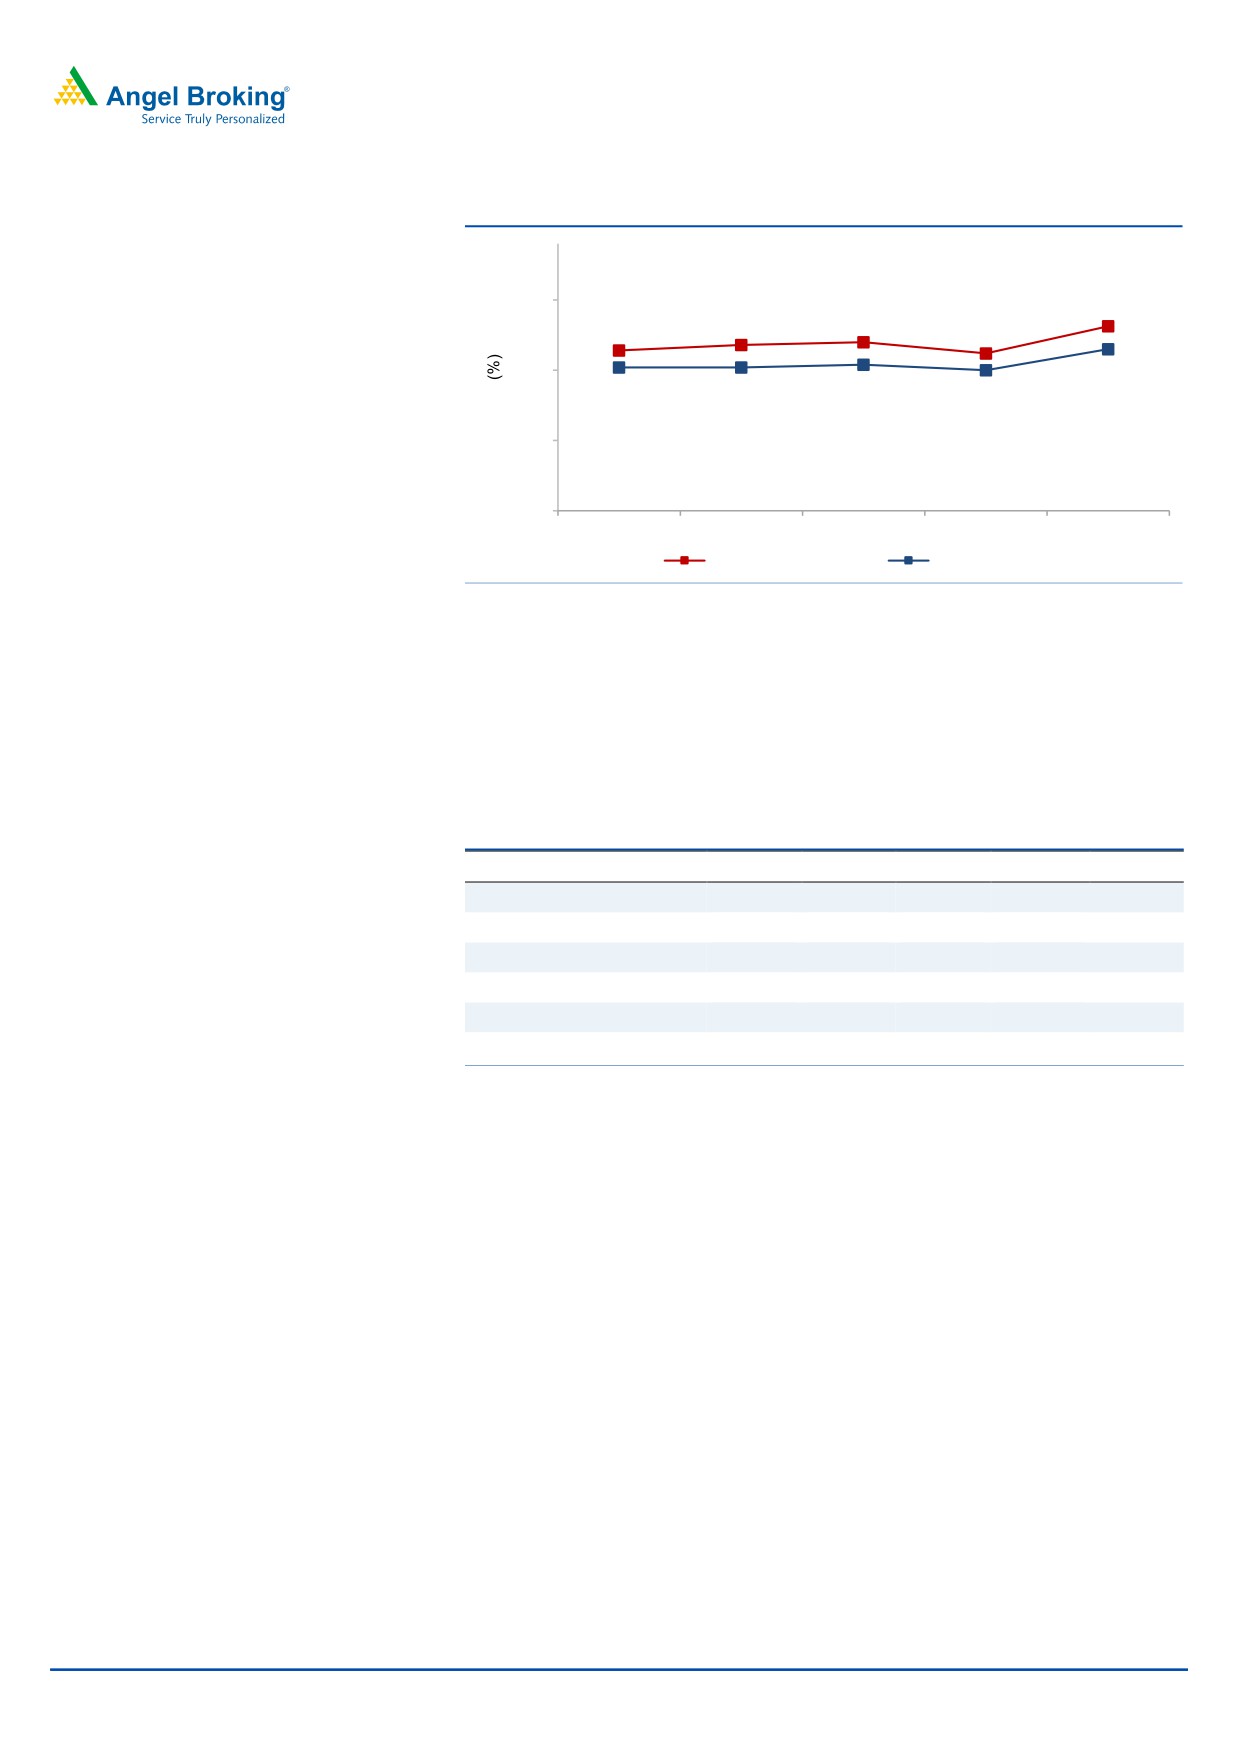
Margin expands; mainly driven by exchange gains
On the operating front, the company reported EBITDA and EBIT margins at 28.1%
and 26.5%, i.e. an expansion of 192ps and 148bps QoQ respectively. A major part
of the expansion was exchange gains (120bps), operational efficiency (30bps). The
company has maintained an EBIT margin target of 26-28%.
October 16, 2018
3
TCS | 2QFY2019 Result Update
Exhibit 5: Adj. Margin profile (%)
30
28.1
26.8
27.0
26.4
26.2
25
26.5
25.2
25.2
25.4
25.0
20
15
2QFY18
3QFY18
4QFY18
1QFY19
2QFY19
EBITDA margin
EBIT margin
Source: Company, Angel Research
Client metrics
The client pyramid during the quarter witnessed a qualitative improvement with
client additions seen in the higher revenue brackets. The clients in US$20mn+
revenue band increased by 6 and in US$100mn+ revenue band increased by 4.
Exhibit 6: Client pyramid
2QFY18 3QFY18 4QFY18 1QFY19 2QFY19
US$1mn-5mn
463
456
468
470
476
US$5mn-10mn
142
148
145
153
148
US$10mn-20mn
132
134
143
149
152
US$20mn-50mn
105
109
110
109
115
US$50mn-100mn
54
57
59
57
54
US$100mn plus
37
37
38
40
44
Source: Company, Angel Research
Outlook & Valuations
Management expects to maintain a double-digit yoy growth trajectory over the
next two quarters and hopes to exit 4QFY2019 at a better run-rate than 4QY2018.
We maintain our 9.7% USD revenue CAGR in FY2018-20E. Over FY2018-20E, we
expect TCS to post revenue CAGR of 9.7% & 14.9% in USD & INR terms respectively.
The company highlighted that it stands comfortable in sustaining the EBIT margin
in the range of 26-28%. On the EBIT and PAT fronts, we expect the company to post
17.7% and 15.4% CAGR over FY2018-20E respectively. The stock is trading at 21.3x
FY2020E EPS of `89.9. Valuations already discount a robust medium growth and
favorable operating environment and is at slight premium to its long-term
P/E averages. However, given the cash yield we recommend a reduce.
October 16, 2018
4
TCS | 2QFY2019 Result Update
Exhibit 7: Key assumptions
FY2019E
FY2020E
Revenue growth (USD)
10.0
9.5
USD-INR rate (realized)
70.7
70.7
Revenue growth (%)
20.6
9.5
EBITDA margin (%)
27.6
27.4
Tax rate (%)
25.0
25.0
EPS growth (%)
23.3
7.9
Source: Company, Angel Research
Company background
TCS is Asia's largest IT services provider and is amongst the top 10 technology firms
in the world. The company has a global footprint with an employee base of over
4lakh professionals, offering services to more than 1,000 clients across various
industry segments. The company has one of the widest portfolios of service
offerings, spanning across the entire IT service value chain - from traditional
application development and maintenance to consulting and package
implementation to products and platforms.
October 16, 2018
5
TCS | 2QFY2019 Result Update
Profit & Loss statement (Consolidated, IFRS)
Y/E March (` cr)
FY2016
FY2017
FY2018
FY2019E FY2020E
Net sales
108,646
117,966
123,104
148,455
162,558
Cost of revenue
58,952
64,764
69,072
82,986
90,870
Gross profit
49,695
53,202
54,032
65,469
71,688
% of net sales
45.7
45.1
43.9
44.1
44.1
SGA expenses
18,956
20,755
21,314
24,495
27,147
% of net sales
17.4
17.6
17.3
16.5
16.7
EBITDA
30,738
32,447
32,718
40,974
44,541
% of net sales
28.3
27.5
26.6
27.6
27.4
Dep. and amortization
1948
2123
2216
2078
2276
% of net sales
1.8
1.8
1.8
1.4
1.4
EBIT
28,790
30,324
30,502
38,895
42,265
% of net sales
26.5
25.7
24.8
26.2
26.0
Other income, net
3050
4189
3590
3700
3700
Profit before tax
31,840
34,513
34,092
42,595
45,965
Provision for tax
7,503
8,156
8,212
10,649
11,491
% of PBT
23.6
23.6
24.1
25.0
25.0
PAT
24,338
26,357
25,880
31,946
34,474
Minority interest
123
68
54
96
103
Extra-ordinary (Exp.)/ Inc.
Reported PAT
24,215
26,289
25,826
31,851
34,370
Adj. PAT
24,215
26,289
25,826
31,851
34,370
Diluted EPS (`)
63.3
68.7
67.5
83.3
89.9
October 16, 2018
6
TCS | 2QFY2019 Result Update
Balance sheet (Consolidated, IFRS)
Y/E March (` cr)
FY2016 FY2017
FY2018 FY2019E FY2020E
Assets
Cash and cash equivalents
1,862
3,597.0
4,883.0
5,240.4
5,326.2
Other current financial assets
4,833
-
6,395
6,395
6,395
Accounts receivable
24,073
22,684
24,943
27,437
30,181
Unbilled revenues
3,992
5,351
6,686
8,063
8,829
Other current assets
5,975
7,258
2,610
2,610
2,610
Property and equipment
11,790
11,741
11,600
11,700
11,800
Intangible assets and goodwill
3,946
3,768
3,896
3,896
3,896
Investments
22,822
41,980
36,008
47,215
60,402
Other non-current assets
11,919
8,974
12,034
12,034
12,034
Total assets
91,212
1,05,353
1,09,055
1,24,591
1,41,473
Liabilities
Current liabilities
15,407
14,294
17,828
20,146
22,765
Short term borrowings
162
218
193
193
193
Redeemable preference shares
(0)
-
-
-
-
Long term debt
83
71
54
54
54
Other non-current liabilities
2,017
2,089
2,935
2,935
2,935
Minority interest
354
366
402
402
402
Shareholders’ funds
73,190
88,315
87,643
100,861
115,125
Total liabilities
91,212
1,05,353
1,09,055
1,24,591
1,41,473
October 16, 2018
7
TCS | 2QFY2019 Result Update
Cash flow statement (Consolidated, IFRS)
Y/E March (` cr)
FY2016
FY2017
FY2018 FY2019E FY2020E
Pre-tax profit from oper.
24,338
26,357
25,880
31,946
34,474
Depreciation
1,948
2,123
2,216
2,078
2,276
174
-
-
-
-
Exp. (deferred)/written off
Pretax cash from oper
26,460
28,480
28,096
34,025
36,750
Other inc./prior period ad
1,948
2,123
2,216
2,078
2,276
Net cash from operations
28,408
30,604
30,312
36,103
39,026
Tax
7,503
8,156
8,212
10,649
11,491
Cash profits
20,905
22,448
22,100
25,454
27,534
(Inc)/dec in acc. recv.
(3,633)
1,389
(2,259)
(2,494)
(2,744)
(Inc)/dec in unbilled rev.
(165)
(1,359)
(1,335)
(1,377)
(766)
(Inc)/dec in oth. current asst.
439
(1,283)
4,648
-
-
Inc/(dec) in current liab.
(218)
49
141
(100)
(100)
Net trade working capital
(3,577)
(1,204)
1,195
(3,971)
(3,610)
Cash flow from opert. actv.
17,328
21,243
23,295
21,483
23,925
(Inc)/dec in fixed assets
(218)
49
141
(100)
(100)
(Inc)/dec in investments
(1,653)
(14,325)
(423)
(11,207)
(13,187)
(Inc)/dec in intangible asst.
16
(178)
128
-
-
(Inc)/dec in non-cur.asst.
(11,013)
2,945
(3,060)
-
-
Cash flow from invt. actv.
(12,869)
(11,509)
(3,214)
(11,307)
(13,287)
Inc/(dec) in debt
(113)
44
(42)
-
-
Inc/(dec) in minority int.
(559)
12
36
-
-
Dividends
(18,415)
(19,993)
(11,258)
(18,633)
(20,107)
Others
14,629
10,202
(8,816)
8,456
9,469
Cash flow from finan. actv.
(4,459)
(9,735)
(20,080)
(10,177)
(10,638)
Cash generated/(utilized)
-
1,735
1,286
357
86
Cash at start of the year
1,862
1,862
3,597
4,883
5,240
Cash at end of the year
1,862
3,597
4,883
5,240
5,326
October 16, 2018
8
TCS | 2QFY2019 Result Update
Key ratios
Y/E March
FY2016 FY2017 FY2018 FY2019E FY2020E
Valuation ratio(x)
P/E (on FDEPS)
30.3
27.9
28.4
23.0
21.3
P/CEPS
28.0
25.8
26.2
21.6
20.0
P/BVPS
10.0
8.3
8.4
7.3
6.4
Dividend yield (%)
2.1
2.3
1.3
2.1
2.3
EV/Sales
6.4
5.7
5.5
4.5
4.0
EV/EBITDA
22.5
20.8
20.6
16.1
14.5
EV/Total assets
7.6
6.4
6.2
5.3
4.6
Per share data (`)
EPS
63.3
68.7
67.5
83.3
89.9
Cash EPS
68.4
74.3
73.3
88.7
95.8
Dividend
40.2
43.6
24.6
40.6
43.9
Book value
191
231
229
263
301
DuPont analysis
Tax retention ratio (PAT/PBT)
0.8
0.8
0.8
0.8
0.8
Cost of debt (PBT/EBIT)
1.1
1.1
1.1
1.1
1.1
EBIT margin (EBIT/Sales)
0.3
0.3
0.2
0.3
0.3
Asset turnover ratio (Sales/Assets)
1.2
1.1
1.1
1.2
1.1
Leverage ratio (Assets/Equity)
1.2
1.2
1.2
1.2
1.2
Operating ROE
33.3
29.8
29.5
31.7
29.9
Return ratios (%)
RoCE (pre-tax)
31.6
28.8
28.0
31.2
29.9
Angel RoIC
46.7
50.7
49.4
59.2
60.9
RoE
33.1
29.8
29.5
31.6
29.9
Turnover ratios(x)
Asset turnover (fixed assets)
9.2
10.0
10.6
12.7
13.8
Receivables days
81
70
74
67
68
October 16, 2018
9
TCS | 2QFY2019 Result Update
Research Team Tel: 022 - 39357800
DISCLAIMER
Angel Broking Limited (hereinafter referred to as “Angel”) is a registered Member of National Stock Exchange of India Limited, Bombay
Stock Exchange Limited, Metropolitan Stock Exchange Limited, Multi Commodity Exchange of India Ltd and National Commodity &
Derivatives Exchange Ltd It is also registered as a Depository Participant with CDSL and Portfolio Manager and Investment Adviser with
SEBI. It also has registration with AMFI as a Mutual Fund Distributor. Angel Broking Limited is a registered entity with SEBI for Research
Analyst in terms of SEBI (Research Analyst) Regulations, 2014 vide registration number INH000000164. Angel or its associates has not
been debarred/ suspended by SEBI or any other regulatory authority for accessing /dealing in securities Market. Angel or its
associates/analyst has not received any compensation / managed or co-managed public offering of securities of the company covered
by Analyst during the past twelve months.
This document is solely for the personal information of the recipient, and must not be singularly used as the basis of any investment
decision. Nothing in this document should be construed as investment or financial advice. Each recipient of this document should make
such investigations as they deem necessary to arrive at an independent evaluation of an investment in the securities of the companies
referred to in this document (including the merits and risks involved), and should consult their own advisors to determine the merits
and risks of such an investment.
Reports based on technical and derivative analysis center on studying charts of a stock's price movement, outstanding positions and
trading volume, as opposed to focusing on a company's fundamentals and, as such, may not match with a report on a company's
fundamentals. Investors are advised to refer the Fundamental and Technical Research Reports available on our website to evaluate the
contrary view, if any
The information in this document has been printed on the basis of publicly available information, internal data and other reliable
sources believed to be true, but we do not represent that it is accurate or complete and it should not be relied on as such, as this
document is for general guidance only. Angel Broking Limited or any of its affiliates/ group companies shall not be in any way
responsible for any loss or damage that may arise to any person from any inadvertent error in the information contained in this report.
Angel Broking Limited has not independently verified all the information contained within this document. Accordingly, we cannot
testify, nor make any representation or warranty, express or implied, to the accuracy, contents or data contained within this document.
While Angel Broking Limited endeavors to update on a reasonable basis the information discussed in this material, there may be
regulatory, compliance, or other reasons that prevent us from doing so.
This document is being supplied to you solely for your information, and its contents, information or data may not be reproduced,
redistributed or passed on, directly or indirectly.
Neither Angel Broking Limited, nor its directors, employees or affiliates shall be liable for any loss or damage that may arise from or in
connection with the use of this information.
Disclosure of Interest Statement
TCS
1. Financial interest of research analyst or Angel or his Associate or his relative
No
2. Ownership of 1% or more of the stock by research analyst or Angel or associates or
No
relatives
3. Served as an officer, director or employee of the company covered under Research
No
4. Broking relationship with company covered under Research
No
Ratings (Based on expected returns
Buy (> 15%)
Accumulate (5% to 15%)
Neutral (-5 to 5%)
over 12 months investment period):
Reduce (-5% to -15%)
Sell (< -15)
October 16, 2018
10