1
Derivatives Rollover Report |June 26,
2020
For Private Circulation Only
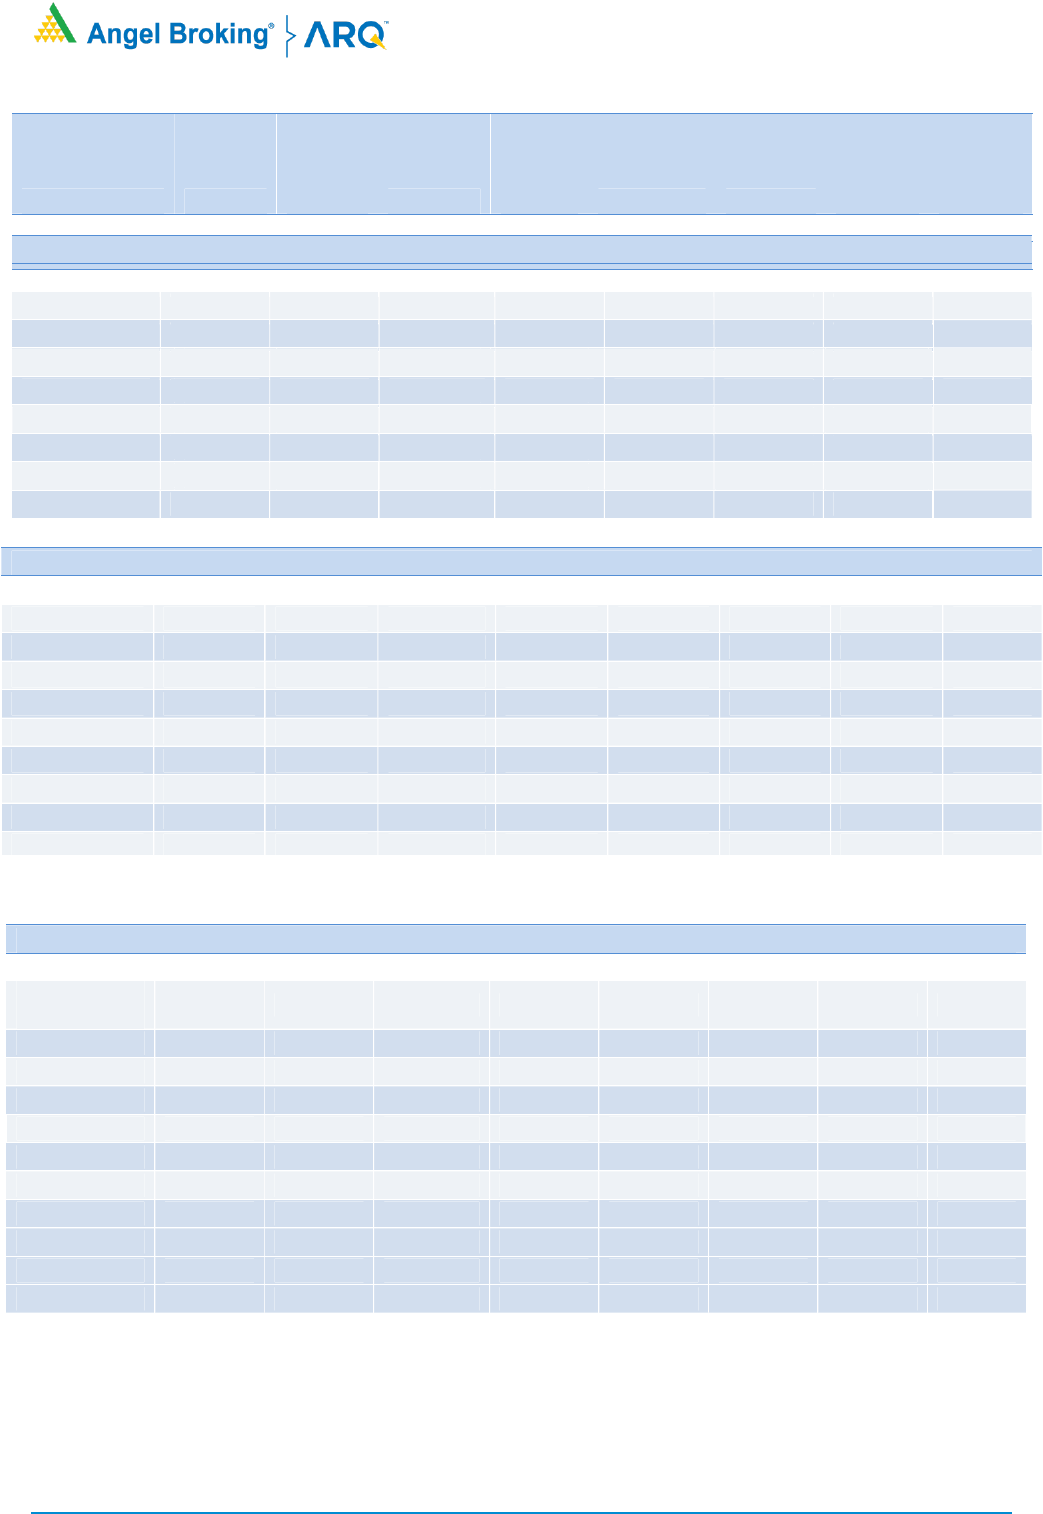
NIFTY & PCR Graph
Monthly Gainers
Scrip Price
Price
Change
(%)
Open
Interest
Ol
Change
(%)
IBULHSGFIN 226.30
92.11
12198500
(13.90)
IDEA 9.95
67.23
173040000
(42.83)
RBLBANK 186.75
60.23
16226600
4.95
BAJFINANCE 2994.55
54.75
6521750
3.16
BANDHANBNK
336.75
53.84
9739800
(18.62)
Note: Stocks which have more than 1000 contract in Futures OI.
Monthly Losers
Scrip Price
Price
Change
(%)
Open
Interest
Ol
Change
(%)
NIITTECH
1381.80
(6.00)
510000
48.31
EXIDEIND
150.55
(5.08)
10875600
114.89
IGL
445.25
(4.98)
7657375
94.92
ZEEL
172.60
(3.36)
23085000
(16.75)
JUSTDIAL
365.30
(3.05)
1122800
(22.14)
Note: Stocks which have more than 1000 contract in Futures OI.
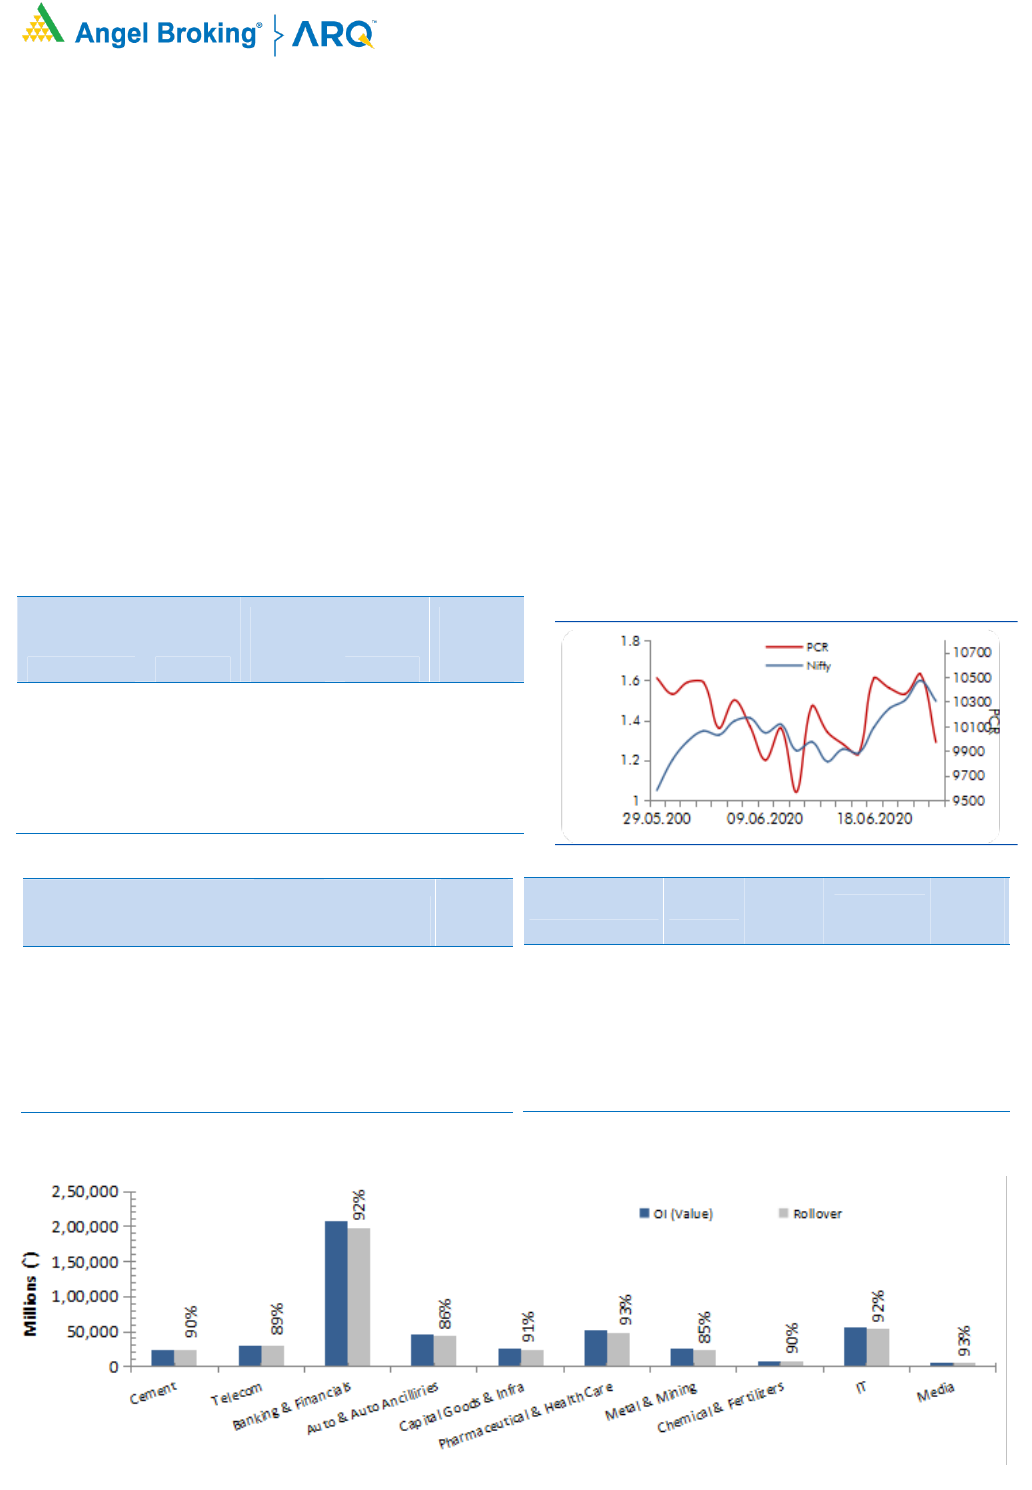
Post forming a support base near the 9000 mark in May series, the index started the June series on an optimistic note
around 9400. Within a few sessions, Nifty su
rpassed the 10000 mark and registered a high around 10300. The index
corrected during mid of the series upto 9600, but traders took this decline as an opportunity to buy and the Nifty resumed
the momentum to test the 10500 mark ahead of expiry.
During th
e series, Nifty witnessed formation of long positions whereas a combination of short covering and long formation
was seen in the Bank Nifty. Rollover in Nifty is at 79% v/s 3-
month average of 75%; whereas rollover in BankNifty is at 81%,
which is in line w
ith its average. We witnessed a good amount of long formation in the June series and higher rollovers
indicate long positions being rolled. However, FII’s have not rolled much of their index futures long positions. Hence, their
‘Long Short’ Ratio at the st
art of the series stands around 42 percent. If we look at the stock specific data, many beaten
down counters witnessed sharp up move with good amount of open interest addition.
As per the options data, 10000 - 10500 is seen as the immediate trading range
for Nifty. Since the data indicates long
positions being rolled, traders are advised to continue to trade with a positive bias and use declines as a buying
opportunity.
Indices Change
INDEX Price
Price
Change
(%) Rollover
3
month
avg.
NIFTY
10288.90 8.67 78.93
75.30
BANKNIFTY
21506.15 12.66 80.60
81.11
-
- -
- -
-
- - - -
-
- - - -
Derivatives Rollover Report
For Private Circulation Only
2
Scrip Price
Price
Change
(%) OI Futures
OI
Change
(%) COC (%) PCR-OI
Rollover
(%)
Average
Rollover
(3month)
(%)
AUTO & AUTO ANCILLARIES
AMARAJABAT 643.10
4.70
1796000
41.15
4.64
0.66
97.02
97.58
APOLLOTYRE 112.60
15.13
10195000
27.60
2.79
0.62
95.21
93.71
ASHOKLEY 53.65
23.90
30663000
(54.49)
3.90
1.06
84.17
92.36
BAJAJ-AUTO 2828.45
8.97
1788250
(6.42)
2.96
0.67
96.98
97.36
BALKRISIND 1238.00
14.20
840800
(32.76)
0.89
0.46
74.01
85.76
BHARATFORG 358.15
17.14
5592000
(1.06)
2.04
0.24
96.70
95.36
BOSCHLTD 11475.40
17.15
130950
(15.24)
2.59
0.02
99.24
98.77
EICHERMOT 18110.10
12.51
275415
2.86
1.13
0.78
95.30
96.45
ESCORTS 1031.50
17.48
2597100
8.45
0.56
0.79
89.64
90.74
EXIDEIND 150.55
(5.08)
10875600
114.89
3.13
0.99
80.21
91.78
HEROMOTOCO 2532.85
10.89
2778900
35.23
-10.92
0.52
95.57
93.21
M&M 506.20
15.53
17546200
24.75
-2.16
0.51
96.36
96.60
MARUTI 5780.10
6.37
2885900
(5.12)
3.23
0.79
96.57
96.50
MOTHERSUMI 96.40
4.73
22652000
(11.18)
3.80
0.65
97.88
94.90
MRF 64842.30
11.42
15360
(7.08)
0.45
0.80
99.10
93.23
TATAMOTORS 104.20
19.77
77964600
(0.28)
4.02
0.73
89.07
93.32
TVSMOTOR 380.00
16.01
3837400
(2.86)
-8.98
0.15
94.29
93.84
BANKING & FINANCIALS
AXISBANK 422.20
8.17
64340400
10.74
1.24
0.73
96.40
97.64
BAJAJFINSV 6041.70
41.59
758375
(7.02)
3.58
0.88
92.81
94.36
BAJFINANCE 2994.55
54.75
6521750
3.16
-3.73
1.07
91.02
93.58
BANKBARODA 52.20
35.41
42943400
(13.63)
4.01
0.60
91.11
93.45
CANBK 105.10
26.09
10805000
31.68
2.99
0.72
93.37
93.59
CHOLAFIN 202.70
50.76
6937500
4.32
-16.46
0.98
88.24
88.85
EQUITAS 54.60
28.77
12464000
15.46
4.80
0.59
80.84
89.04
FEDERALBNK 52.40
22.72
59916500
(9.50)
4.00
0.63
92.13
95.06
HDFC 1762.95
9.03
29694900
(1.82)
-8.80
0.65
99.14
98.12
HDFCBANK 1025.15
9.28
34631850
3.18
-3.65
0.70
95.93
95.07
IBULHSGFIN 226.30
92.11
12198500
(13.90)
-4.59
1.10
83.08
91.07
ICICIBANK 352.25
7.94
111718750
17.32
3.71
0.55
97.45
97.22
ICICIPRULI 429.15
17.05
7044000
(24.67)
2.19
0.30
94.24
94.76
INDUSINDBK 477.55
23.86
29800800
45.92
5.27
0.73
95.88
95.52
KOTAKBANK 1371.75
12.45
8765200
(9.18)
-7.51
0.96
89.70
93.40
L&TFH 70.85
32.68
22168000
(8.24)
2.21
0.66
79.29
89.99
LICHSGFIN 269.05
11.29
7922000
(2.55)
2.53
0.52
84.72
86.66
M&MFIN 179.65
31.47
11310600
(28.19)
2.33
0.39
90.37
91.93
Derivatives Rollover Report
For Private Circulation Only
3
Scrip Price
Price
Change
(%) OI Futures
OI
Change
(%) COC (%) PCR-OI
Rollover
(%)
Average
Rollover
(3month)
(%)
MANAPPURAM 157.80
31.28
14262000
(6.05) 2.32
0.78
91.85
93.64
MFSL 531.40
14.33
1501500
(31.94) -8.95
0.72
90.02
89.71
MUTHOOTFIN 1106.95
30.36
2999250
41.21
2.08
0.91
86.13
87.74
PFC 90.45
17.39
46208600
21.34
5.21
0.79
97.77
97.54
PNB 37.35
40.94
45934000
(15.54) 7.03
0.50
94.08
95.67
RBLBANK 186.75
60.23
16226600
4.95
-17.30
0.77
89.63
83.11
RECLTD 115.00
31.20
13662000
(31.50) 4.10
0.65
91.81
94.59
SBIN 185.15
17.71
104907000
(9.71) -0.56
0.64
96.54
96.45
SRTRANSFIN 691.35
21.93
2582450
(12.69) 1.36
0.53
87.78
90.40
UJJIVAN 220.75
31.24
2536600
(42.71) -3.77
0.79
90.32
91.35
CAPITAL GOODS & INFRASTRUCTURE
ADANIPORTS 345.50
4.52
30787500
(10.73) 4.55
0.46
99.36
97.83
BHEL 38.05
41.71
49329000
(21.09) 5.51
0.60
91.02
90.80
GMRINFRA 20.55
16.43
77895000
56.51
5.10
0.49
91.44
93.69
HAVELLS 579.25
16.44
5117000
(20.11) -0.27
0.32
97.41
97.17
LT 944.60
5.05
9115700
(26.27) 1.66
0.39
71.81
87.56
SIEMENS 1110.15
3.79
2279750
9.22
-0.09
0.48
98.46
94.49
VOLTAS 551.85
13.95
3635000
0.44
-0.47
0.36
89.82
89.84
CEMENT
ACC 1253.60
(1.31)
2218500
40.67
2.08
0.33
98.67
95.18
AMBUJACEM 186.80
(1.86)
18279000
7.72
3.08
0.54
98.93
97.08
GRASIM 608.70
6.01
18593400
(4.17) 2.15
0.87
98.21
98.06
RAMCOCEM 625.30
1.75
996200
49.30
-12.03
0.33
96.51
96.24
SHREECEM 22140.35
6.91
136700
(6.40) 3.40
0.47
98.06
97.07
ULTRACEMCO 3808.15
0.21
2227000
(5.79) 1.38
0.65
93.62
96.04
CHEMICALS & FERTILIZERS
PIDILITIND 1384.85
(2.40)
3386500
29.70
2.19
0.70
98.66
97.80
TATACHEM 316.40
8.86
1426000
(34.20)
-2.96
0.65
92.10
89.07
UPL
439.70
13.12
9271600
(10.19)
-
7.53
0.54
87.25
82.11
Consumer Goods & FMCG
ASIANPAINT 1693.40
3.74
5283300
(7.61)
2.72 0.58
97.14
95.53
BERGEPAINT 522.45
13.58
4159100
5.50
4.51 0.33
98.31
93.99
BRITANNIA 3460.20
5.00
1609400
(0.32)
2.96 0.68
86.55
85.94
COLPAL 1403.10
9.35
2071300
(1.47)
4.10 0.49
97.40
85.64
CONCOR
556.00
(5.86)
7139784
40.51
7.43
0.32
99.05
94.03
Derivatives Rollover Report
For Private Circulation Only
4
Scrip Price
Price
Change
(%) OI Futures
OI
Change
(%) COC (%) PCR-OI Rollover (%)
Average
Rollover
(3month)
(%)
DABUR 460.00
3.14
12241250
2.52
1.93
0.28
87.96
92.46
GODREJCP 678.70
12.45
6193000
9.40
3.70
0.20
99.22
89.26
HINDUNILVR 2170.10
8.66
17140800
(1.69)
-1.46
0.70
91.56
91.38
ITC 200.40
6.85
71888000
69.02
-8.77
0.47
86.31
73.94
JUBLFOOD 1775.75
7.85
2321500
4.15
-4.21
0.74
87.00
84.27
MARICO 342.65
4.15
10832000
(2.13)
3.05
0.21
99.13
97.53
MCDOWELL-N 603.55
7.20
12960000
34.20
4.25
0.54
98.09
97.80
NESTLEIND 16813.10
(0.42)
507350
30.54
1.63
0.45
99.15
89.05
TATACONSUM 385.30
5.30
12622500
79.53
3.53
0.27
97.31
91.61
TITAN 980.80
9.80
6340500
(11.40)
3.41
0.44
96.92
96.29
UBL
1045.90
11.04
721700
(17.72)
-3.13
0.54
94.85
93.59
MEDIA
METALS & MINING
COALINDIA 140.60
5.40
33721800
(3.01)
1.49
0.50
90.61
94.79
HINDALCO 147.05
6.95
31497500
10.53
3.20
0.67
94.06
92.06
JINDALSTEL 150.25
27.33
13400000
(8.53)
3.13
0.66
83.26
90.01
JSWSTEEL 192.30
4.65
38907000
21.89
-6.74
0.82
98.74
97.35
NATIONALUM 34.30
16.67
36618000
51.28
6.12
0.55
94.88
93.51
NMDC 84.70
8.10
25721300
(11.13)
5.57
0.51
97.14
96.85
SAIL 31.00
3.16
41173000
14.47
5.07
0.48
90.51
88.46
TATASTEEL 319.20
8.30
15838900
(12.71)
-12.59
0.61
81.98
88.74
VEDL 111.35
23.79
106950000
11.07
0.94
1.00
93.50
93.81
Media
PVR 1014.25
17.44
1189200
(18.39)
-47.69
0.54
88.59
85.62
SUNTV 415.35
6.54
5535000
47.08
4.16
0.64
98.15
95.01
ZEEL 172.60
(3.36)
23085000
(16.75)
1.51
0.48
76.18
89.75
INFORMATION TECHNOLOGY
HCLTECH 550.60
1.78
18135600 (16.49)
1.04
0.65
91.70 91.20
INFY 699.05
0.71
49791600 (6.95)
-2.08
0.71
97.29 96.77
MINDTREE 909.50
1.67
1311200 104.88
-8.19
0.43
92.91 89.58
NIITTECH 1381.80
(6.00)
510000 48.31
2.46
0.13
92.58 92.15
TCS 2014.80
1.26
7886700 (45.16)
0.03
1.41
57.93 83.87
TECHM 550.65
4.08
16741200 1.56
-6.59
0.46
98.82 97.74
WIPRO 218.80
10.06
22646400 (10.01)
2.87
0.65
93.43 93.63
Derivatives Rollover Report
For Private Circulation Only
5
Scrip Price
Price
Change
(%) OI Futures
OI
Change
(%) COC (%) PCR-OI
Rollover
(%)
Average
Rollover
(3month)
(%)
INFORMATION TECHNOLOGY
HCLTECH 564.00
(0.70)
22885800
(1.26)
8.14
0.58
98.56
96.78
INFY 730.55
3.77
24351600
(52.50)
2.86
0.74
55.98
79.52
MINDTREE 782.95
10.93
1041600
(14.29)
-15.63
0.59
93.13
93.37
NIITTECH 1606.65
6.68
578250
26.08
-2.03
0.46
89.76
82.99
TCS 2212.80
6.19
15671500
(17.22)
6.42
1.91
95.02
94.74
TECHM 775.75
1.00
15406800
8.21
9.05
0.65
96.29
97.15
WIPRO 249.90
3.65
18211200
(29.64)
-2.08
0.72
83.12
92.60
MISCELLANIOUS
ADANIENT 162.40
13.81
17852000
(1.44)
4.84
0.38
97.42
94.64
APOLLOHOSP 1442.65
8.97
1137500
29.93
3.74
0.42
95.39
95.68
BATAINDIA 1318.40
1.87
1321650
(11.43)
-0.51
0.50
96.12
95.48
BEL 84.10
21.71
17282400
(19.98)
4.98
0.70
93.96
87.47
CONCOR 425.60
21.06
4634295
(10.91)
-1.47
0.25
96.86
97.60
CUMMINSIND 404.90
13.24
1255200
(12.06)
3.10
1.21
96.67
89.46
INDIGO 1044.40
7.80
2439000
(15.17)
-0.55
0.94
82.71
85.75
JUSTDIAL 365.30
(3.05)
1122800
(22.14)
-46.24
0.05
73.78
83.58
OIL & GAS
BPCL 371.35
14.61
18520200
(13.97)
3.10
0.49
95.82
96.40
GAIL 103.20
16.61
34580900
39.97
1.01
0.49
94.30
93.28
HINDPETRO 213.10
15.03
16124400
41.29
-41.13
0.75
95.62
81.73
IGL 445.25
(4.98)
7657375
94.92
0.23
0.50
89.61
92.06
IOC 85.40
10.05
53665500
9.18
4.29
0.54
97.35
95.64
MGL 1073.00
16.14
661200
(54.72)
3.31
0.40
93.87
96.62
ONGC 81.85
3.94
70847700
38.98
3.20
0.49
97.82
95.71
PETRONET 261.85
10.07
12453000
3.83
4.20
0.26
85.39
93.36
RELIANCE
1717.70
16.97
34874795
46.51
-
0.12
0.58
94.24
89.20
PHARMACEUTICAL
AUROPHARM
A
792.15 11.23
11167000 11.03
3.04
0.49
98.96
95.99
BIOCON 405.70 17.76
15122500 26.83
3.61
0.32
95.66
91.23
CADILAHC 364.70 8.12
5790400 (10.72)
3.87
0.53
77.46
89.80
CIPLA 637.20 1.48
12231700 18.73
3.78
0.58
95.42
86.74
DIVISLAB 2338.25 2.79
3142800 31.48
3.49
0.60
98.81
97.81
DRREDDY 3996.40 3.31
3221500 0.38
-2.65
0.46
97.68
97.25
GLENMARK 461.50 34.63
3767400 4.80
7.74
1.15
83.06
91.57
LUPIN 935.35 6.15
6996350 (28.33)
0.11
0.53
90.76
94.15
PEL 1333.95 43.20
3944050 (14.94)
-6.60
0.35
94.77
97.10
SUNPHARMA 488.95 7.04
32552800 (14.97)
2.78
0.69
97.08
95.78
TORNTPHARM 2503.70 6.47
1176000 10.37
1.48
0.70
98.37
96.13
Derivatives Rollover Report
For Private Circulation Only
6
Scrip Price
Price
Change
(%) OI Futures
OI
Change
(%) COC (%) PCR-OI
Rollover
(%)
Average
Rollover
(3month)
(%)
POWER
NTPC 96.15
1.10
60231900
30.54
0.54
0.51
97.45
96.45
POWERGRID 179.40
14.16
31608000
(3.79)
0.29
0.39
95.06
96.33
TATAPOWER 43.90
23.49
53595000
(13.00)
-2.37
0.80
83.66
90.26
TORNTPOWER 327.25
7.65
1758000
(0.51)
3.52
0.22
92.72
92.97
REAL ESTATE
DLF 157.75
10.12
26317500
(2.91)
3.32
0.50
94.10 94.24
NCC 32.25
36.94
16758000
(31.97)
4.87
0.96
83.80 91.28
TELECOM
BHARTIARTL 558.25
(0.45)
78563844
16.42
-1.40
0.75
96.64
94.31
IDEA 9.95
67.23
173040000
(42.83)
10.59
0.60
83.50
76.22
INFRATEL 225.50
1.19
8979600
11.59
-13.47
0.83
94.75
91.26
TEXTILES
CENTURYTEX 307.20
7.98
2408000
4.18
-0.85
0.85
71.62
89.68
PAGEIND 20328.40
10.57
113070
4.11
1.82
0.83
80.02
83.84
SRF
3613.85
6.16
510250
(9.09)
-
0.36
0.73
96.64
96.41

Derivatives Rollover Report
For Private Circulation Only
7
Technical and Derivatives Team:
Sameet Chavan Chief Analyst - Technical & Derivatives sameet.chavan@angelbroking.com
Ruchit Jain Senior Analyst - Technical & Derivatives ruchit.jain@angelbroking.com
Rajesh Bhosale Technical Analyst rajesh.bhosle@angelbroking.com
Sneha Seth Derivatives Analyst sneha.seth@angelbroking.com
Research Team Tel: 022 - 39357600 (EXTN - 6844) Website: www.angelbroking.com
For Technical & Derivative Queries E-mail: technicalresearch-cso@angelbroking.com
DISCLAIMER
Angel Broking Limited (hereinafter referred to as “Angel”) is a registered Member of National Stock Exchange of India Limited,
Bombay Stock Exchange Limited and Metropolitan Stock Exchange Limited. It is also registered as a Depository Participant with
CDSL and Portfolio Manager and Investment Adviser with SEBI. It also has registration with AMFI as a Mutual Fund Distributor.
Angel Broking Limited is a registered entity with SEBI for Research Analyst in terms of SEBI (Research Analyst) Regulations, 2014
vide registration number INH000000164. Angel or its associates has not been debarred/ suspended by SEBI or any other regulatory
authority for accessing /dealing in securities Market. Angel or its associates/analyst has not received any compensation / managed
or co-managed public offering of securities of the company covered by Analyst during the past twelve months.
This document is solely for the personal information of the recipient, and must not be singularly used as the basis of any
investment decision. Nothing in this document should be construed as investment or financial advice. Each recipient of this
document should make such investigations as they deem necessary to arrive at an independent evaluation of an investment in the
securities of the companies referred to in this document (including the merits and risks involved), and should consult their own
advisors to determine the merits and risks of such an investment.
Reports based on technical and derivative analysis center on studying charts of a stock's price movement, outstanding positions
and trading volume, as opposed to focusing on a company's fundamentals and, as such, may not match with a report on a
company's fundamentals. Investors are advised to refer the Fundamental and Technical Research Reports available on our website
to evaluate the contrary view, if any.
The information in this document has been printed on the basis of publicly available information, internal data and other reliable
sources believed to be true, but we do not represent that it is accurate or complete and it should not be relied on as such, as this
document is for general guidance only. Angel Broking Limited or any of its affiliates/ group companies shall not be in any way
responsible for any loss or damage that may arise to any person from any inadvertent error in the information contained in this
report. Angel Broking Limited has not independently verified all the information contained within this document. Accordingly, we
cannot testify, nor make any representation or warranty, express or implied, to the accuracy, contents or data contained within this
document. While Angel Broking Limited endeavors to update on a reasonable basis the information discussed in this material,
there may be regulatory, compliance, or other reasons that prevent us from doing so.
This document is being supplied to you solely for your information, and its contents, information or data may not be reproduced,
redistributed or passed on, directly or indirectly.
Neither Angel Broking Limited, nor its directors, employees or affiliates shall be liable for any loss or damage that may arise from or
in connection with the use of this information.
