IPO Note | HFCs
March 11, 2013
Repco Home Finance (RHFL)
SUBSCRIBE
Issue Open: March 13, 2013
Attractive Priority
Issue Close: March 15, 2013
Operates in attractive loan segment - Priority sector home loans: RHFL is largely
Issue Details
focused on providing home loans in tier-II and tier-III cities (with a sub-`10lakh
average loan ticket size), due to which a large part of its book qualifies as priority
Face Value: `10
sector lending (PSL) for banks. In our view, NBFCs operating in PSL segments
Present Eq. Paid-up Capital: `46.4cr
enjoy competitive advantages, as most banks (especially in the private sector)
have a perennial shortage in meeting their PSL targets, creating favorable
Offer Size: 1.57cr Shares
demand-supply dynamics for those NBFCs that can source higher-yielding PSL
Post Eq. Paid-up Capital: `62.2cr
loans at reasonable asset quality.
Issue size (amount):* `259-270cr
REPCO’s loan book profile also allows it to procure 44% of its total borrowing via
low-cost NHB refinance averaging about 7.5-8% (NHB refinance is available
Price Band: `165-172
under various schemes, primarily for rural loans upto `15lakh and also for low
Post-issue implied mkt. cap*: `1,026cr-
1,069cr
cost urban housing loans up to `10lakhs). Moreover, the funding that it gets from
banks in turn largely qualifies as PSL for the banks (loans by banks to NBFCs,
Promoters holding Pre-Issue: 50.0%
which are on-lent as home loans less than `10lakhs qualify as PSL). This makes it
Promoters holding Post-Issue: 37.4%
attractive for banks to lend to RHFL at a reasonable cost (about 100bps above
Note:*At the lower and upper price band,
base rate), as against alternatives such as parking funds under RIDF at extremely
respectively
low yields, to meet their PSL targets. Relatively low-cost NHB and bank funding
enables it to maintain healthy margins and return ratios (NIMs at 3.8% and RoE
Book Building
at 22.2% in 1HFY2013, calculated on an annualized basis)
QIBs
Up to 50%
In terms of borrower profile, around 53% of RHFL’s outstanding loan book
Non-Institutional
At least 15%
constituted loans to relatively higher-yielding higher-risk non-salaried segment. To
mitigate risks, the company, lends at a low LTV of about 65%, as per the
Retail
At least 35%
management. In terms of geographical presence, 67% and 98% of its business is
concentrated in Tamil Nadu and South India, respectively, largely in tier-II and
tier-III cities.
Post Issue Shareholding Pattern
Management expects strong growth to continue: Over FY2008-12, the company
Promoters Group
37.4
grew its loan book at a CAGR of 43.8% (albeit on a small base) to `2,802cr,
MF/Banks/Indian
63.6
driving PAT CAGR of 43.3%. As of September 30, 2012, its CRAR stood at a
FIs/FIIs/Public & Others
comfortable 15.9% (entirely tier-I). Further, IPO proceeds would increase its
capital base by nearly 0.9x, providing enough headroom for maintaining strong
loan growth for the next few years as well. Funding mix is also expected to remain
stable (In FY2014 NHB refinance facility for Rural housing fund increased by 50%
to `6,000cr; bank demand for PSL opportunities is also expected to remain strong
and future outlook is favorable, in our view, given government’s priority sector
focus).
Outlook & Valuation: RHFL generated 22.2% RoE in 1HFY2013E and would trade
at 1.8x FY2013E ABV (at the upper end of its price band, based on post-issue
networth). Closest comparable peer - Gruh HF (mainly western India, rural and
semi-urban focus, largely PSL qualifying home loans) appears extremely
expensive at valuations of 7.3x FY2013E BV, notwithstanding its ~30% earnings
growth trajectory and ~35% ROEs (FY2013E). Other NBFCs like Mahindra
Vaibhav Agrawal
Finance and Shriram Transport Finance operating in different priority sector
022 - 39357800 Ext: 6808
segments to a varying degree and generating similar return ratios, are trading at
2.6x and 2.3x FY2013E ABV, respectively (but they have larger, relatively more
seasoned loan books and longer proven track record). Overall, keeping in mind
Sourabh Taparia
RHFL’s attractive niche loan segment, strong growth prospects and reasonable
022 - 39357800 Ext: 6872
valuations, we recommend subscribe to the issue at the upper band.
Please refer to important disclosures at the end of this report
1
RHFL | IPO Note
Key Financials
Particulars (Rs cr)
FY2009
FY2010
FY2011
FY2012
1HFY13
NII
43
73
98
117
63
% chg
63.6
69.4
33.8
19.3
18.4*
Net Profit
25
44
57
68
36
% chg
66.6
74.9
28.7
19.4
10.2*
RoA (%)
2.9
3.5
3.2
2.7
2.4
RoE (%)
17.7
25.7
26.2
24.8
22.2
P/ABV (x) Lower End
5.5
4.5
3.6
2.9
-
P/ABV (x) Upper End
5.2
4.2
3.4
2.7
-
Source: Company, Angel Research, Note: *yoy growth
Company background
RHFL, a south based housing finance company, was established in April 2000 as a
wholly owned subsidiary of Repco Bank. The company is primarily engaged in the
business of individual home loans and loans against property, which as of
1HFY2013 accounts for 85.6% and 14.4% of its loan book respectively. As of
December 31, 2012, it had a total of 73 branches and 19 satellite centers located
in Tamil Nadu, Karnataka, Andhra Pradesh, Kerala, Maharashtra, Odisha, West
Bengal, Gujarat and the Union Territory of Pondicherry.
In December 2007, the company raised funds to the tune of `76cr from Carlyle
group, a global alternative asset manager and by virtue of which Carlyle group
acquired 49.9% stake in the company. Recently, Carlyle group has transferred
26.2% of the total equity shares to Creador 1 LLC, WCP Holdings III and certain
other entities; and hence Carlyle currently hold a 23.7% stake in the company.
Repco Bank, the promoter of the company, is a Government of India owned co-
operative bank, which was established to help and promote the rehabilitation of
repatriates from Sri Lanka, Myanmar, Vietnam and other countries. Its operations
are largely confined in the four South Indian states and the Union Territory of
Puducherry. During FY2012, Repco Bank reported a net profit growth of 30.3%
yoy to `73cr, on a total asset base of `4,875cr, which grew by 33.4% yoy.
Mr. R. Varadarajan is the Managing Director of the company as well as the
promoter and has 35 years of experience in banking industry. He is responsible for
the overall strategy and direction of the company. Most of the key management
personnel have healthy experience in the housing finance and the banking industry
and have been associated with the company for anywhere between 4-9 years.
Details of the issue
The IPO comprises an issue of fresh equity shares of 1.57cr of face value `10 each
to the public, with a reservation of 0.02cr equity shares for subscription by eligible
employees. The issue constitutes 25.3% of the post-issue paid-up capital. The price
band for the issue has been fixed at `165-172/ share, valuing the company at
`1,026cr - `1,069cr. REPCO HF intends to utilize the proceeds to augment its
capital base, so as to meet future capital adequacy requirements. As of September
30, 2012, its CRAR stood at 15.9%, much above the regulatory minimum of 12%.
Post-issue, the shareholding of the promoters in the company will fall to 37.4%
from the current holding of 50.0%.
March 11, 2013
2
RHFL | IPO Note
Investment arguments
Operates in attractive loan segment - Priority sector home loans
RHFL is largely focused on providing home loans in tier-II and tier-III cities (with a
sub-`10lakh average loan ticket size), due to which a large part of its book
qualifies as priority sector lending (PSL) for banks. In our view, NBFCs operating in
PSL segments enjoy competitive advantages, as most banks (especially in the
private sector) have a perennial shortage in meeting their PSL targets, creating
favorable demand-supply dynamics for those NBFCs that can source higher-
yielding PSL loans at reasonable asset quality.
REPCO’s loan book profile also allows it to procure 44% of its total borrowing via
low-cost NHB refinance averaging about 7.5-8%. NHB refinance is available
under various schemes, primarily for rural loans upto `15lakh and also for low
cost urban housing loans up to `10lakhs. As per the management, of its total NHB
refinance roughly two-third pertained to rural schemes and balance pertained to
urban schemes. Moreover, the funding that it gets from banks in turn largely
qualifies as PSL for the banks (loans by banks to NBFCs, which are on-lent as
home loans less than `10lakhs qualify as PSL). This makes it attractive for banks to
lend to RHFL at a reasonable cost (about 100bps above base rate), as against
alternatives such as parking funds under RIDF at extremely low yields, to meet their
PSL targets. Relatively low-cost NHB and bank funding enables it to maintain
healthy margins and return ratios (NIMs at 3.8% and RoE at 22.2% in 1HFY2013,
calculated on an annualized basis).
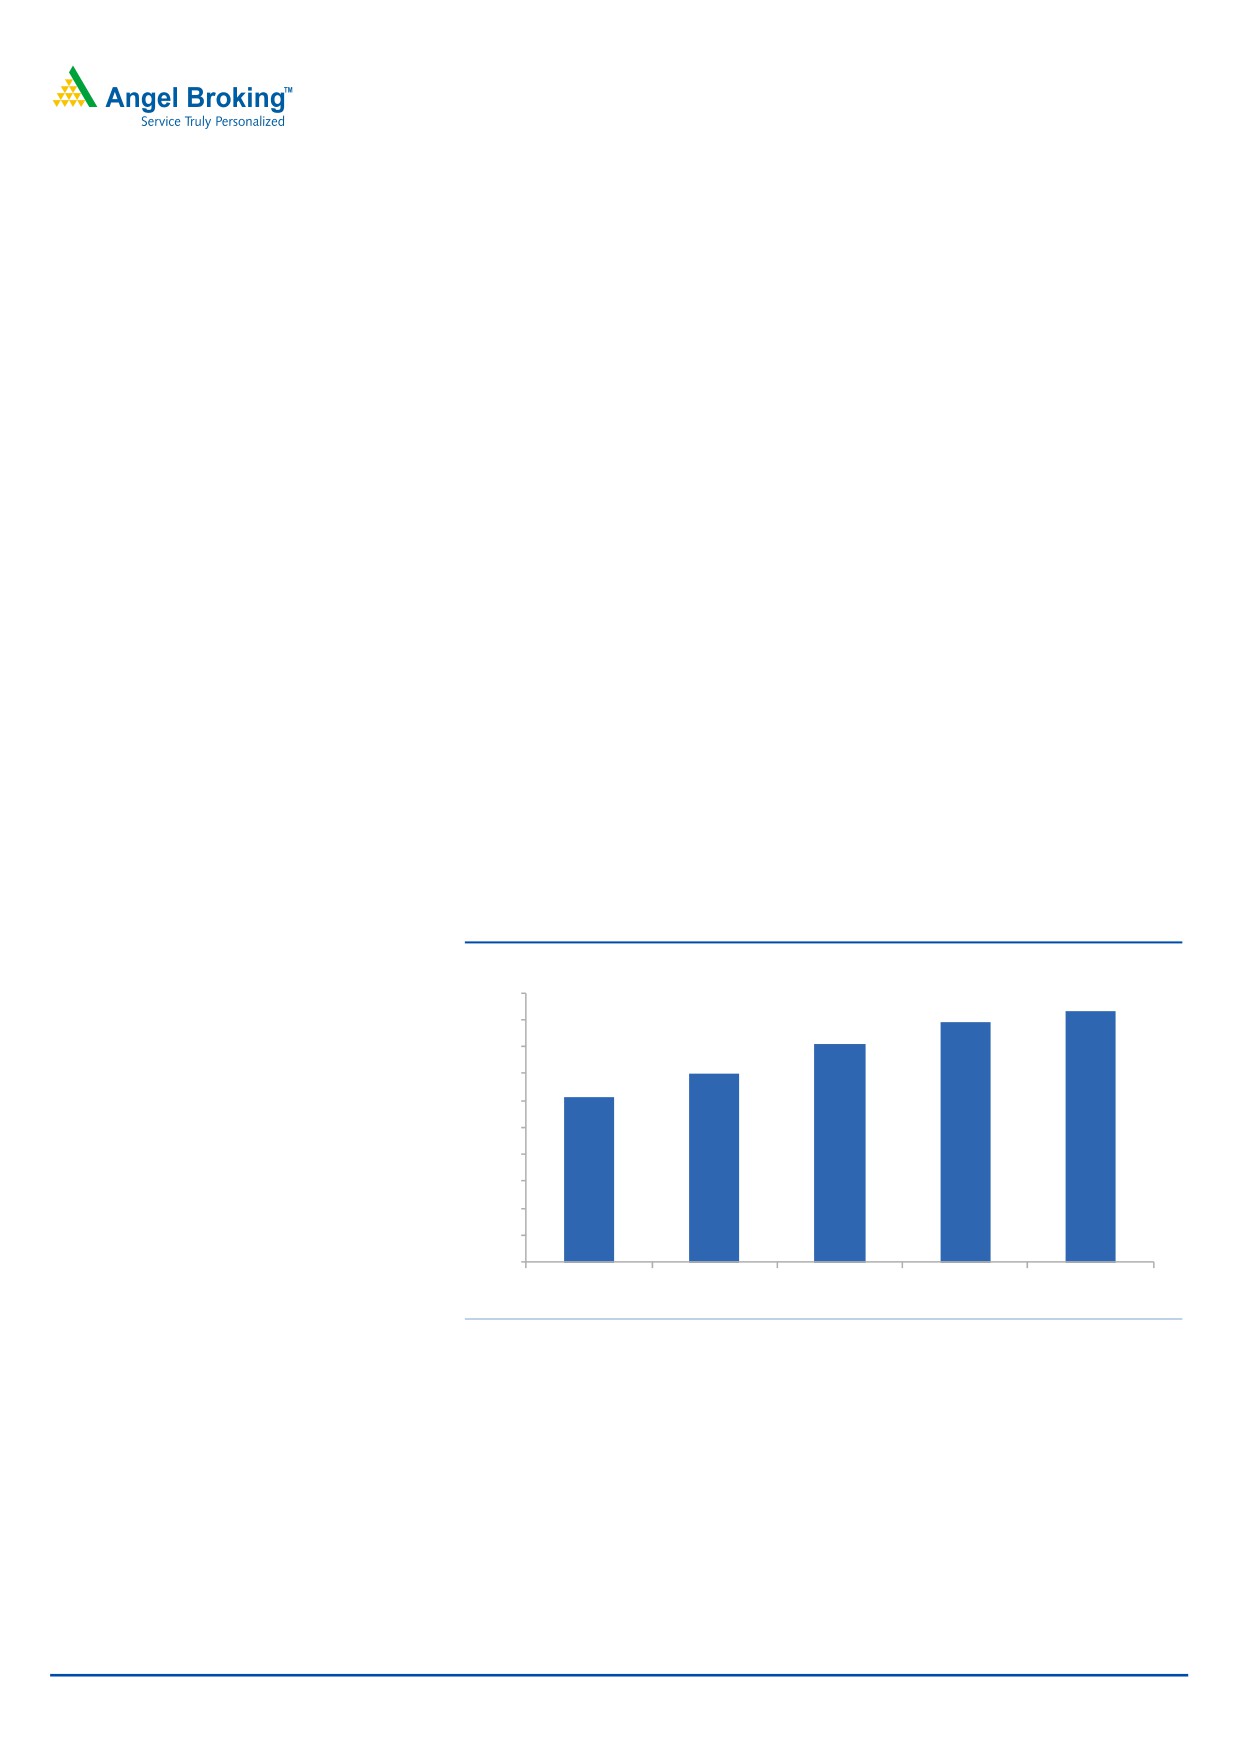
Exhibit 1: Average loan ticket size for the company
(` lakh)
10
9
9.3
8
8.9
8.1
7
7.0
6
6.1
5
4
3
2
1
0
FY2009
FY2010
FY2011
FY2012
1HFY13
Source: Company, Angel Research
March 11, 2013
3
RHFL | IPO Note
Exhibit 2: Salient features of some NHB refinance schemes
Scheme Name
Loan size
Location
Tenure (yrs) Ultimate borrower
Interest Rate
Golden Jubilee Rural Housing Refinance Scheme upto `15lakh Rural
1 -15 Any
Floating/fixed
Rural Housing Fund
upto `15lakh Rural
3 - 7 Weaker section
Fixed
Special Refinance Scheme for Urban Low
Persons having annual household
upto `10lakh
Urban
5 -15
Fixed
Income Housing
income below `2lakh
Liberalized Refinance Scheme
Any
Rural/Urban
1 -15 Any
Floating/fixed
Energy Efficient Housing Refinance Scheme
Any
Urban
1 -15 Any
Fixed
Source: NHB, Angel Research
In terms of borrower profile, around 53% of REPCO’s outstanding loan book
constituted loans to relatively higher-yielding higher-risk non-salaried segment. To
mitigate risks, the company, lends at a low LTV of about 65%, as per the
management. In terms of geographical presence, 67% and 98% of its business is
concentrated in Tamil Nadu and South India, respectively, largely in tier-II and tier-
III cities.
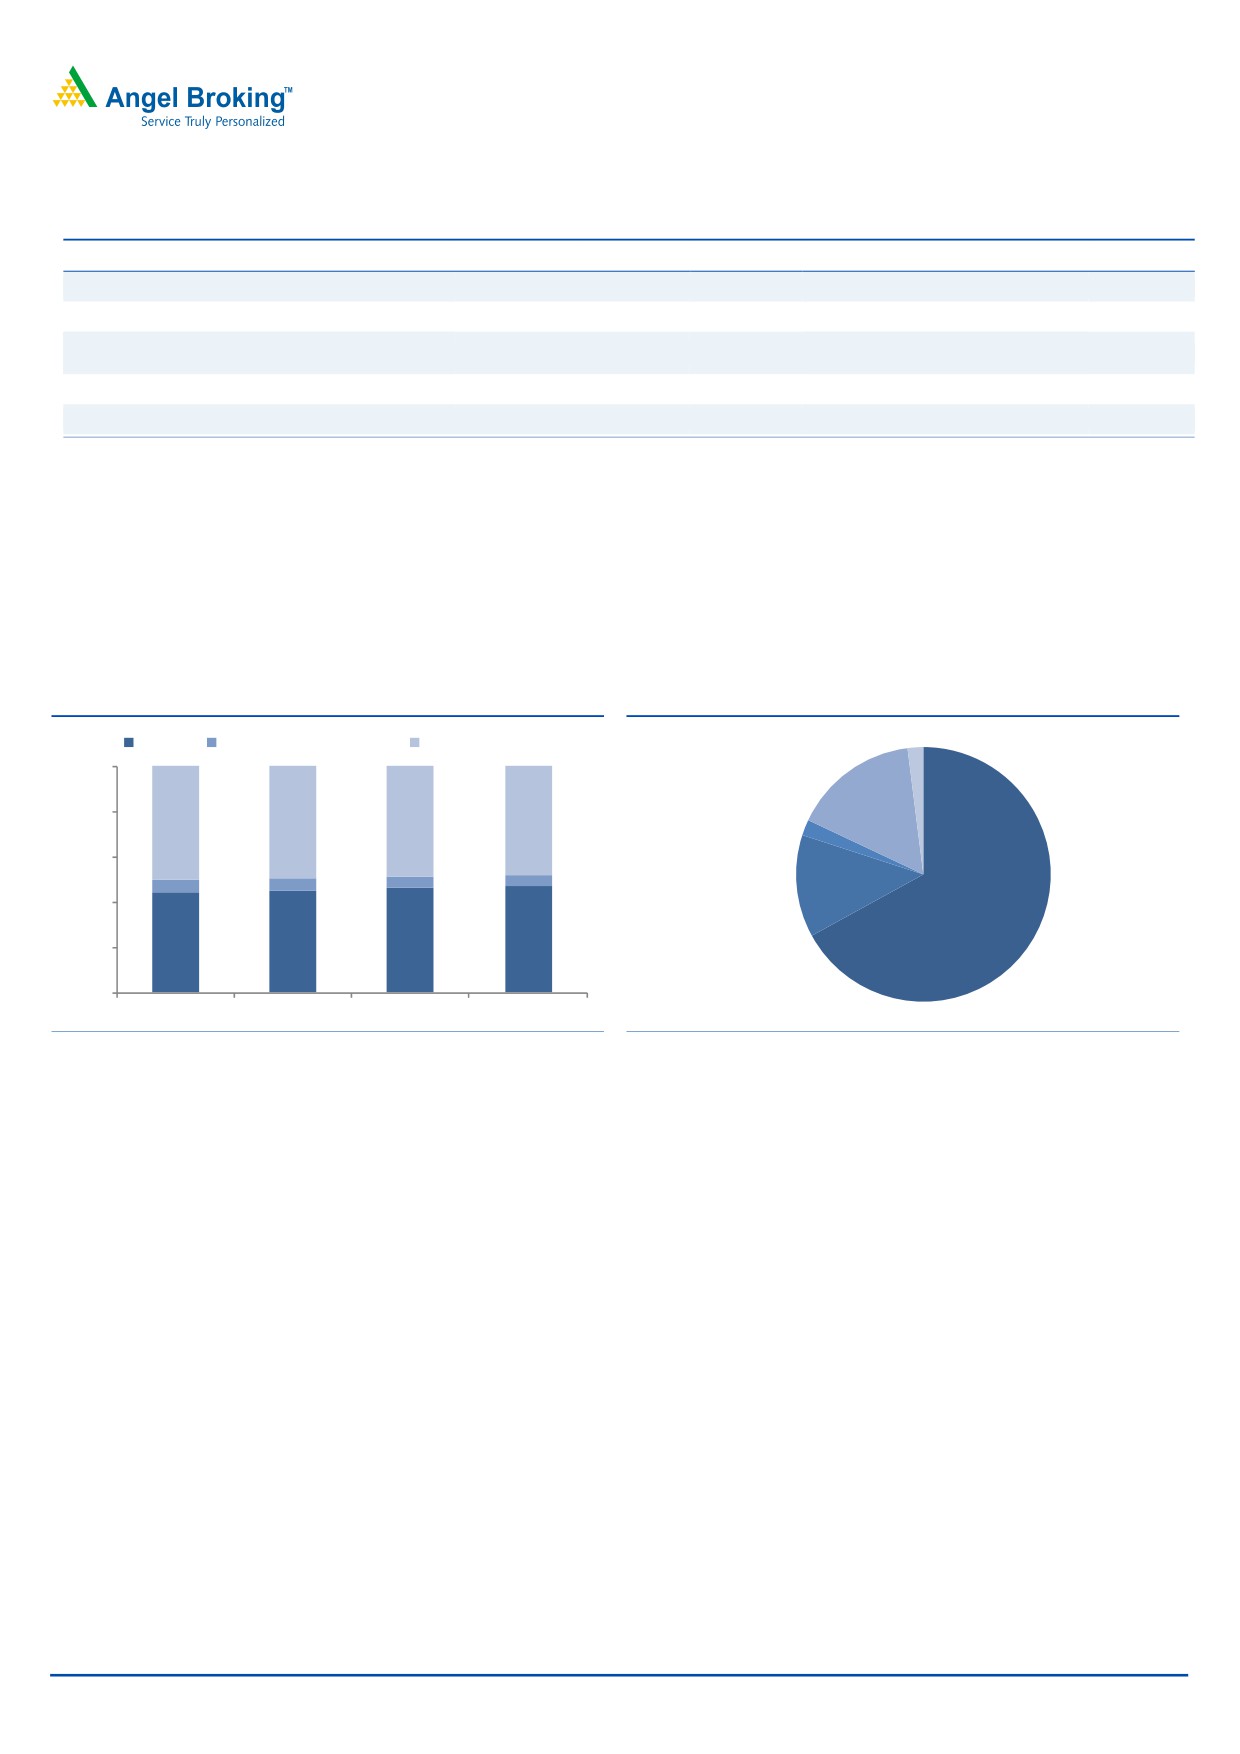
Exhibit 3: Borrower profile wise loan book
Exhibit 4: Region-wise loan book, as of FY2012
Salaried
Professionals/Self employed
Loan to Businessmen
100%
Maharashtra
2%
Andhra Pradesh
16%
80%
50.0
49.3
48.9
48.2
Kerala
2%
60%
Karnataka
5.8
4.6
4.5
5.8
13%
40%
Tamil Nadu
67%
44.1
44.9
46.5
47.3
20%
0%
FY2010
FY2011
FY2012
1HFY13
Source: Company, Angel Research
Source: Company, Angel Research
Management expects strong growth to continue
Over FY2008-12, the company grew its loan book at a CAGR of 43.8% (albeit on
a small base) to `2,802cr, driving PAT CAGR of 43.3%. As of September 30,
2012, its CRAR stood at a comfortable 15.94% (entirely tier-I). Further, IPO
proceeds would increase its capital base to nearly 1.9x, providing enough
headroom for maintaining strong loan growth for the next few years as well.
RHFL’s funding mix, which primarily comprises of loans from bank and NHB, is
also expected to remain stable, going ahead, given the government’s priority
sector focus, which is evident in 50% yoy increase in its allocation of funds to NHB
refinance facility for Rural Housing Fund during FY2014 (from `4,000cr to
`6,000cr) and strong demand from banks for PSL opportunities, considering a
perennial shortage in meeting their PSL targets, in case of most banks (especially
in the private sector).
March 11, 2013
4
RHFL | IPO Note
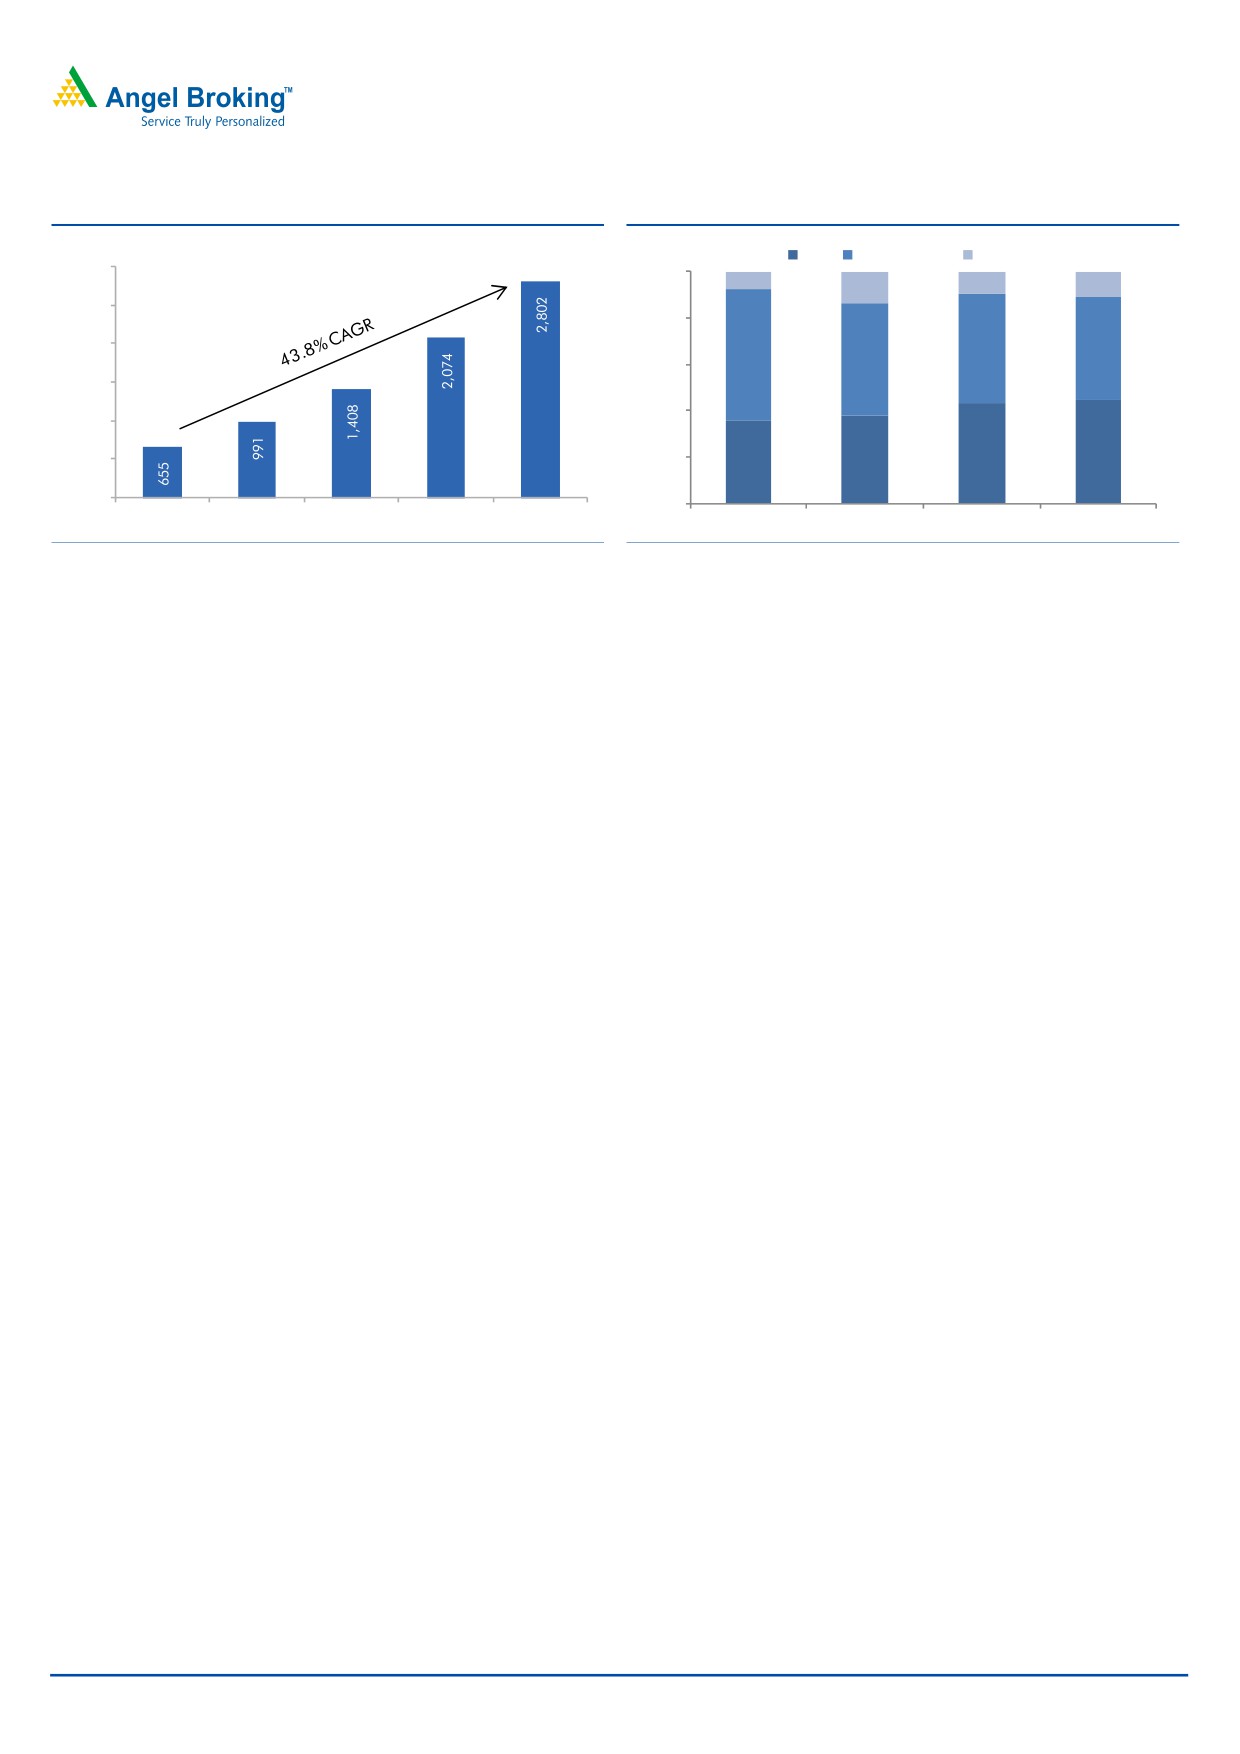
Exhibit 5: Strong loan book growth (on a low base)
Exhibit 6: RHFL’s funding profile
(` cr)
SCBs
NHB - refinance
Promoter
3,000
100%
7.8
9.8
13.6
11.3
2,500
80%
2,000
47.2
44.3
56.4
48.3
60%
1,500
40%
1,000
43.0
44.4
500
20%
35.8
38.0
0
0%
FY2008
FY2009
FY2010
FY2011
FY2012
FY2010
FY2011
FY2012
1HFY13
Source: Company, Angel Research
Source: Company, Angel Research
Key risks/concerns
Relatively unseasoned, fast growing loan book, focus on non -
salaried segment could pose asset quality concerns
RHFL grew its loan book at a CAGR of 43.8% over FY2008-12, much higher than
industry levels, owing to a small base. From `655cr in FY2008, its loan book has
grown more than 3x to `2,802cr in FY2012, and hence a large part of its loan
book appears unseasoned. Further, a sizeable proportion of its loan book
constitutes loans to non-salaried borrowers (53% as of 1HFY13), which is generally
regarded as a more vulnerable segment from an asset quality point-of-view, given
the inherently more uncertain income stream of the borrowers, which could be
exacerbated by low ticket size.
GNPA ratio for the company has increased consistently over the last three years,
from 1.0% in FY2010 to 1.4% in FY2012. Segment-wise, while GNPA ratio in the
loans against property segment declined from 1.4% in FY2010 to 1.1% in FY2012,
it grew from 1.2% to 1.4% over the same period for its individual home loan
portfolio. On an absolute basis, while GNPA levels for the company grew at a
CAGR of 59.3% over FY2009-12, doubtful and loss assets as a proportion to total
Gross NPAs increased from 27.9% in FY2010 to 47.6% in FY2012. PCR ratio for
the company stood at 31% as of FY2012.
Even during 1HFY2013, subdued economic environment has resulted in a further
increase in the GNPA ratio for the company to 2.1%. Though, HFCs generally face
higher delinquencies during the year, which get normalize at the end, however,
considering continued weakness in the economy and unseasoned nature of its loan
book, in our view, the asset quality of the company is likely to remain a concern.
Funding dependent on banks and NHB refinance
As of 1HFY2013, around 44% of its total funding constituted borrowings from
NHB, while the remaining came from banks (44%) and its parent company (12%).
NHB has been extending refinance at an average rate of around 7.5-8% to HFCs
under various schemes, primarily for rural loans upto `15lakh, while, banks also
extend loans to HFCs at a reasonable cost to meet their PSL targets, as on-lending
as home loans less than `10lakhs qualify as PSL for banks.
March 11, 2013
5
RHFL | IPO Note
If some or all of these low cost funding alternatives, cease to be entirely
available/are available in a reduced extent to HFCs, being a small housing
finance company and considering its funding profile, the cost of funding and
business growth would get severely impacted for the company. However, given the
strong focus of the Government on priority sector, in our view, such an adverse
event is highly unlikely to take place. Even in FY2014, the Government has
increased the allocation for NHB refinance facility for Rural housing fund by 50%
to `6,000cr and bank demand for PSL opportunities also continues to remain
strong.
Regional concentration risk
RHFL’s business is geographically confined to four south Indian states (98% of total
business, as of FY2012), of which, Tamil Nadu constitutes the largest pie (67% of
total business, as of FY2012). The company has expansion plans in place to
improve the proportion of its non-south loan-book (2% currently, only from
Maharashtra), and has opened new branches in West Bengal, Orissa and Gujarat
during the previous year. Hence, its business is likely to remain concentrated in
South India and particularly in Tamil Nadu and would remain vulnerable to
regional concentration risks, more so, as a large part of its loan book comes from
non-salaried segment. As of 1HFY2013, around 53% of its loan book constituted
loans to non-salaried segment, of which, loans to businessmen constituted 48% of
the total loan book, balance being loans to professionals.
Outlook and valuation
RHFL generated RoEs of 22.2% in 1HFY2013E and would trade at 1.8x FY2013E
ABV (at the upper end of its price band, based on post-issue networth). Closest
comparable peer - Gruh HF (mainly western India, rural and semi-urban focus,
largely PSL qualifying home loans) appears extremely expensive at valuations of
7.3x FY2013E BV, notwithstanding its ~30% earnings growth trajectory and ~35%
ROEs (FY2013E). Other NBFCs like Mahindra Finance and Shriram Transport
Finance operating in different priority sector segments to a varying degree and
generating similar return ratios, are trading at 2.6x and 2.3x FY2013E ABV
respectively (but they have larger, relatively more seasoned loan books and longer
proven track record). Overall, keeping in mind RHFL’s attractive niche loan
segment, strong growth prospects and reasonable valuations, we recommend
subscribe to the issue at the upper band.
Exhibit 7: Comparative profile of select HFCs
Loan Avg. ticket
Funding (%)
Company
Gross NPANet NPA
book (` cr) size(` lakh) NHB ref. Banks NCD Others
CANFIN$
3,592
NA
25.9
67.9
0.0
6.3
0.90%
0.00%
GIC$
3,872
NA
15.3
78.1
0.0
6.6
2.08%
0.41%
DEWAN*
24,340
8.4
7.2
67.9
11.8
13.0
0.73%
0.00%
GRUH*
5,003
4.6
49.4
34.0
3.7
12.8
0.53%
0.00%
REPCO#
3,098
8.9
44.3
44.4
0.0
11.3
2.12%
1.59%
Source: Company, Angel Research, Note: *as of Dec 31, 2012, however, for GRUH, funding and
average ticket size as of FY2012, #as of Sept 30, 2012, $as of March 31, 2012
March 11, 2013
6
RHFL | IPO Note
Exhibit 8: Comparative DuPont analysis
GIC
CANFIN
GRUH
REPCO
Parameter
FY2011
FY2012
1HFY13* FY2011 FY2012 1HFY13* FY2011 FY2012 1HFY13* FY2011 FY2012 1HFY13*
Yield
9.8
10.9
12.1
10.1
11.2
11.8
12.3
13.7
13.5
12.0
12.4
12.2
Prov.#
1.1
0.5
0.3
0.1
0.3
0.2
0.1
0.1
0.5
0.3
0.4
0.4
Risk adj. yields
8.7
10.4
11.8
10.1
10.9
11.6
12.2
13.6
13.0
11.7
12.0
11.8
Cost
6.3
7.8
8.3
6.9
7.8
8.6
6.8
8.2
8.6
7.1
8.2
8.4
Adj. NII
2.4
2.6
3.5
3.2
3.1
3.1
5.4
5.4
4.4
4.5
3.8
3.4
Other Income
2.7
0.1
0.0
0.2
0.3
0.0
0.0
0.0
0.0
0.7
0.5
0.4
Operating Income
5.1
2.7
3.5
3.4
3.4
3.1
5.4
5.4
4.4
5.2
4.3
3.8
Operating Exp#
0.8
0.8
0.8
0.8
0.9
0.9
1.1
1.0
1.0
0.8
0.8
0.7
PBT
4.2
2.0
2.7
2.6
2.4
2.2
4.3
4.3
3.4
4.3
3.5
3.2
Taxes
0.9
0.5
0.7
0.7
0.7
0.5
1.2
1.1
1.0
1.2
0.8
0.8
RoA
3.3
1.5
2.0
1.9
1.8
1.7
3.1
3.2
2.4
3.2
2.7
2.4
Leverage
8.1
8.3
8.5
7.6
7.6
8.3
10.1
10.7
10.8
8.3
9.1
9.3
RoE
26.7
12.3
17.4
14.3
13.3
14.4
31.4
34.2
25.9
26.2
24.8
22.2
Source: Company, Angel Research, Note:*on an annualized basis, #for CANFIN and GIC, as the data regarding provisioning expenses in total operating
expense was unavailable for 1HFY13, assumed similar run-rate for operating expenses (excl. provisions) for 1HFY13 as was in FY2012
Exhibit 9: Valuation Summary
Trailing* RoA
Trailing* RoE Trailing* P/ABV (x)
FY13E P/ABV (x)
CANFIN
1.8
14.5
0.9
0.8
GICHF
1.9
14.9
1.2
1.1
DEWAN
1.7
17.5
1.0
0.9
GRUH
3.2
33.1
8.3
7.3
REPCO
2.5
25.9
2.6
1.8
SHRIRAM TRAN.
3.1
20.8
2.5
2.3
M&MFIN
3.5
24.2
3.8
2.6
Source: Company, Angel Research, Note: *as of 1HFY2013
March 11, 2013
7
RHFL | IPO Note
Income statement (standalone)
Y/E March (` cr)
FY2009
FY2010
FY2011
FY2012
1HFY13*
NII
43
73
98
117
63
- YoY Growth (%)
63.6
69.4
33.8
19.3
18.4
Other Income
2
1
0
0
0
- YoY Growth (%)
(17.9)
(66.9)
(39.7)
(82.9)
-
Operating Income
45
74
98
117
63
- YoY Growth (%)
56.5
63.1
33.1
18.9
18.4
Operating Expenses
7
9
15
19
10
- YoY Growth (%)
1.3
31.9
59.5
29.7
21.3
Pre - Provision Profit
38
64
83
97
54
- YoY Growth (%)
74.2
69.0
29.2
16.9
17.9
Prov. & Cont.
3
4
5
9
6
- YoY Growth (%)
209.4
29.8
53.3
74.2
7.1
Profit Before Tax
35
61
78
88
48
- YoY Growth (%)
68.5
72.0
27.9
12.9
19.4
Prov. for Taxation
10
17
21
20
12
- as a % of PBT
28.8
27.7
27.2
23.0
25
PAT
25
44
57
68
36
- YoY Growth (%)
66.6
74.9
28.7
19.4
10.2
Note:*growth is on a yoy basis, i.e. 1HFY13 over 1HFY12
Balance sheet (standalone)
Y/E March (` cr)
FY2009 FY2010
FY2011
FY2012
1HFY13*
Share Capital
79
46
46
46
46
Reserve & Surplus
73
144
195
257
292
Loan Funds
849
1,258
1,810
2,486
2,735
- Growth (%)
47.6
48.1
43.9
37.4
28.4
Other Liabilities & Provisions
30
35
46
61
75
Total Liabilities
1,032
1,483
2,097
2,851
3,149
Investments
1
2
2
8
8
Advances
991
1,409
2,076
2,807
3,103
- Growth (%)
51.3
42.2
47.3
35.2
10.5
Fixed Assets
1
2
3
3
3
Cash & Bank
35
64
8
18
17
Other Assets
4
5
8
15
18
Total Assets
1,032
1,483
2,097
2,851
3,149
Note:*growth is on a yoy basis, i.e. 1HFY13 over 1HFY12
March 11, 2013
8
RHFL | IPO Note
Ratio analysis (standalone)
Y/E March
FY2009
FY2010
FY2011
FY2012
1HFY13
Profitability ratios (%)
NIMs
4.6
5.2
4.8
4.2
3.8
Cost to Income Ratio
15.7
12.7
15.3
16.7
15.4
RoA
2.9
3.5
3.2
2.7
2.4
RoE
17.7
25.7
26.2
24.8
22.2
Asset Quality (%)
Gross NPAs
0.96
1.24
1.21
1.37
2.12
Net NPAs
0.69
0.96
0.95
0.95
1.58
Provision Coverage
27.9
22.1
21.7
30.8
25.3
Per Share Data (`)
EPS
5.4
9.5
12.2
14.5
7.7
ABVPS (100% cover.)
31.2
38.1
47.8
59.6
62.4
DPS
0.4
1.0
1.0
1.1
-
Valuation Ratios
PER (x) at upper band
31.8
18.2
14.1
11.8
-
PER (x) at lower band
30.5
17.4
13.5
11.3
-
P/ABVPS (x) at upper band
5.5
4.5
3.6
2.9
-
P/ABVPS (x) at lower band
5.2
4.2
3.4
2.7
-
DuPont Analysis
NII
4.6
5.2
4.8
4.2
3.8
(-) Prov. Exp.
0.3
0.3
0.3
0.4
0.4
Adj. NII
4.3
4.9
4.5
3.8
3.4
Other Inc.
0.6
0.6
0.7
0.5
0.4
Op. Inc.
4.8
5.6
5.2
4.3
3.8
Opex
0.8
0.7
0.8
0.8
0.7
PBT
4.0
4.8
4.3
3.5
3.2
Taxes
1.2
1.3
1.2
0.8
0.8
RoA
2.9
3.5
3.2
2.7
2.4
Leverage
6.2
7.3
8.3
9.1
9.3
RoE
17.7
25.7
26.2
24.8
22.2
March 11, 2013
9
RHFL | IPO Note
Research Team Tel: 022 - 39357800
DISCLAIMER
This document is solely for the personal information of the recipient, and must not be singularly used as the basis of any investment
decision. Nothing in this document should be construed as investment or financial advice. Each recipient of this document should make
such investigations as they deem necessary to arrive at an independent evaluation of an investment in the securities of the companies
referred to in this document (including the merits and risks involved), and should consult their own advisors to determine the merits and
risks of such an investment.
Angel Broking Limited, its affiliates, directors, its proprietary trading and investment businesses may, from time to time, make
investment decisions that are inconsistent with or contradictory to the recommendations expressed herein. The views contained in this
document are those of the analyst, and the company may or may not subscribe to all the views expressed within.
Reports based on technical and derivative analysis center on studying charts of a stock's price movement, outstanding positions and
trading volume, as opposed to focusing on a company's fundamentals and, as such, may not match with a report on a company's
fundamentals.
The information in this document has been printed on the basis of publicly available information, internal data and other reliable
sources believed to be true, but we do not represent that it is accurate or complete and it should not be relied on as such, as this
document is for general guidance only. Angel Broking Limited or any of its affiliates/ group companies shall not be in any way
responsible for any loss or damage that may arise to any person from any inadvertent error in the information contained in this report.
Angel Broking Limited has not independently verified all the information contained within this document. Accordingly, we cannot testify,
nor make any representation or warranty, express or implied, to the accuracy, contents or data contained within this document. While
Angel Broking Limited endeavors to update on a reasonable basis the information discussed in this material, there may be regulatory,
compliance, or other reasons that prevent us from doing so.
This document is being supplied to you solely for your information, and its contents, information or data may not be reproduced,
redistributed or passed on, directly or indirectly.
Angel Broking Limited and its affiliates may seek to provide or have engaged in providing corporate finance, investment banking or
other advisory services in a merger or specific transaction to the companies referred to in this report, as on the date of this report or in
the past.
Neither Angel Broking Limited, nor its directors, employees or affiliates shall be liable for any loss or damage that may arise from or in
connection with the use of this information.
Note: Please refer to the important `Stock Holding Disclosure' report on the Angel website (Research Section). Also, please refer to the
latest update on respective stocks for the disclosure status in respect of those stocks. Angel Broking Limited and its affiliates may have
investment positions in the stocks recommended in this report.
March 11, 2013
10
RHFL | IPO Note
6th Floor, Ackruti Star, Central Road, MIDC, Andheri (E), Mumbai- 400 093. Tel: (022) 39357800
Research Team
Fundamental:
Sarabjit Kour Nangra
VP-Research, Pharmaceutical
Vaibhav Agrawal
VP-Research, Banking
Bhavesh Chauhan
Sr. Analyst (Metals & Mining)
Viral Shah
Sr. Analyst (Infrastructure)
Sharan Lillaney
Analyst (Mid-cap)
V Srinivasan
Analyst (Cement, FMCG)
Yaresh Kothari
Analyst (Automobile)
Ankita Somani
Analyst (IT, Telecom)
Sourabh Taparia
Analyst (Banking)
Bhupali Gursale
Economist
Vinay Rachh
Research Associate
Amit Patil
Research Associate
Shareen Batatawala
Research Associate
Twinkle Gosar
Research Associate
Tejashwini Kumari
Research Associate
Technicals:
Shardul Kulkarni
Sr. Technical Analyst
Sameet Chavan
Technical Analyst
Sacchitanand Uttekar
Technical Analyst
Derivatives:
Siddarth Bhamre
Head - Derivatives
Institutional Sales Team:
Mayuresh Joshi
VP - Institutional Sales
Hiten Sampat
Sr. A.V.P- Institution sales
Meenakshi Chavan
Dealer
Gaurang Tisani
Dealer
Akshay Shah
Sr. Executive
Production Team:
Tejas Vahalia
Research Editor
Dilip Patel
Production
Angel Broking Ltd: BSE Sebi Regn No : INB 010996539 / CDSL Regn No: IN - DP - CDSL - 234 - 2004 / PMS Regn Code: PM/INP000001546 Angel Securities Ltd:BSE: INB010994639/INF010994639 NSE: INB230994635/INF230994635 Membership numbers: BSE 028/NSE:09946
Angel Capital & Debt Market Ltd: INB 231279838 / NSE FNO: INF 231279838 / NSE Member code -12798 Angel Commodities Broking (P) Ltd: MCX Member ID: 12685 / FMC Regn No: MCX / TCM / CORP / 0037 NCDEX : Member ID 00220 / FMC Regn No: NCDEX / TCM / CORP / 0302
March 11, 2013
11