Initiating Coverage | Power
March 16, 2015
Power Grid Corporation of India
BUY
CMP
`147
Healthy capitalisation provides earnings visibility
Target Price
`170
Power Grid Corporation of India (PGCIL) is among the largest transmission
Investment Period
12 Months
utilities in the world and is one of the best plays on the power sector in India
Stock Info
owing to its assured ROE model and strong earnings visibility.
Sector
Power
Huge investments lined up for augmenting power generation and transmission
Market Cap (` cr)
76,695
capacities: Power generation capacity in the country is expected to increase to
Net Debt (` cr)
66,343
~318GW by the end of the XII plan and a further addition of ~110GW has been
Beta
1.0
planned during the XIII plan. The transmission sector is also expected to see huge
52 Week High / Low
98 / 159
investments of ~`1,80,000cr and ~`2,00,000cr during the XII and XIII plan,
Avg. Daily Volume
2,73,051
respectively. A majority of these investments are expected to be towards
Face Value (`)
10
inter-regional transmission.
BSE Sensex
28,503
Regulated ROE model assures steady earnings growth: PGCIL receives a fixed
Nifty
8,648
return on equity (ROE) of 15.5%, with an additional 0.5% for timely completion of
Reuters Code
PGRD.BO
projects, as per norms laid out by the Central Electricity Regulatory Commission
Bloomberg Code
PWGR IN
(CERC). The fixed ROE model implies that earnings growth is directly linked to the
growth in assets capitalised. We estimate PGCIL’s current projects under
Shareholding Pattern (%)
implementation to be upwards of `1,00,000cr, providing strong earnings visibility.
Promoters
57.9
Strong capex plans to drive growth: PGCIL has incurred a capex of ~`60,000cr
MF / Banks / Indian Fls
7.7
since the beginning of FY2013 and remains well on track to achieve the XII plan
FII / NRIs / OCBs
27.6
capex target of `110,000cr. Further, we expect ~60-65% of XIII plan investments
Indian Public / Others
6.8
in the transmission sector toward inter-state transmissions, implying a capex
outlay of ~`1,20,000-1,30,000cr by PGCIL. The pace of capitalisation has also
Abs. (%)
3m 1yr
3yr
picked up in recent years, with FY2015 expected to have a capitalisation to capex
Sensex
4.2
30.9
60.0
ratio of >1.
Power Grid
8.8
48.5
32.0
Outlook and Valuation: Led by the strong capex plans and a healthy
capitalisation rate, we expect PGCIL to report a top-line and bottom-line CAGR of
3-Year Daily price chart
~15% and ~17% over FY2014-17E. At the current market price of `147, the
stock trades at a P/B of 1.8x and 1.7x its FY2016E and FY2017E BV of `79.7 and
180
160
`88.7, respectively. We initiate coverage on the stock with a Buy recommendation
140
and a target price of `170, based on ~1.9x FY2017E book value, implying a
120
16% upside from the current levels.
100
80
Key financials
60
Y/E March (` cr)
FY2014
FY2015E
FY2016E
FY2017E
Net sales
15,230
17,177
20,085
22,938
% chg
19.4
12.8
16.9
14.2
Source: Capitaline
Net profit
4,497
4,991
6,127
7,277
% chg
7.3
12.4
20.5
18.8
EBITDA margin (%)
85.1
86.4
86.5
86.7
EPS (`)
9.4
9.5
11.7
13.9
P/E (x)
15.6
15.4
12.5
10.5
P/BV (x)
2.2
2.0
1.8
1.7
RoE (%)
14.9
14.1
15.4
16.5
RoCE (%)
8.3
7.7
8.1
8.4
Rahul Dholam
EV/Sales (x)
10.2
9.7
8.9
8.2
022-39357800 Ext: 6847
EV/EBITDA (x)
12.0
11.3
10.2
9.5
Source: Company, Angel Research, Note: CMP as of March 13, 2015
Please refer to important disclosures at the end of this report
1
Power Grid Corporation of India | Initiating Coverage
Investment Arguments
Huge investments lined up for augmenting power generation
and transmission capacities
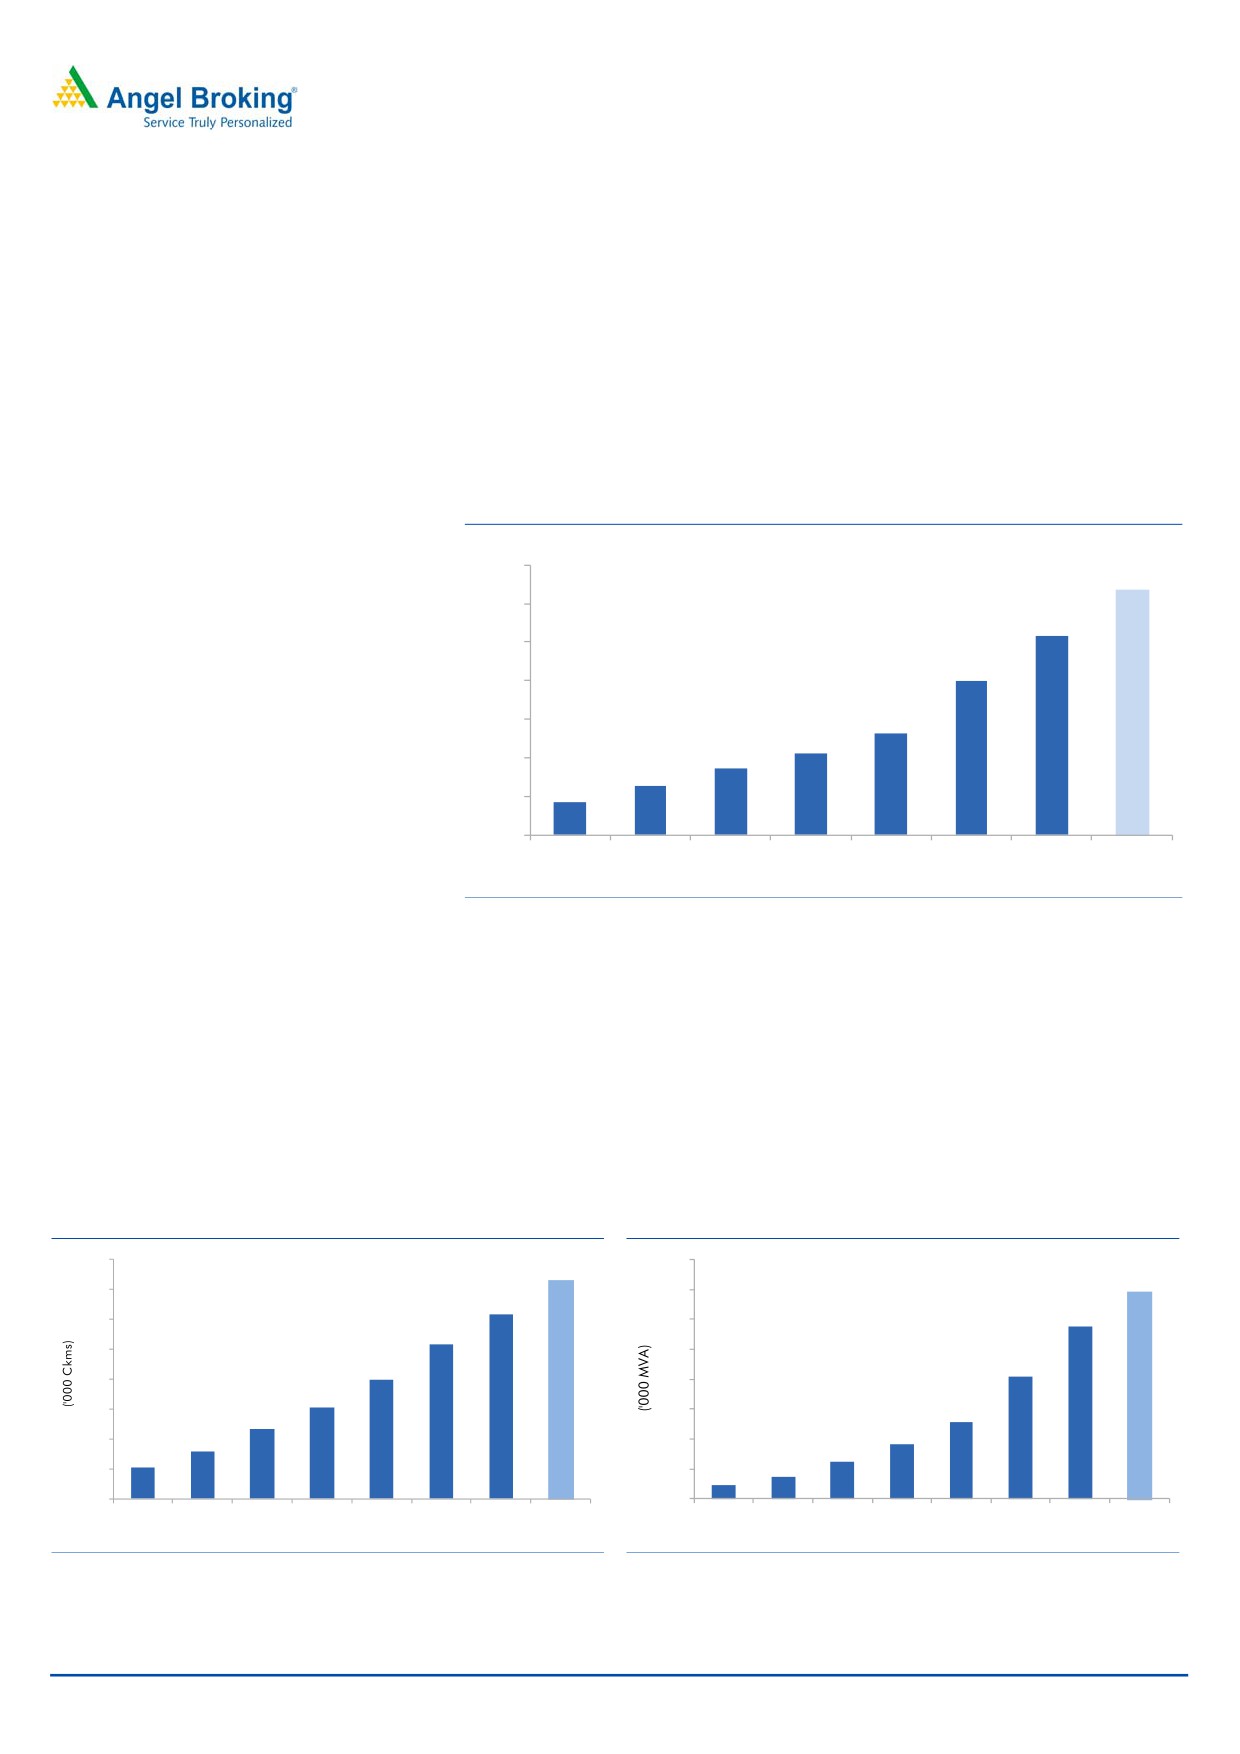
Power generation capacity in the country has increased at a CAGR of 7.2% since
the end of the IX plan to ~259GW as of January 1, 2015 as against ~105GW at
the end of FY2001-02. Generation capacity is expected to reach ~318GW by the
end of the XII plan. A further capacity addition of ~110GW is currently planned
during the XIII plan.
Exhibit 1: Power generation capacity
(GW)
350
318
300
259
250
200
200
132
150
105
86
100
64
43
50
-
6th Plan 7th Plan 8th Plan 9th Plan
10th plan
11th plan Jan-15
12th plan
(Target)
Source: CEA, Planning Commission
Transmission capacity has also increased at a rapid clip, keeping pace with rise in
generation capacity. India added 1,55,715 circuit kilometers (ckm) of transmission
lines since the end of the IX plan to take the total length of transmission lines to
3,07,984ckm. Transformation capacity increased even faster, i.e. by 3,84,232MVA
and 8,300MW (HVDC sub-stations) to 5,60,975MVA and 13,500MW, respectively.
Transmission line length is expected to increase to 364,921ckm by the end of the
XII plan to expand the total transformation capacity to
6,69,801MVA and
22,500MW for HVDC sub-stations.
Exhibit 2: Transmission Lines (Length)
Exhibit 3: Transformation capacity
800
400
365
692
350
700
308
574
300
600
257
250
500
198
410
200
400
152
150
300
258
117
182
100
79
200
125
52
75
50
100
47
-
-
6th Plan 7th Plan 8th Plan 9th Plan
10th plan 11th plan Jan-15
12th plan
6th Plan 7th Plan 8th Plan 9th Plan 10th plan11th plan Jan-15 12th plan
(Target)
(Target)
Source: CEA, Planning Commission
Source: CEA, Planning Commission
March 16, 2015
2
Power Grid Corporation of India | Initiating Coverage
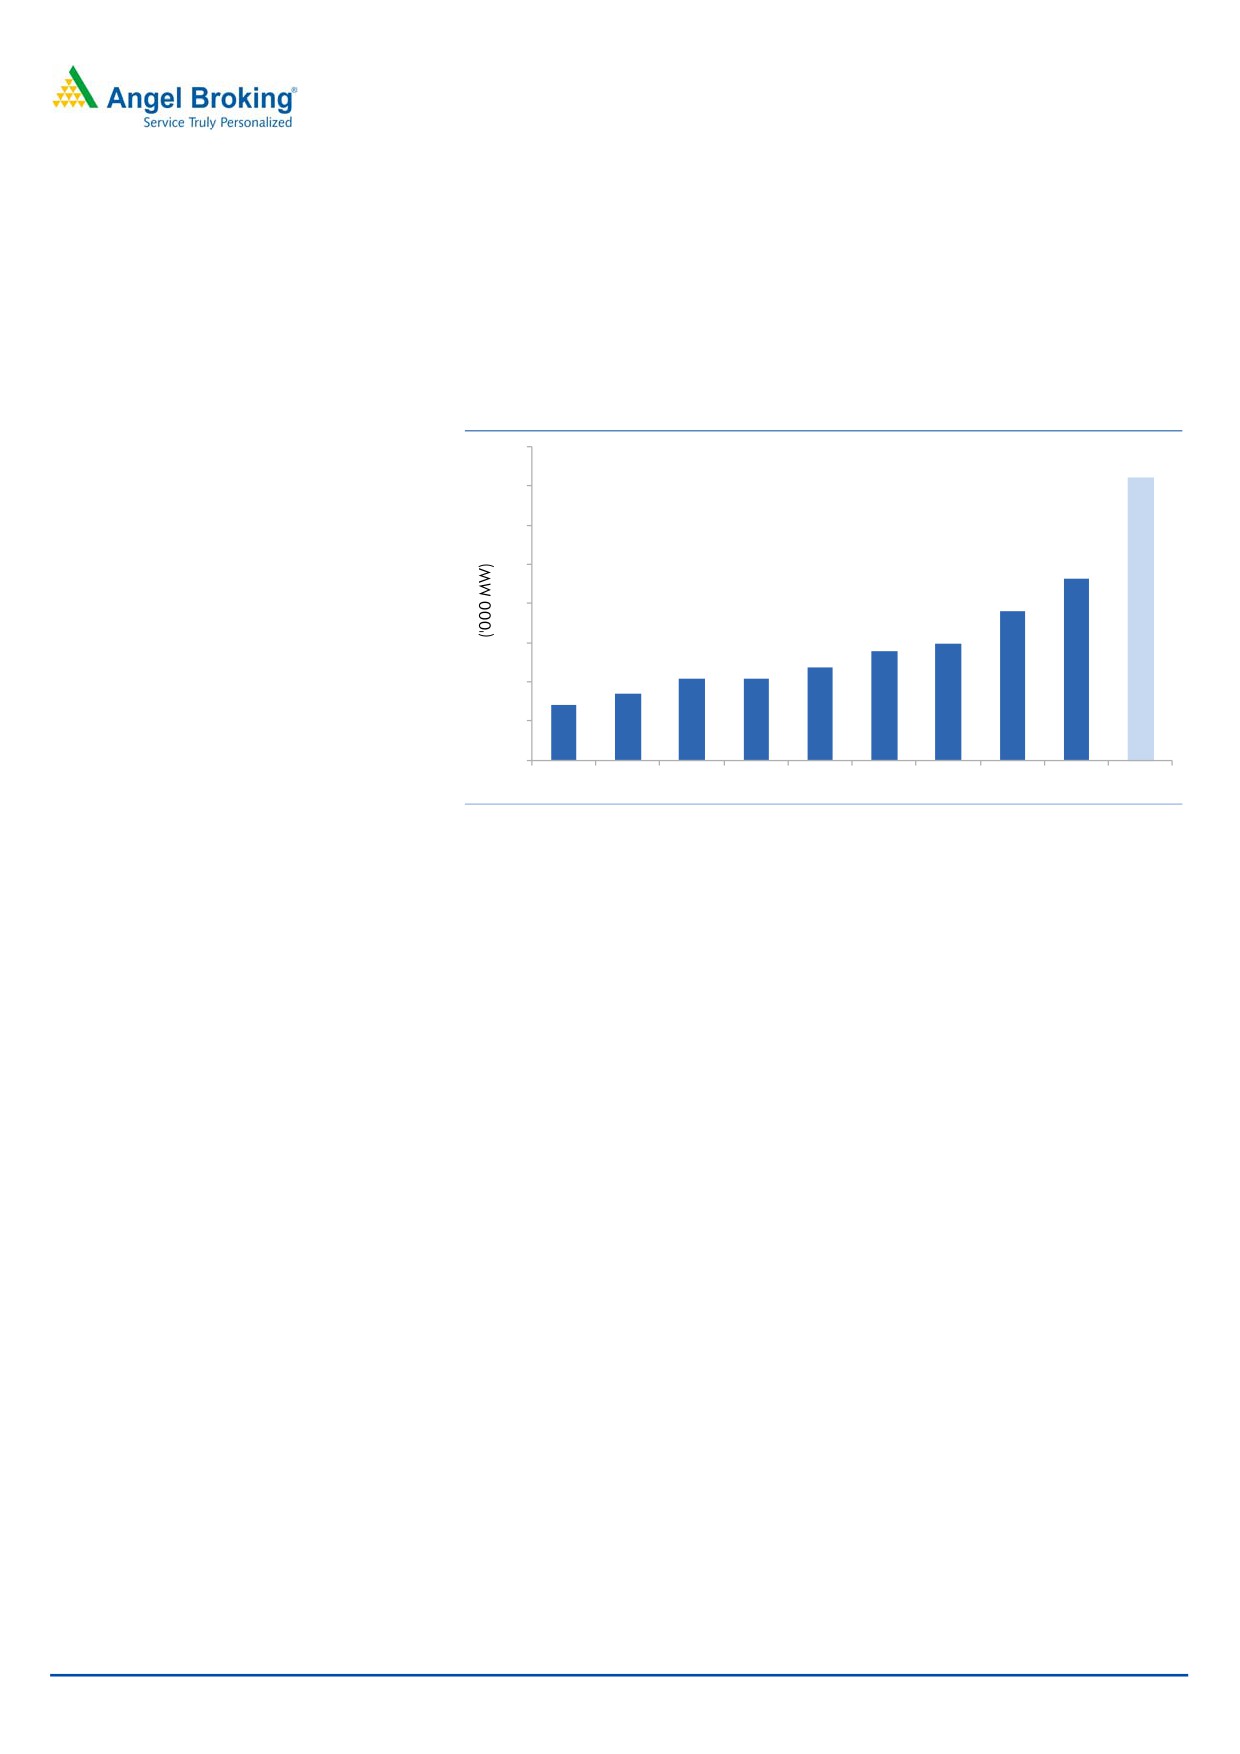
PGCIL is responsible for planning, implementation, operation and maintenance of
inter-state transmission system and operation of National & Regional Power Grids.
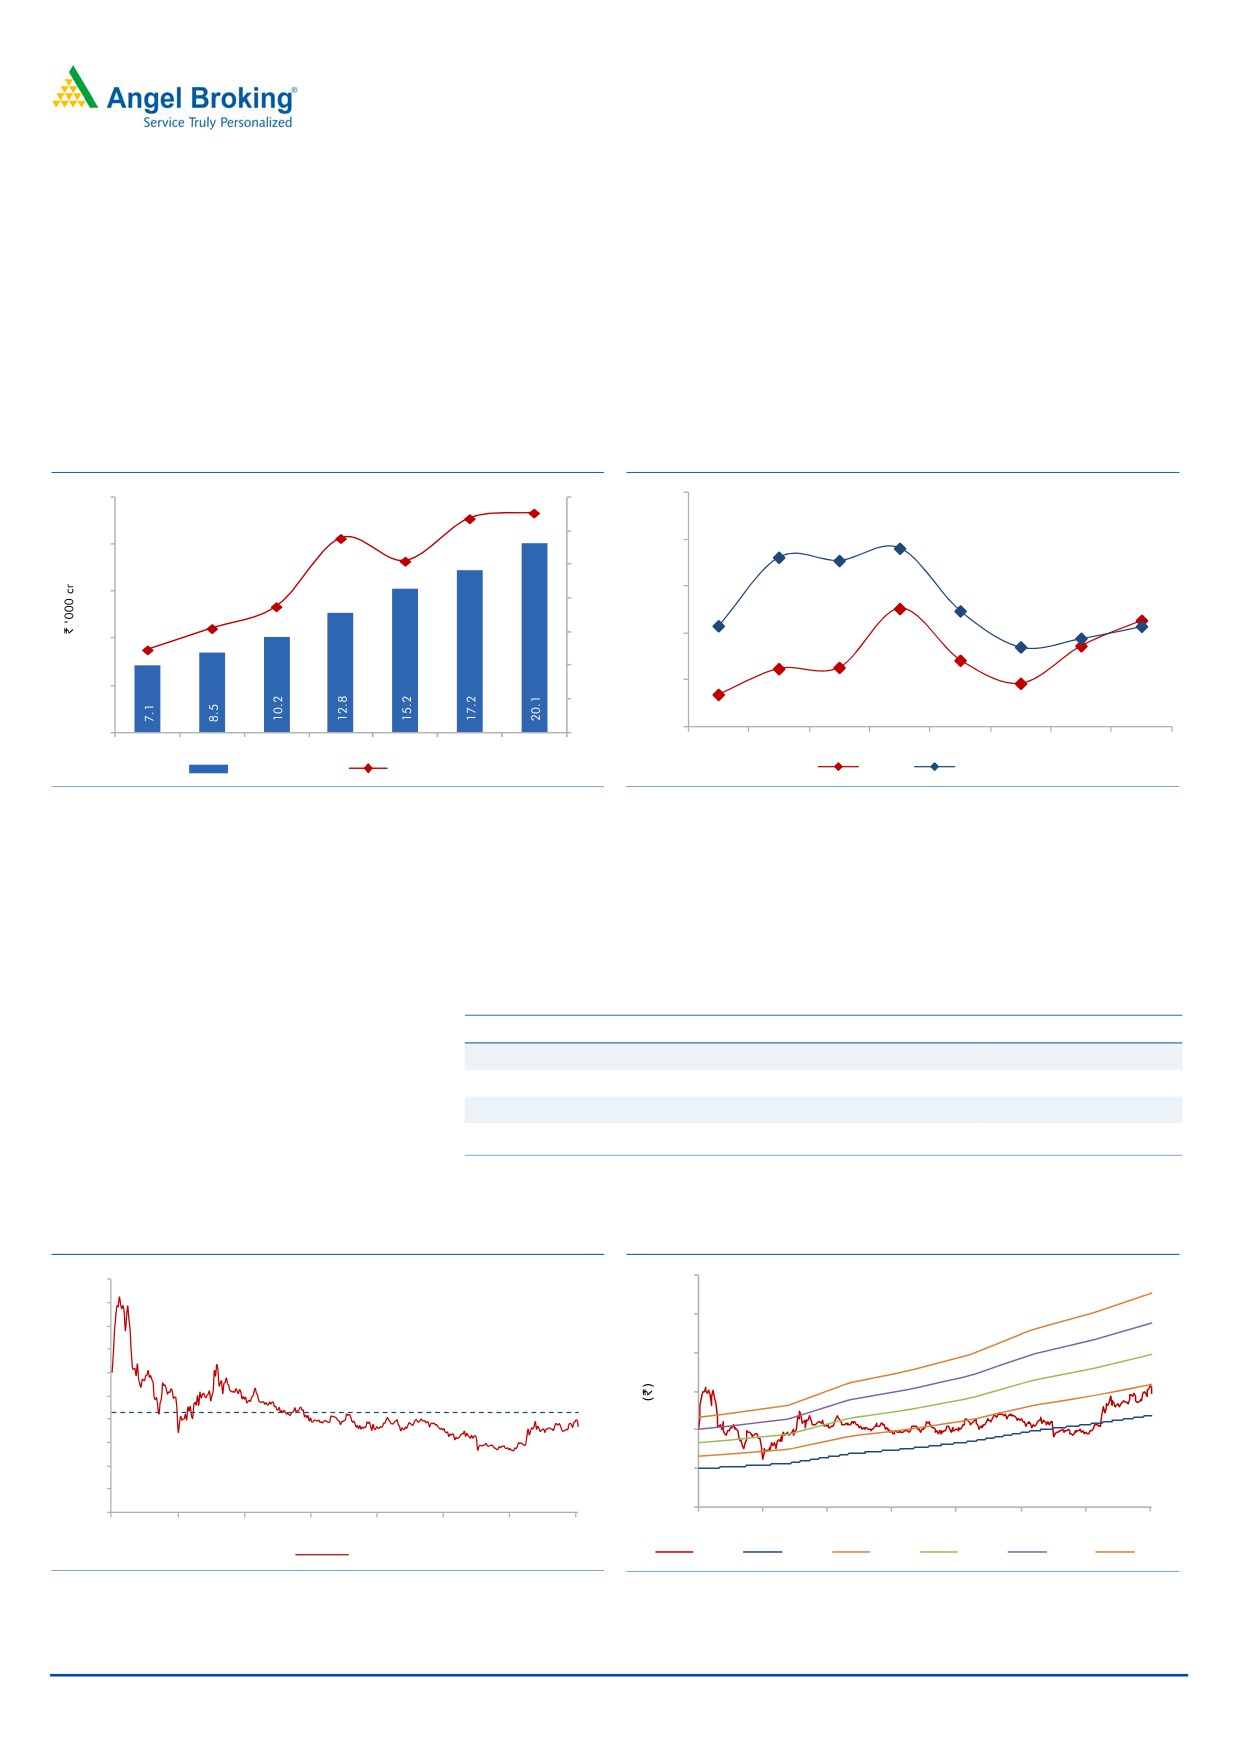
Inter-regional transmission capacity increased at a CAGR of 16% to 46,450MW as
on January 31, 2015 from 14,050MW on March 31, 2007. The inter-regional
transmission capacity is expected to reach 72,250MW by the end of the XII plan,
implying a CAGR of 24%.
Exhibit 4: Inter-regional transmission capacity
80
72
70
60
50
46
38
40
30
28
30
24
21
21
17
20
14
10
0
FY07
FY08
FY09
FY10
FY11
FY12
FY13
FY14
Jan-15
FY17
Source: Company, Angel Research
Total investment required during the XII plan was envisaged at `1,80,000cr to add
1,09,440ckm and transformation capacity of 2,70,000MVA. Under the XIII plan, a
further addition of 1,30,000ckm of transmission lines and 3,00,000MVA of
transformation capacity is foreseen. This will require an investment of more than
~`2,00,000cr. The power minister envisages an investment of `3,00,000cr over
the next five years to tackle the power shortages.
Majority of these investments would be towards inter-regional transmission
systems, which would directly benefit PGCIL. The company has planned a capital
outlay of `1,10,000cr during the XII plan. Further, we expect ~60-65% of XIII plan
investments in the transmission sector toward inter-state transmissions, implying a
capex outlay of ~`1,20,000-1,30,000cr by PGCIL.
Regulated ROE model assures steady earnings growth
PGCIL operates on a fixed ROE model
PGCIL receives its tariffs as per norms laid out by the CERC. CERC Regulations,
with an assured return of 15.5% on
2014 came into effect for a tariff block of five years starting from April 01, 2014.
projects.
The new regulations maintained the existing rate of return on equity (ROE) of
15.5%, with an additional 0.5% for timely completion of projects. The debt to
equity split for the transmission projects has also been maintained at 70:30.
The fixed ROE model implies that earnings growth is directly linked to the growth
in assets capitalised. The capitalisation rate in turn is directly linked to the rate of
capex and timely completion of projects. The company has outlined a strong capex
plan and has also demonstrated an excellent track record of execution and
management of transmission projects.
March 16, 2015
3
Power Grid Corporation of India | Initiating Coverage
We estimate PGCIL’s current projects under implementation to be upwards of
`100,000cr. The strong order pipeline and the amount of investments required in
the power transmission sector provide strong visibility for future earnings growth.
Strong capex plans to drive growth
After successfully achieving, its XI plan capex target of `55,000cr, PGCIL plans to
further invest `1,10,000cr during the XII plan, mainly towards development of
transmission infrastructure for implementation of various inter-state transmission
PGCIL has incurred a capex of
systems. The company plans to add
40,000ckm of transmission lines and
~`60,000cr till February 11, 2015 and
~1,00,000MVA of transformation capacity during the XII Plan. Of this, PGCIL has
remains well on track to achieve the XII
already commissioned about 23,479ckm (59%) of EHV transmission lines and
plan capex target
~95,861MVA (96%) of transformation capacity as on February 11, 2015.
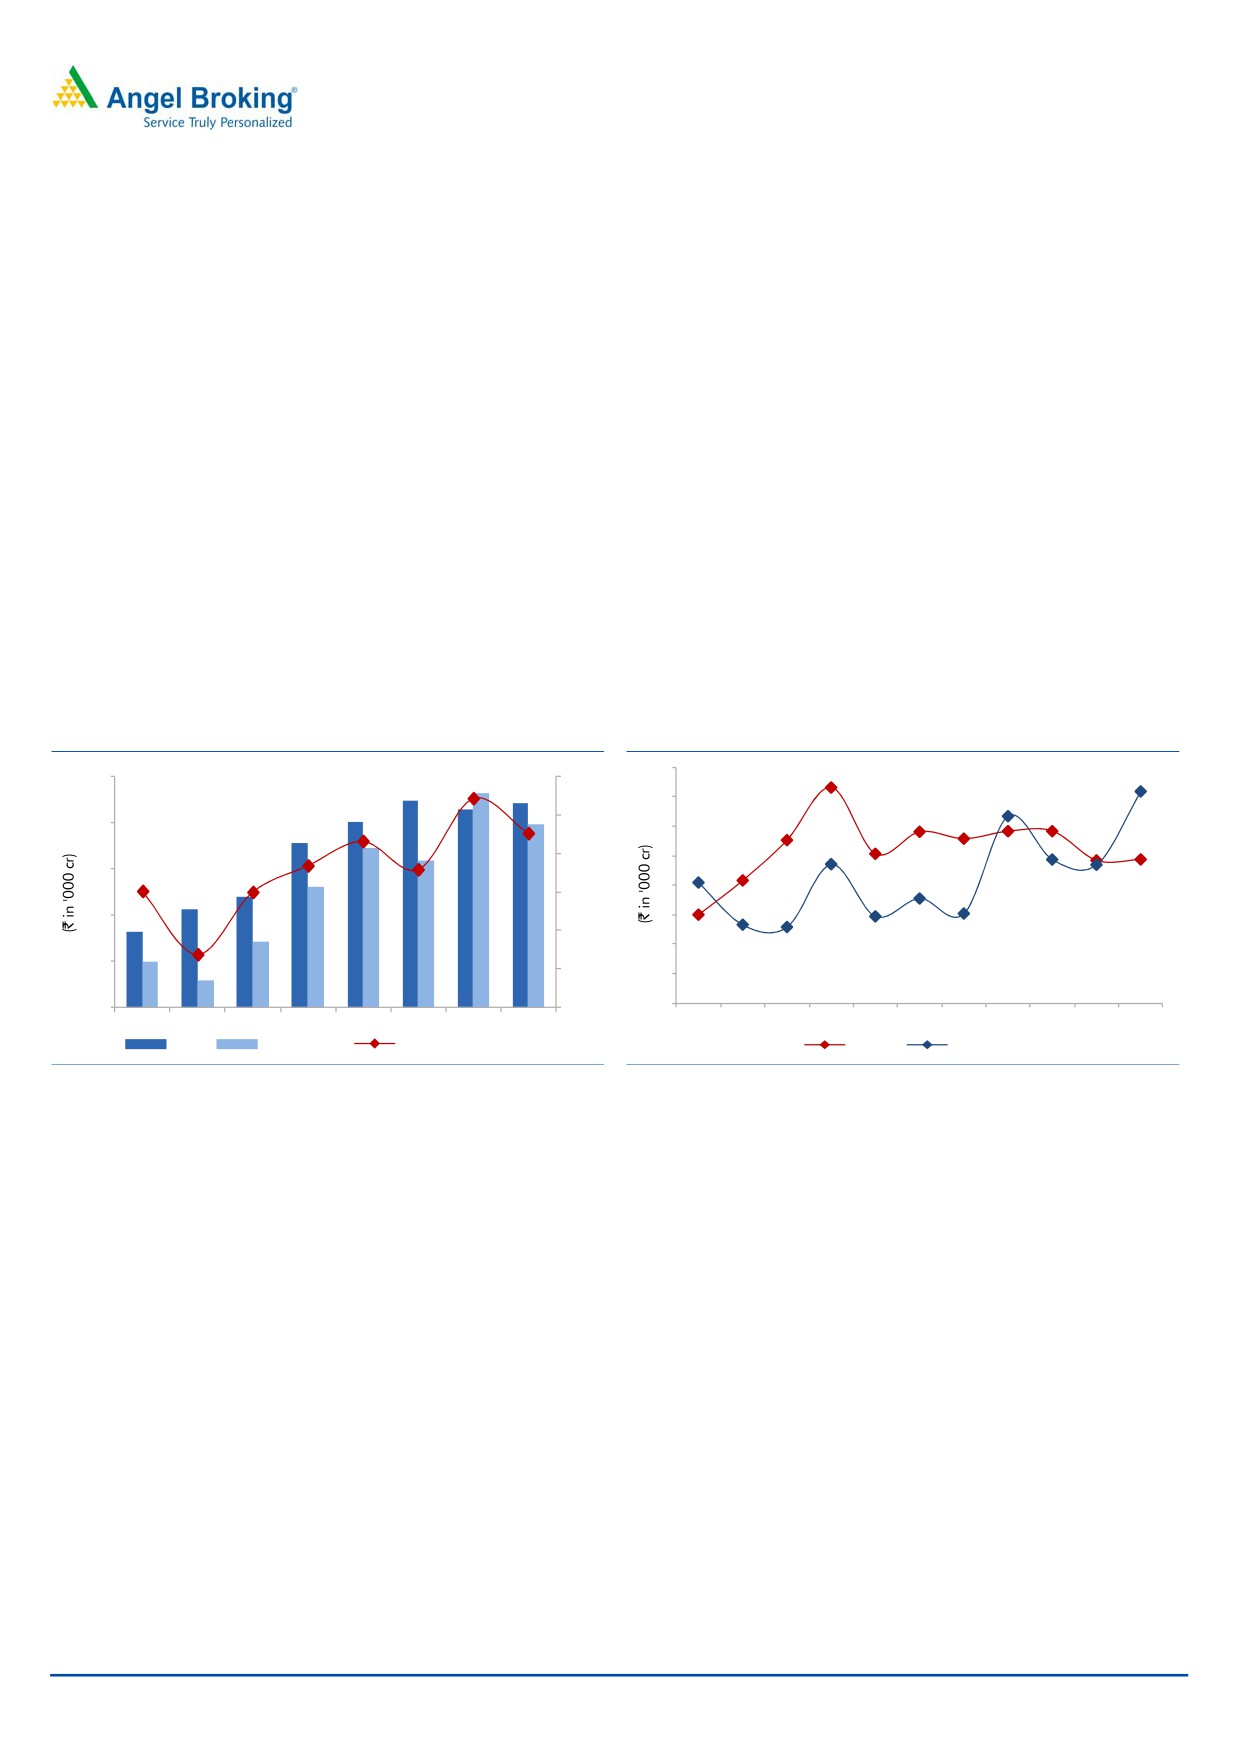
PGCIL has incurred a capex of `20,037cr and `22,324cr in FY2013 and FY2014,
respectively. Capex till February 11, 2015 was ~`17,700cr, taking the total capex
under the XII plan, to ~`60,000cr. The company remains well on track to achieve
the XII plan capex target.
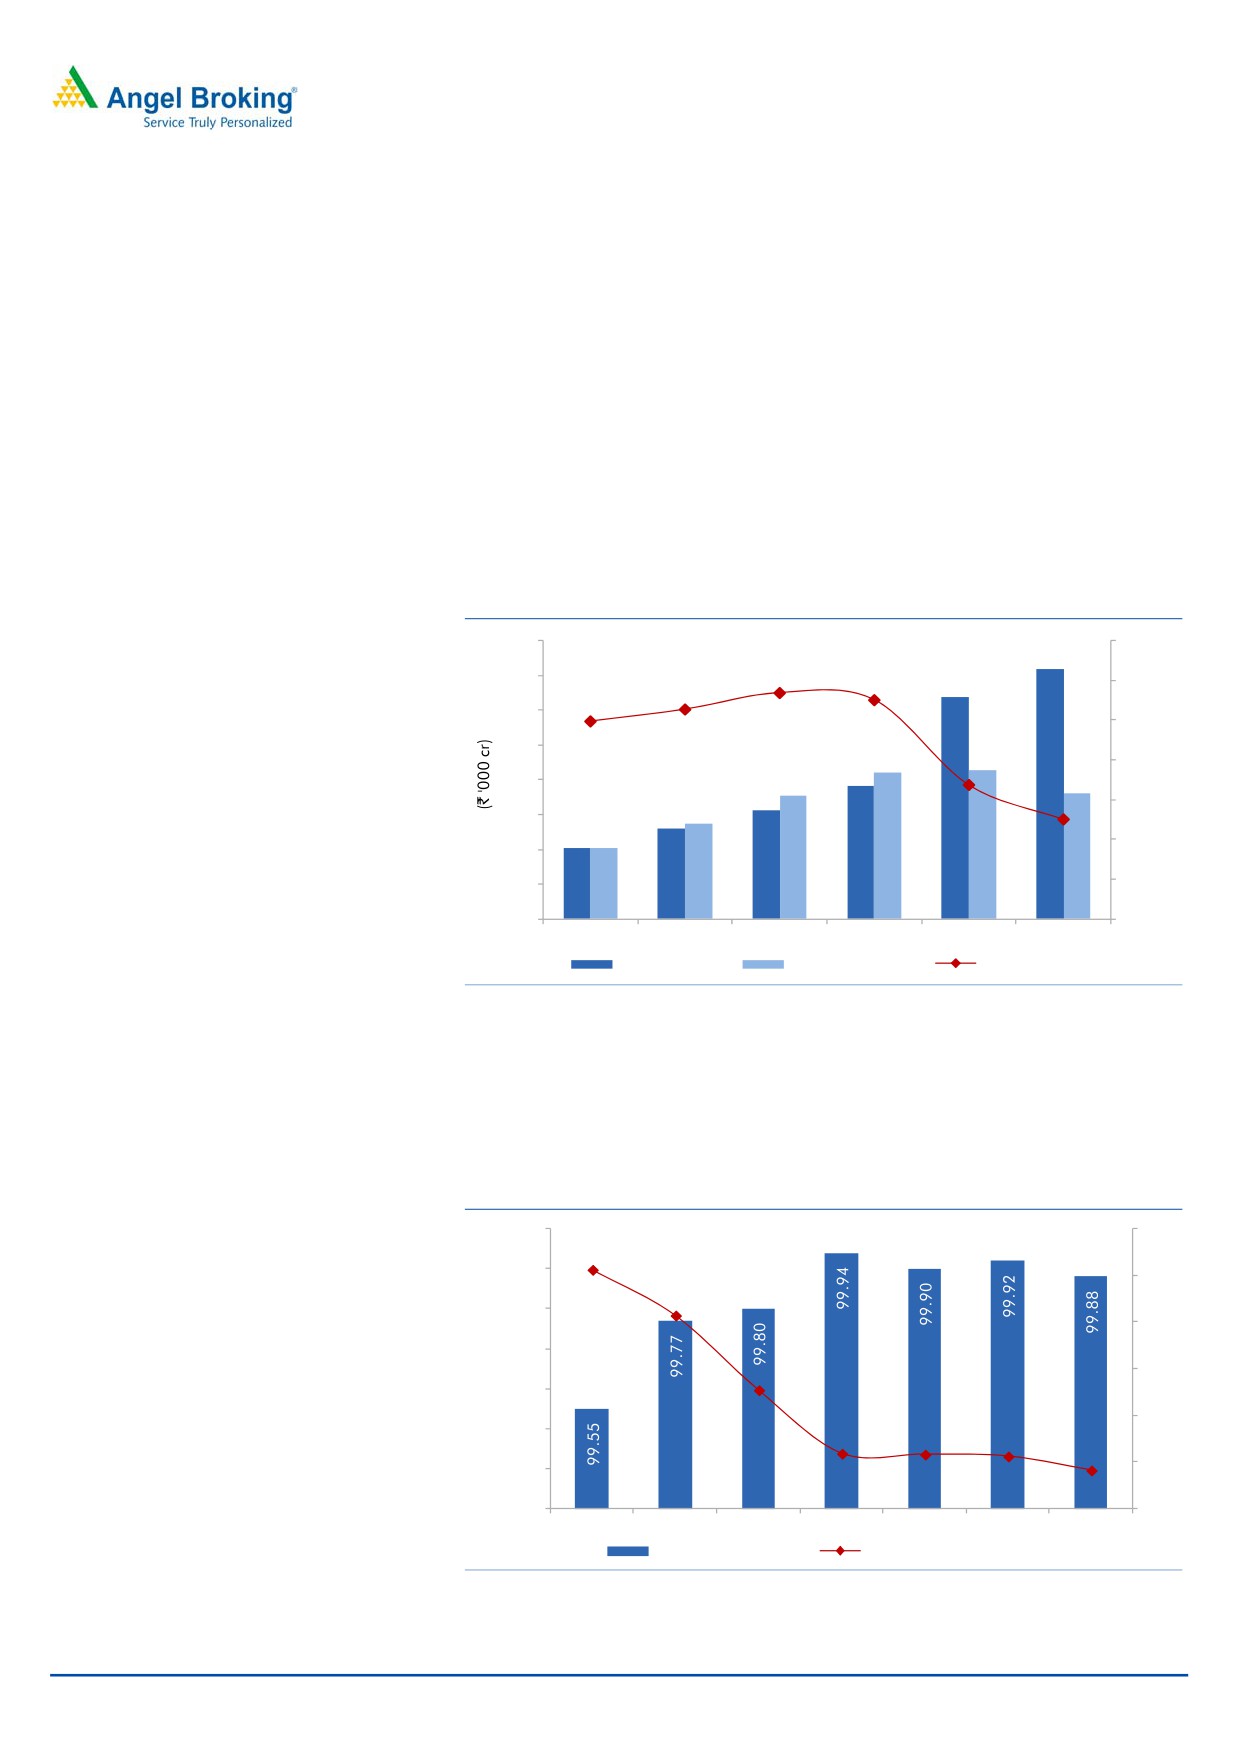
Exhibit 5: Capex / Capitalisation Trends
Exhibit 6: Recent quarterly Capex vs. Capitalisation
23
8
25
22
1.2
22
21
7
20
20
1.0
20
18
6
17
16
0.8
5
15
13
12
4
11
0.6
10
8
3
7
0.4
5
2
5
3
0.2
1
0
-
-
1Q13 2Q13 3Q13 4Q13 1Q14 2Q14 3Q14 4Q14 1Q15 2Q15 3Q15
FY09
FY10
FY11
FY12
FY13
FY14
FY15E FY16E
Capex
Capitalisation
Capitlisation/Capex (%)
Capex
Capitalisation
Source: Company, Angel Research
Source: Company, Angel Research
The pace of capitalisation has also increased in recent years, with FY2015
expected to have a capitalisation to capex ratio of
108%. The cumulative
capitalisation rate for the company has been ~90% over the FY2007-14 period.
We expect capitalisation rate to remain healthy over FY2016 and FY2017 at 90%
and 85% respectively led by the strong order pipeline, efficient operations and
execution track record.
Regulated projects to remain the significant portion of capex mix
Tariff-based competitive bidding (TBCB) has been made mandatory since January
2011, for all transmission projects, barring a few cases such as the experimental
1,200kv HVDC line and projects which are required urgently or in a compressed
time schedule as decided by Central Government as a case to case basis. At the
end of FY2014, Power Grid had won 6 (40%) out of the 15 projects put up for
bidding via the TBCB route. Aggregate levelised tariff for these projects won
through competitive bidding was is ~`565cr. The company has won two more
projects in FY2015
-
1) Transmission system strengthening associated with
Vindhyachal-V and 2) Transmission System Associated with Gadarwara (Part A&B).
The aggregate levelised tariff for these projects is ~`758cr.
March 16, 2015
4
Power Grid Corporation of India | Initiating Coverage
PGCIL is expected to incur a total capex of ~`12,000cr to execute these projects.
Based on the debt to equity ratio of 70:30, the company will require a total equity
of ~`3,600cr over the life of these projects. The current equity invested in these
projects stands at ~`800cr. We expect this to increase to ~`1500cr (3% of total
equity) by FY2017. Thus, projects assigned to PGCIL on cost plus basis would
continue to dominate the project mix over the next few years.
Efficient operations
PGCIL earns its tariff only on assets which are capitalised and not on the entire
capex it incurs. All the capital expenditure related to erection charges are shown as
capital work-in-progress (CWIP) till the date of capitalisation. A higher CWIP acts
as a drag on earnings and the company has over the last couple of years focused
on reducing CWIP, to increase the efficiency of operations.
Exhibit 7: CWIP & Construction Stores
40
140.0
36
35
113.7
32
120.0
110.1
105.4
99.4
30
100.0
25
21
21
80.0
19
67.4
20
18
18
16
14
50.1
60.0
15
13
10
10
40.0
10
20.0
5
-
-
FY10
FY11
FY12
FY13
FY14
FY15E
CWIP (installed)
Construction stores
Stores (% of CWIP)
Source: Company, Angel Research
The company has worked along with its suppliers to reduce the inventory of
materials, by ensuring payments are made only on actual erection at sites.
Material inventory as a % of CWIP has reduced to 50% at the end of 9MFY2015 as
against 114% in FY2012 and 110% in FY2013.
Exhibit 8: Availability and reliability
100.00
3.0
2.6
99.90
2.5
99.80
2.1
2.0
99.70
1.5
99.60
1.3
1.0
99.50
0.6
0.6
0.6
0.4
0.5
99.40
99.30
0.0
FY09
FY10
FY11
FY12
FY13
FY14
9M15
System Availability
Reliability (Trippings per line)
Source: Company, Angel Research
March 16, 2015
5
Power Grid Corporation of India | Initiating Coverage
PGCIL is one of the world’s largest transmission utility, managing over
928
transmission lines with a network length of 113,838ckm and 189 sub-stations with
a transformation capacity of 2,20,394MVA. Despite its size, the company has
consistently operated its transmission systems at high levels of efficiency, with a
system availability rate of >99% and trippings per line at <1%.
PGCIL has also pioneered the implementation of state-of-the-art smart grid
technologies in transmission, which makes existing infrastructure more robust,
reliable and efficient by using intelligent tools and technologies. Almost all the
attributes of a smart grid, viz. advance metering infrastructure, outage
management system, demand response, power quality management, etc. have
been successfully integrated at Smart Grid control centre at Puducherry.
Power Grid has also focused on indigenously developing smart products such as
smart meter, data concentrator unit, home energy management system, micro grid
controller, smart cap utilising solar energy, active filter etc. for varied applications.
March 16, 2015
6
Power Grid Corporation of India | Initiating Coverage
Outlook and Valuation
We like PGCIL for the high quality earnings and growth offered by the regulated
Going ahead, we expect Power Grid to
equity model, huge investments that are required in the transmission sector and
report a top-line CAGR of ~17% over
the execution track record of the company. We expect PGCIL to report a top-line
FY2014-17E to ~`7,277cr
CAGR of ~15% over FY2014-17E to ~`22,938cr led by the strong capex plans
and capitalisation rate. We expect the bottom-line to grow at a CAGR of 17% over
the same period.
Exhibit 9: Revenue & EBITDA margin
Exhibit 10: Return on Equity
25
86.5
87
22.0
86.4
85.8
86
19.6
20
85.1
20.0
19.2
19.1
85
83.8
18.0
15
16.9
83.1
84
16.3
16.3
15.8
82.5
83
16.0
17.0
15.4
10
16.5
82
15.4
14.0
14.8
5
14.5
14.5
81
13.8
13.4
-
80
12.0
FY10
FY11
FY12
FY13
FY14
FY15E
FY16E
FY10
FY11
FY12
FY13
FY14
FY15E FY16E FY17E
Revenue (` cr)
EBITDA Margin (%)
ROE
Regulated ROE
Source: Company, Angel Research
Source: Company, Angel Research
At the current market price of `147, the stock trades at a P/B of 1.8x and 1.7x its
FY2016E and FY2017E BV of `79.7 and `88.7, respectively. We initiate coverage
on the stock with a Buy recommendation and target price of `170, based on
~1.9x FY2017E book value, implying a 16% upside from current levels.
Exhibit 11: Valuation (FY2017E)
(` cr)
Equity
46,398
P/B (x)
1.9
Equity Value
89,005
Target price (`)
170
Source: Company, Angel Research
Exhibit 12: Average P/B
Exhibit 13: P/B Band
5.00
300
4.50
250
4.00
3.50
200
3.00
2.50
150
2.00
100
1.50
1.00
50
0.50
-
0
Oct-07
Oct-08
Nov-09
Dec-10
Dec-11
Jan-13
Feb-14
Mar-15
Oct-07
Oct-08
Nov-09
Dec-10
Dec-11
Jan-13
Feb-14
Mar-15
P/B
Price
1.5X
2.0X
2.5X
3.0X
3.5X
Source: Bloombert
Source: Bloomberg
March 16, 2015
7
Power Grid Corporation of India | Initiating Coverage
Risks to our target price
We are currently expecting an outlay of ~`1,20,000-1,30,000cr during the
XIII plan. A lower than expected capex outlay would be a negative for the
stock.
Increase in the rate of projects allocated through the tariff-based competitive
bidding (TBCB). Tariff bids under TBCB require an accurate assessment of
future costs, project execution timelines and operational complexities. The bids
under TBCB could end up being aggressive, posing risks to the financial
viability of these projects or affecting their execution.
We expect capitalisation to remain healthy at 90% and 85% in FY2016 and
FY2017, respectively. A higher than expected rate of capitalisation would be
positive for the stock.
March 16, 2015
8
Power Grid Corporation of India | Initiating Coverage
Company Background
Power Grid Corporation of India Ltd is the Central Transmission Utility (CTU) of the
country and a 'Navratna' company operating under the Ministry of Power. The
company is engaged in the power transmission business with the responsibility for
planning, implementation, operation and maintenance of inter-state
transmission system and operation of National & Regional Power Grids. As of
January 31, 2015, the company owns and operates a transmission network of
about 1,13,688ckm of transmission lines and 189 EHVAC & HVDC substations
with transformation capacity of about 2,20,394MVA. The company continues to
wheel ~50% of total power generated in the country through its transmission
network with a consistently high availability of over 99%.
Exhibit 13: Key Statistics (as on January 31, 2015)
Transmission
Consultancy
Telecom
1,13,688ckm transmission lines
Transmission related consultancy to
Owns and operates ~29,641kms of
189 sub-stations
more than 150 domestic clients
telecom network
>99% system availability
Global foot prints in
18 countries
Points of presence in ~317 locations
2,20,394MVA transformation capacity
catering to more than 20 clients
Intra-city network in
68 cities across
~45850MW inter-regional capacity
India
Source: Company
March 16, 2015
9
Power Grid Corporation of India | Initiating Coverage
Profit & Loss Statement (Standalone)
Y/E March (` cr)
FY2013
FY2014
FY2015E
FY2016E
FY2017E
Transmission Charges
11,754
14,046
16,512
19,390
22,212
Telecom & Consultancy
547
903
636
660
686
Net Sales
12,300
14,949
17,148
20,050
22,898
Other operating income
457
281
30
35
40
Total operating income
12,758
15,230
17,177
20,085
22,938
% chg
25.5
19.4
12.8
16.9
14.2
Transmission Expenses
368
456
561
659
755
Employee Expenses
886
942
1,016
1,168
1,311
Other Mfg costs
558
849
755
863
962
Provisions
3
22
10
15
17
EBITDA
10,943
12,961
14,835
17,380
19,892
% chg
28.6
18.4
14.5
17.2
14.5
(% of Net Sales)
85.8
85.1
86.4
86.5
86.7
Depreciation & Amortisation
3,352
3,996
5,034
5,906
6,646
EBIT
7,591
8,965
9,800
11,473
13,246
% chg
27.8
18.1
9.3
17.1
15.4
(% of Net Sales)
59.5
58.9
57.1
57.1
57.7
Interest & other Charges
2,535
3,168
3,965
4,357
4,744
Other Income
571
491
533
585
645
(% of PBT)
10.1
7.8
8.4
7.6
7.1
Share in profit of Associates
-
-
-
-
-
Recurring PBT
5,627
6,289
6,368
7,701
9,147
% chg
21.9
11.8
1.3
20.9
18.8
Extraordinary Inc/(Expense)
18
(25)
(95)
-
-
PBT (reported)
5,645
6,264
6,273
7,701
9,147
Tax
1,410
1,766
1,282
1,574
1,870
(% of PBT)
25.0
28.2
20.4
20.4
20.4
PAT (reported)
4,235
4,497
4,991
6,127
7,277
ADJ. PAT
4,216
4,523
5,086
6,127
7,277
% chg
28.7
7.3
12.4
20.5
18.8
(% of Net Sales)
33.0
29.7
29.6
30.5
31.7
Basic EPS (`)
9.1
9.4
9.5
11.7
13.9
Adj. fully Diluted EPS (`)
9.1
9.4
9.7
11.7
13.9
% chg
28.7
3.4
3.3
20.5
18.8
March 16, 2015
10
Power Grid Corporation of India | Initiating Coverage
Balance Sheet (Standalone)
Y/E March (` cr)
FY2013
FY2014
FY2015E
FY2016E
FY2017E
SOURCES OF FUNDS
Equity Share Capital
4,630
5,232
5,232
5,232
5,232
Reserves & Surplus
21,610
29,228
32,467
36,443
41,166
Shareholders Funds
26,239
34,460
37,699
41,675
46,398
Share Warrants
-
-
-
-
-
Total Loans
68,188
83,170
95,221
1,05,304
1,15,562
Deferred Tax Liability
1,959
2,443
2,432
2,421
2,411
Other Long term liabilities
4,708
5,855
5,998
6,431
6,527
Long term provisions
443
524
591
692
790
Total Liabilities
1,01,537
1,26,452
1,41,941
1,56,522
1,71,687
APPLICATION OF FUNDS
Gross Block
80,600
96,504
1,19,661
1,39,506
1,58,673
Less: Acc. Depreciation
19,199
23,350
28,384
34,290
40,937
Net Block
61,401
73,154
91,277
1,05,215
1,17,736
Capital Work-in-Progress
19,115
31,851
31,374
33,040
35,460
Construction Stores
21,038
21,479
20,218
20,756
21,719
Investments
964
814
900
900
900
Non-current Loans & Adv.
2,351
3,190
3,435
4,017
4,588
Current Assets
6,265
9,100
9,505
9,857
10,995
Cash
1,662
4,418
4,205
3,606
3,755
Loans & Advances
429
472
532
623
711
Other
4,175
4,211
4,768
5,629
6,529
Current liabilities
9,597
13,138
14,767
17,263
19,711
Net Current Assets
(3,331)
(4,037)
(5,262)
(7,406)
(8,716)
Mis. Exp. not written off
-
-
-
-
-
Total Assets
1,01,537
1,26,452
1,41,941
1,56,522
1,71,687
March 16, 2015
11
Power Grid Corporation of India | Initiating Coverage
Cashflow Statement (Standalone)
Y/E March (` cr)
FY2013
FY2014
FY2015E FY2016E FY2017E
Profit before tax
5,645
6,264
6,273
7,701
9,147
Depreciation
3,380
4,011
5,034
5,906
6,646
Change in Working Capital
1,241
3,333
1,002
1,941
1,848
Others
2,091
2,809
4,175
4,483
4,539
Direct taxes paid
(1,072)
(1,157)
(1,282)
(1,574)
(1,870)
Cash Flow from Operations
11,284
15,259
15,202
18,457
20,310
(Inc.)/ Dec. in Fixed Assets
(22,389)
(26,735)
(21,418)
(22,050)
(22,550)
(Inc.)/ Dec. in Investments
137.0
148.8
(85.8)
-
-
Others
303
209
(246)
(581)
(571)
Cash Flow from Investing
(21,948)
(26,378)
(21,749)
(22,631)
(23,121)
Issue of Equity
0
5,297
0
0
0
Inc./(Dec.) in loans
13,795
12,720
12,051
10,083
10,258
Dividend Paid (Incl. Tax)
(1,569)
(1,391)
(1,752)
(2,150)
(2,554)
Others
(2,236)
(2,752)
(3,965)
(4,357)
(4,744)
Cash Flow from Financing
9,990
13,874
6,334
3,575
2,960
Inc./(Dec.) in Cash
(675)
2,756
(213)
(599)
150
Opening Cash balances
2,337
1,662
4,418
4,205
3,606
Closing Cash balances
1,662
4,418
4,205
3,606
3,755
March 16, 2015
12
Power Grid Corporation of India | Initiating Coverage
Key Ratios
Y/E March
FY2013
FY2014
FY2015E
FY2016E
FY2017E
Valuation Ratio (x)
P/E (on FDEPS)
16.0
15.6
15.4
12.5
10.5
P/CEPS
9.0
8.3
7.6
6.4
5.5
P/BV
2.6
2.2
2.0
1.8
1.7
Dividend yield (%)
1.9
1.8
2.0
2.4
2.8
EV/Sales
10.5
10.2
9.7
8.9
8.2
EV/EBITDA
12.3
12.0
11.3
10.2
9.5
EV/Total Assets
1.3
1.2
1.2
1.1
1.1
Per Share Data (`)
Adjusted EPS (Basic)
9.1
9.4
9.7
11.7
13.9
Adjusted EPS (fully diluted)
9.1
9.4
9.7
11.7
13.9
Cash EPS
16.3
17.7
19.3
23.0
26.6
DPS
2.8
2.6
2.9
3.5
4.2
Book Value
56.7
65.9
72.1
79.7
88.7
Dupont Analysis
EBIT margin
59.5
58.9
57.1
57.1
57.7
Tax retention ratio (%)
75.0
71.8
79.6
79.6
79.6
Asset turnover (x)
0.1
0.1
0.1
0.1
0.1
ROIC (Post-tax)
6.7
6.1
6.3
6.6
6.9
Cost of Debt (Post Tax)
3.1
3.0
3.5
3.5
3.4
Leverage (x)
2.4
2.4
2.3
2.4
2.4
Operating RoE
15.1
13.6
12.9
14.2
15.3
Returns (%)
RoCE (Pre-tax)
8.7
8.3
7.7
8.1
8.4
Angel RoIC (Pre-tax)
15.6
15.4
13.9
13.4
13.6
RoE
17.0
14.9
14.1
15.4
16.5
Turnover ratios (x)
Asset Turnover (Gross Block)
0.2
0.2
0.2
0.2
0.2
Inventory (days)
14
15
16
17
18
Receivables (days)
42
36
36
36
37
Payables (days)
44
45
51
47
47
WC cycle (ex-cash) (days)
(116)
(161)
(190)
(186)
(187)
Solvency ratios (x)
Net debt to equity
2.5
2.3
2.4
2.4
2.4
Net debt to EBITDA
6.1
6.1
6.1
5.8
5.6
Interest Coverage
3.0
2.8
2.5
2.6
2.8
March 16, 2015
13
Power Grid Corporation of India | Initiating Coverage
Research Team Tel: 022 - 39357800
DISCLAIMER
Angel Broking Private Limited (hereinafter referred to as “Angel”) is a registered Member of National Stock Exchange of India Limited,
Bombay Stock Exchange Limited and MCX Stock Exchange Limited. It is also registered as a Depository Participant with CDSL and
Portfolio Manager with SEBI. It also has registration with AMFI as a Mutual Fund Distributor. Angel has received in-principal approval
from SEBI for registering as a Research Entity in terms of SEBI (Research Analyst) Regulations, 2014. Angel or its associates has not
been debarred/ suspended by SEBI or any other regulatory authority for accessing /dealing in securities Market. Angel or its associates
including its relatives/analyst do not hold any financial interest/beneficial ownership of more than 1% in the company covered by
Analyst. Angel or its associates/analyst has not received any compensation / managed or co-managed public offering of securities of
the company covered by Analyst during the past twelve months. Angel/analyst has not served as an officer, director or employee of
company covered by Analyst and has not been engaged in market making activity of the company covered by Analyst.
This document is solely for the personal information of the recipient, and must not be singularly used as the basis of any investment
decision. Nothing in this document should be construed as investment or financial advice. Each recipient of this document should
make such investigations as they deem necessary to arrive at an independent evaluation of an investment in the securities of the
companies referred to in this document (including the merits and risks involved), and should consult their own advisors to determine
the merits and risks of such an investment.
Reports based on technical and derivative analysis center on studying charts of a stock's price movement, outstanding positions and
trading volume, as opposed to focusing on a company's fundamentals and, as such, may not match with a report on a company's
fundamentals.
The information in this document has been printed on the basis of publicly available information, internal data and other reliable
sources believed to be true, but we do not represent that it is accurate or complete and it should not be relied on as such, as this
document is for general guidance only. Angel Broking Pvt. Limited or any of its affiliates/ group companies shall not be in any way
responsible for any loss or damage that may arise to any person from any inadvertent error in the information contained in this report.
Angel Broking Pvt. Limited has not independently verified all the information contained within this document. Accordingly, we cannot
testify, nor make any representation or warranty, express or implied, to the accuracy, contents or data contained within this document.
While Angel Broking Pvt. Limited endeavors to update on a reasonable basis the information discussed in this material, there may be
regulatory, compliance, or other reasons that prevent us from doing so.
This document is being supplied to you solely for your information, and its contents, information or data may not be reproduced,
redistributed or passed on, directly or indirectly.
Neither Angel Broking Pvt. Limited, nor its directors, employees or affiliates shall be liable for any loss or damage that may arise from
or in connection with the use of this information.
Note: Please refer to the important `Stock Holding Disclosure' report on the Angel website (Research Section). Also, please refer to the
latest update on respective stocks for the disclosure status in respect of those stocks. Angel Broking Pvt. Limited and its affiliates may
have investment positions in the stocks recommended in this report.
Disclosure of Interest Statement
Power Grid Corporation of India
1. Analyst ownership of the stock
No
2. Angel and its Group companies ownership of the stock
No
3. Angel and its Group companies' Directors ownership of the stock
Yes
4. Broking relationship with company covered
No
Note: We have not considered any Exposure below ` 1 lakh for Angel, its Group companies and Directors
Ratings (Based on expected returns
Buy (> 15%)
Accumulate (5% to 15%)
Neutral (-5 to 5%)
over 12 months investment period):
Reduce (-5% to -15%)
Sell (< -15
March 16, 2015
14