Initiating coverage | Cement
December 22, 2014
Orient Cement
BUY
CMP
`148
Capacity expansion plan on track
Target Price
`183
Capacity expansion to drive volume growth: Orient Cement Ltd (Orient), a CK
Investment Period
12 Months
Birla group company having its plants in Telengana (capacity 3mtpa) and
Maharashtra (capacity 2mtpa), is expanding its cement capacity by 3mtpa (an
Stock Info
increase of 60%) to 8mtpa by 1QFY2016. The new plant is expected to be the
Sector
Cement
next growth driver as it would contribute significantly to volume growth. We expect
Market Cap (` cr)
3,032
Orient to report a healthy 14.1% volume CAGR during FY2014-16E, aided by
Net debt (` cr)
(327)
expected improvement in cement demand. The improvement in demand is
Beta
1.1
expected on the back of pick up in infrastructure activities with a stable
52 Week High / Low
158/34
government at the centre, resolution of Telengana-Seemandhara dispute, and
Avg. Daily Volume
86,767
progressive state governments in the company’s key markets (Telengana, Andhra
Face Value (`)
1
Pradesh and Maharashtra, which account for 89% of sales). Improvement in
BSE Sensex
27,372
cement demand is expected to take cement prices higher; we expect realizations
Nifty
8,225
for Orient to increase at a CAGR of 8.5% over FY2014-16E (in 1HFY15
Reuters Code
ORCE.BO
realizations grew by 7.2%).
Bloomberg Code
ORCMNT IN
A cost efficient player: Orient has been one of the most cost efficient companies in
the cement industry. The company’s plants are located in close vicinity of its raw
material reserves and the average lead distance of 300km shows that the product
Shareholding Pattern (%)
is sold in regions closer to the place of manufacture, thus translating into freight
Promoters
37.5
cost per tonne of `744 as on FY2014, which is among the lowest in the industry.
MF / Banks / Indian Fls
29.6
The Electricity cost per tonne of
`926 is also among the lowest in the industry
FII / NRIs / OCBs
18.5
with the company being well supported by a 50MW captive power plant. The new
Indian Public / Others
14.4
plant at Gulbarga will source coal from Singareni Collieries which is at a distance
of 450km from the plant. This will increase the landing cost of coal, but this
plant’s efficiency will still be higher compared to the existing plant. Thus we expect
Since
Abs. (%)
3m 1yr
the low cost structure of Orient to continue going forward.
Listing
Sensex
1.0
32.2
37.9
Valuation: At CMP of `148 the stock is trading at FY2016E EV/ton of $86 (on
Orient Cement
27.2
271.3
369.1
FY16E 8mtpa installed capacity), which is at a discount to its south based peers
(Ramco Cement trades at $120/tonne). The stock is trading at 8.8x and 8.9x its
*Orient Cement Listed on 16th July 2013
FY2015E and FY2016E EV/EBITDA, respectively. We initiate coverage on Orient
Cement with a Buy recommendation and target price of `183 based on 10.6x
FY2016E EV/EBIDTA and at EV/tonne of $95.
Key Financials
Y/E March (` cr)
FY13
FY14
FY15E
FY16E
Net Sales
1,502
1,438
1,622
2,185
% chg
0.0
(4.2)
12.8
34.7
Net Profit
162
101
163
160
% chg
0.0
(37.5)
61.2
(1.7)
EBITDA (%)
21.2
14.9
19.3
22.0
EPS (`)
8
5
8
8
P/E (x)
18.8
30.0
18.6
19.0
P/BV (x)
4.0
3.7
3.2
2.9
RoE (%)
12.7
18.4
16.0
RoCE (%)
13.8
13.5
14.0
Shrenik Gujrathi
EV/Sales (x)
2.0
2.1
1.7
2.0
022 39357800 Ext:6872
EV/EBITDA (x)
9.3
13.7
8.8
8.9
Source: Company, Angel Research; CMP as of December 19, 2014
Please refer to important disclosures at the end of this report
1
Orient Cement | Initiating coverage
Investment Arguments
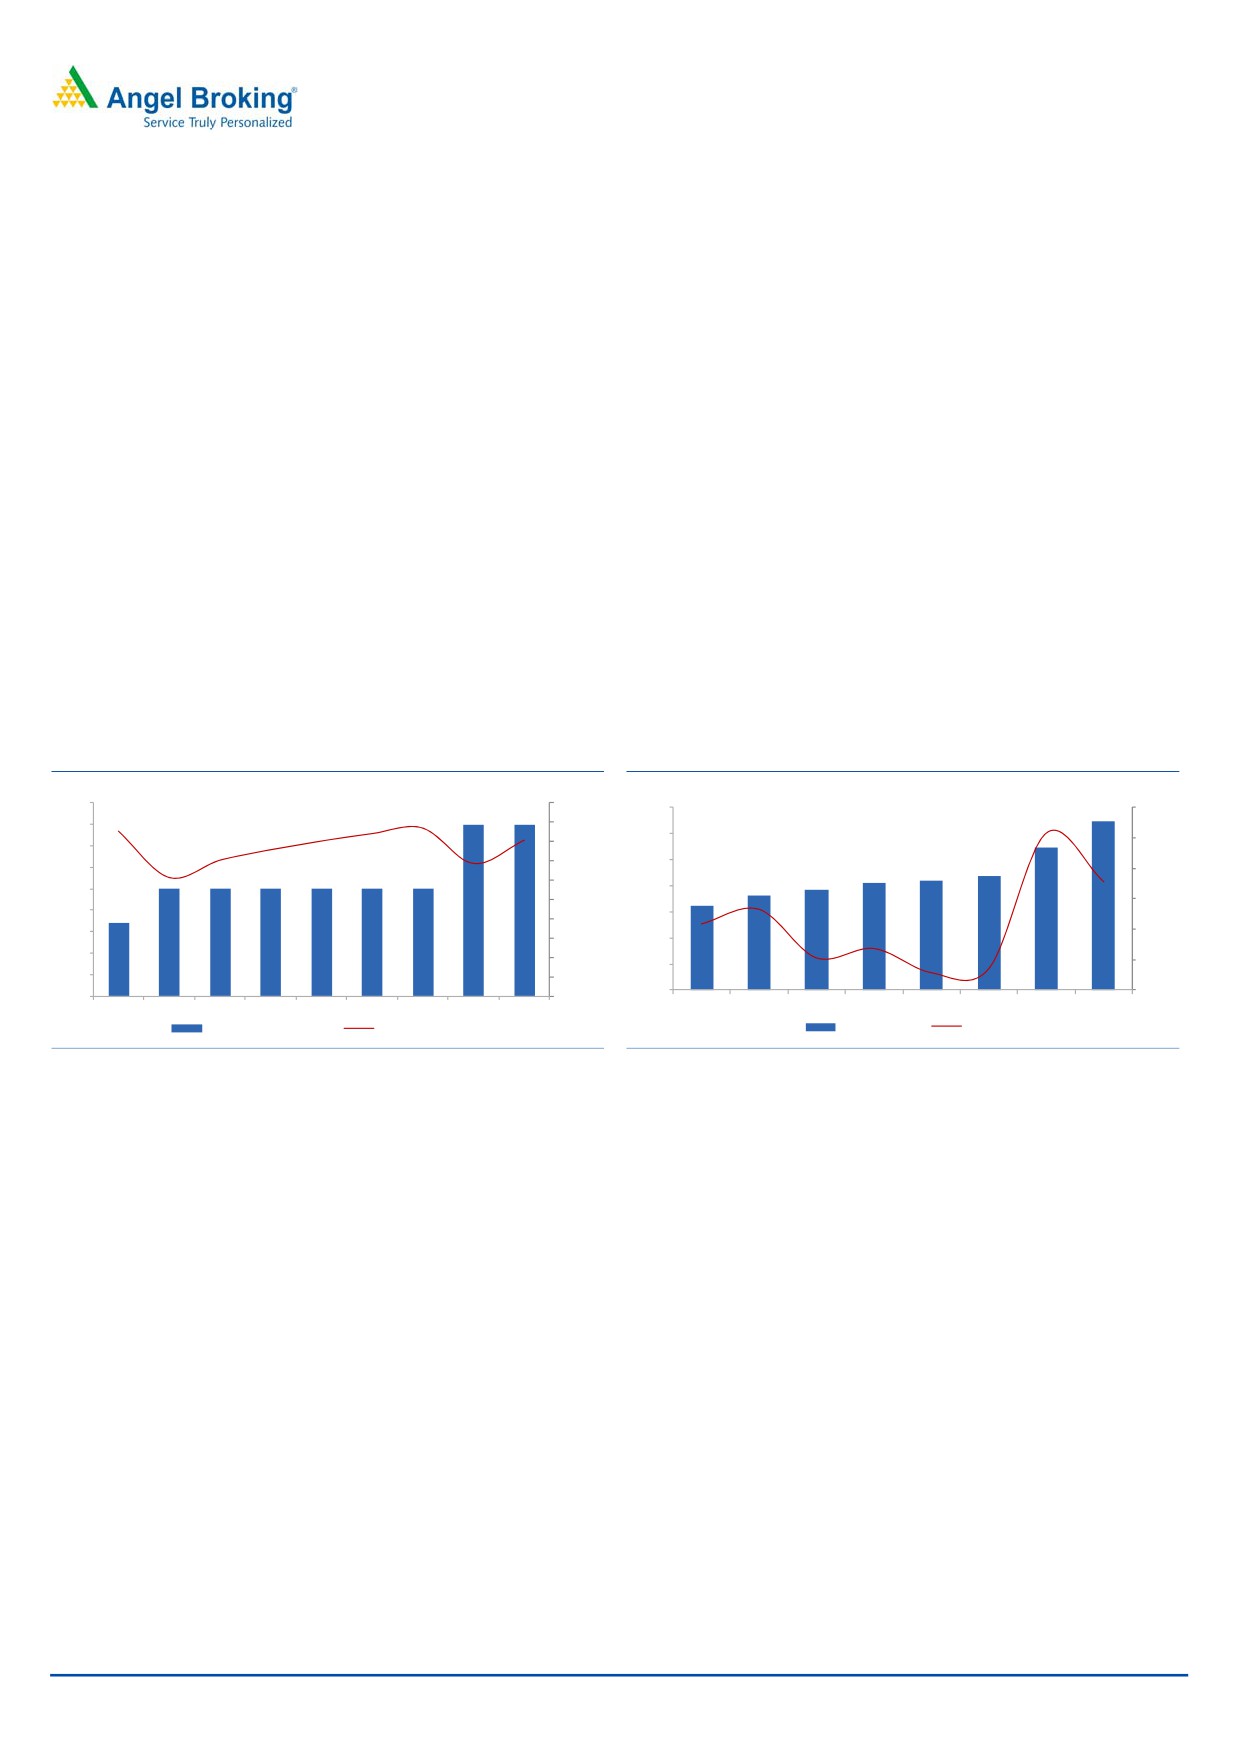
Capacity expansion plan on track: Orient is setting up a 3mn tonne per annum
(mtpa) cement grinding unit (2mtpa clinker capacity) at Chittapur in Gulbarga
district, Karnataka. It also has a 45MW captive power plant along with a 7MW
waste heat recovery system, which will comprehensively fulfill the fuel requirement
of the plant. Towards this plant, the company will incur a capex of `1,700cr, of
which `1,200cr would be financed through debt and the rest `520cr through
internal accruals. The plant is expected to be commissioned by 1QFY2016 and is
expected to be the next growth driver as it would contribute significantly towards
volume growth. A stable government at the centre, resolution of the
Telengana-Seemandhra dispute and progressive state governments in key markets
of the company (Telengana, Andhra Pradesh and Maharashtra, which account for
89% of company’s sales) will provide a boost to infrastructure activities which will
drive demand going forward. Hence, we expect robust volume growth for the
company, ie at a CAGR of 14.1% during FY2014-16E. As demand improves we
expect cement prices to move higher. We expect realizations for Orient to grow at
a CAGR of 8.5% over FY2014-16E (in 1HFY15 realizations grew by 7.2%).
Exhibit 1: Cement Capacity and utilization levels
Exhibit 2: Volume Growth Trend
(mn tn)
(mn tn)
9
100.0
7.0
30.0
84.1
68.4
80.6
25.9
8
90.0
87.0
85.4
80.2
6.0
75.6
80.0
25.0
7
70.2
6.5
70.0
5.0
4.4
6
61.1
4.1
4.2
5.5
20.0
60.0
3.6
3.8
5
4.0
8
50.0
3.2
17.8
15.0
5
5
5
5
8
4
5
5
3.0
13.3
40.0
10.9
3
10.0
3.4
30.0
2.0
5.2
2
6.8
20.0
5.0
1.0
1
10.0
2.8
3.5
0.0
0.0
0
0.0
FY10
FY11
FY12
FY13
FY14
FY15E FY16E FY17E
FY09
FY10
FY11
FY12
FY13
FY14
FY15E FY16E FY17E
Capacity(mn tonnes)
Capacity utilization(%)
Sales Volume
yoy%
Source: Company, Angel Research
Source: Company, Angel Research
A cost efficient player: Orient has been one of the most cost efficient companies in
the cement industry. The company’s Devapur cement manufacturing plant is
located in a high-quality limestone reserve belt which is just 2km from the plant.
The company has linkage coal from Singareni Collieries which enables it in
maintaining coal costs at lower levels. Fly Ash is sourced from NTPC’s
Ramagundam Thermal Power Plant, located at a distance of around 40km from
the Devapur plant, while Fly Ash for the Jalgaon plant will be sourced from NTPC’s
Bhusawal Thermal Power Plant which is located at a distance of 20km from the
plant. This will help in keeping the fly ash cost lower due to low lead distance.
Orient’s average lead distance is of 300km, which indicates that the products are
sold in nearby areas to the place of manufacture. The low lead distance aided in
keeping freight cost per tonne lower at `744 for FY2014 which is the lowest in
industry. The Electricity cost per tonne at `926 is also one of the lowest in the
industry as the plant is well supported by a 50MW captive power plant. The new
plant at Gulbarga will also source coal from Singareni Collieries which is at a
distance of 450km from the plant. This will increase the landing cost of coal, but
this new plant’s efficiency will still be higher compared to the existing plant. Thus
we expect the low cost structure of Orient to continue going forward.
December 22, 2014
2
Orient Cement | Initiating coverage
Exhibit 3: Power cost per tonne versus peers
Exhibit 4: Freight cost per tonne versus peers
Company
FY13
FY14
Company
FY13
FY14
ACC*
988
996
ACC*
926
968
Ultratech
1,071
1,014
Ultratech
1,053
1,116
Ramco Cement
956
969
Ramco Cement
920
961
India Cement
1,249
1,272
India Cement
954
1,006
JK Lakshmi Cement
766
750
JK Lakshmi Cement
795
812
Orient Cement
927
926
Orient Cement
759
744
Source: Company, Angel Researc; Note: *ACC has December year ending
Source: Company, Angel Research; Note: *ACC has December year ending
Exhibit 5: Total cost per tonne versus peers
Company
FY13
FY14
ACC*
3,797
3,987
Ultratech
3,862
4,036
Ramco Cement
3,379
3,602
India Cement
3,735
3,892
JK Lakshmi Cement
3,068
3,117
Orient Cement
2,892
2,911
Source: Company, Angel Research; Note: *ACC has December year ending
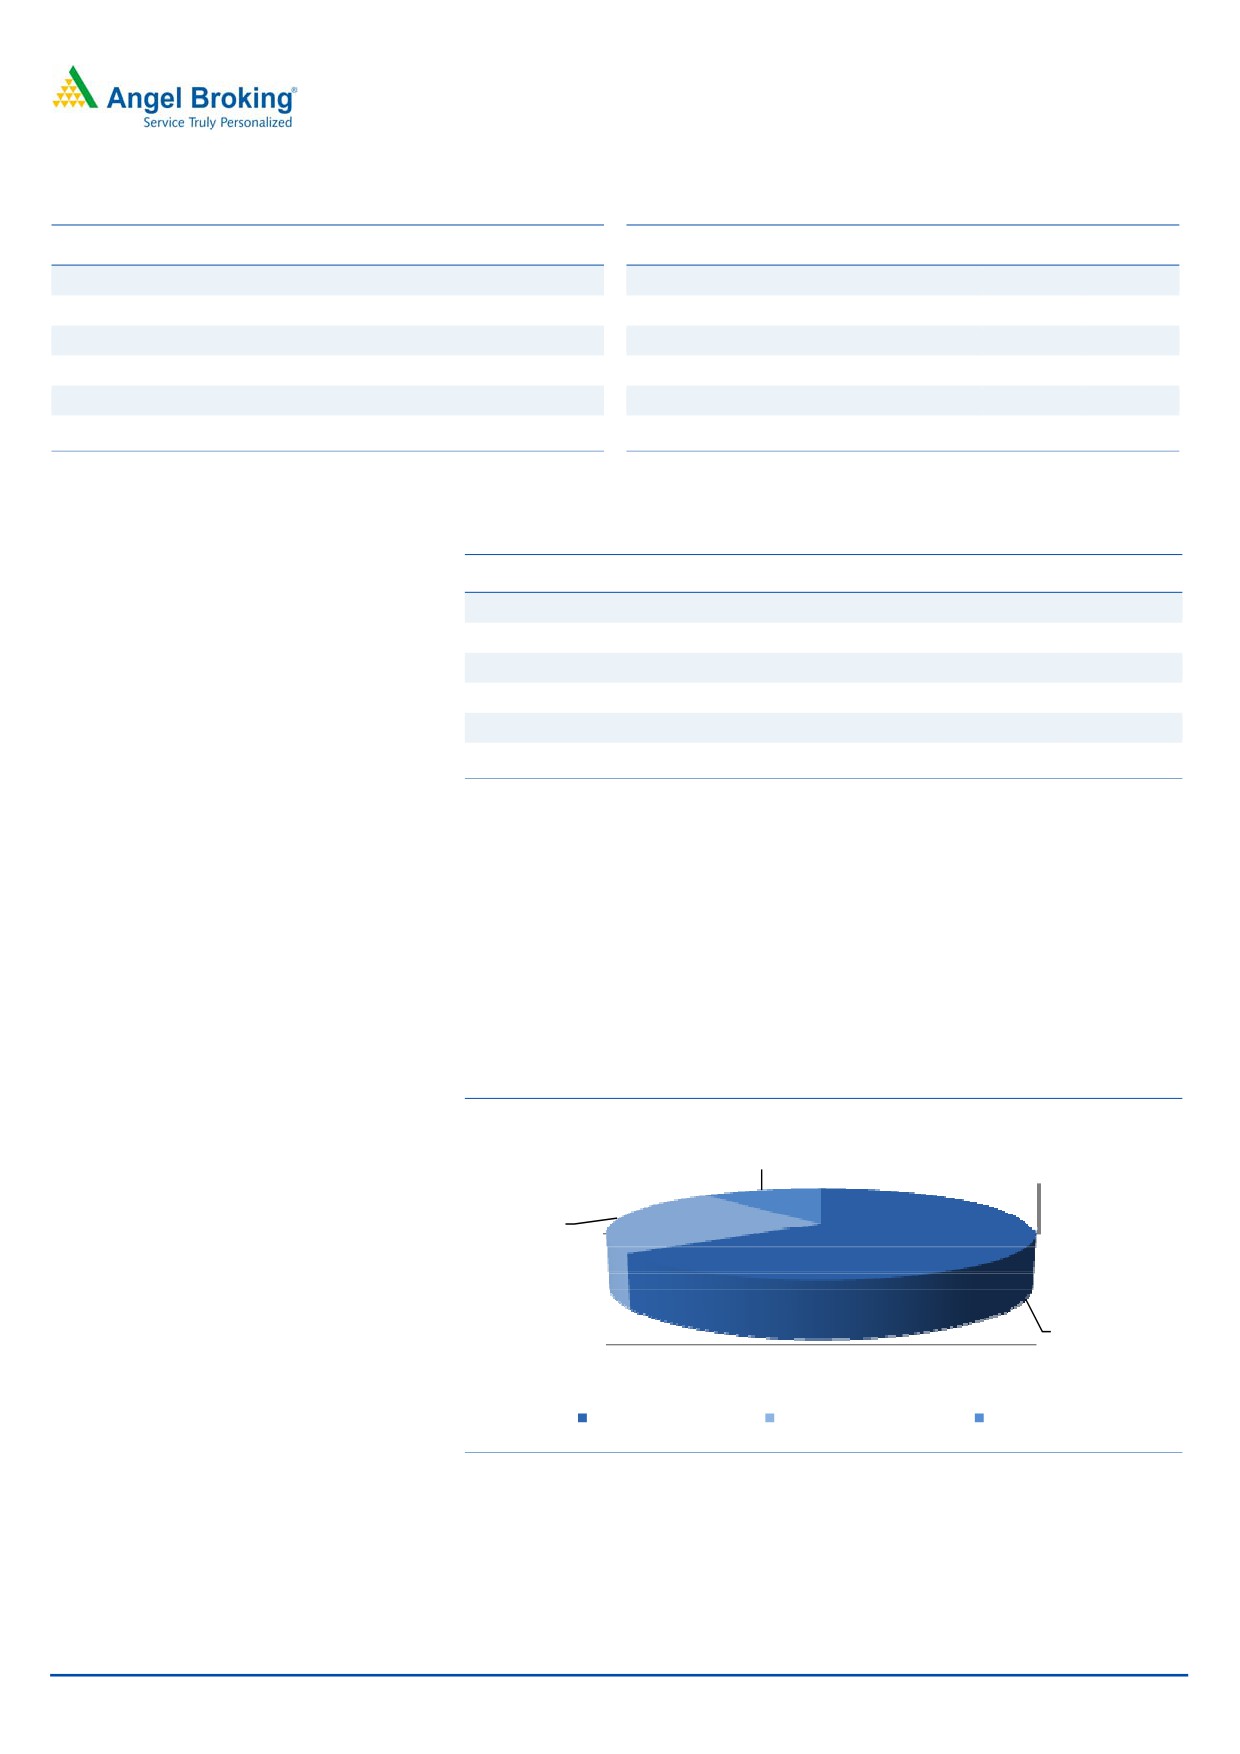
Strong market mix: Currently 60% of Orient’s capacity is located in the south.
Despite this, 65% of its sales are accrued from the Maharashtra region. Orient had
a utilization level of 84% in FY2014 which is much higher than any of its peers in
the south (which had utilization levels at 68-70%). The new capacity at Gulburga
can sell its products in relatively high realizations markets of Karnataka and south
Maharashtra. The existing plants at Devapur and Jalgaon would target to scale
newer markets of Madhya Pradesh and Chhattisgarh.
Exhibit 6: Orient Cement Market Mix
11
24
65
Maharashtra
Andhra Pradesh
Other States
Source: Company, Angel Research
December 22, 2014
3
Orient Cement | Initiating coverage
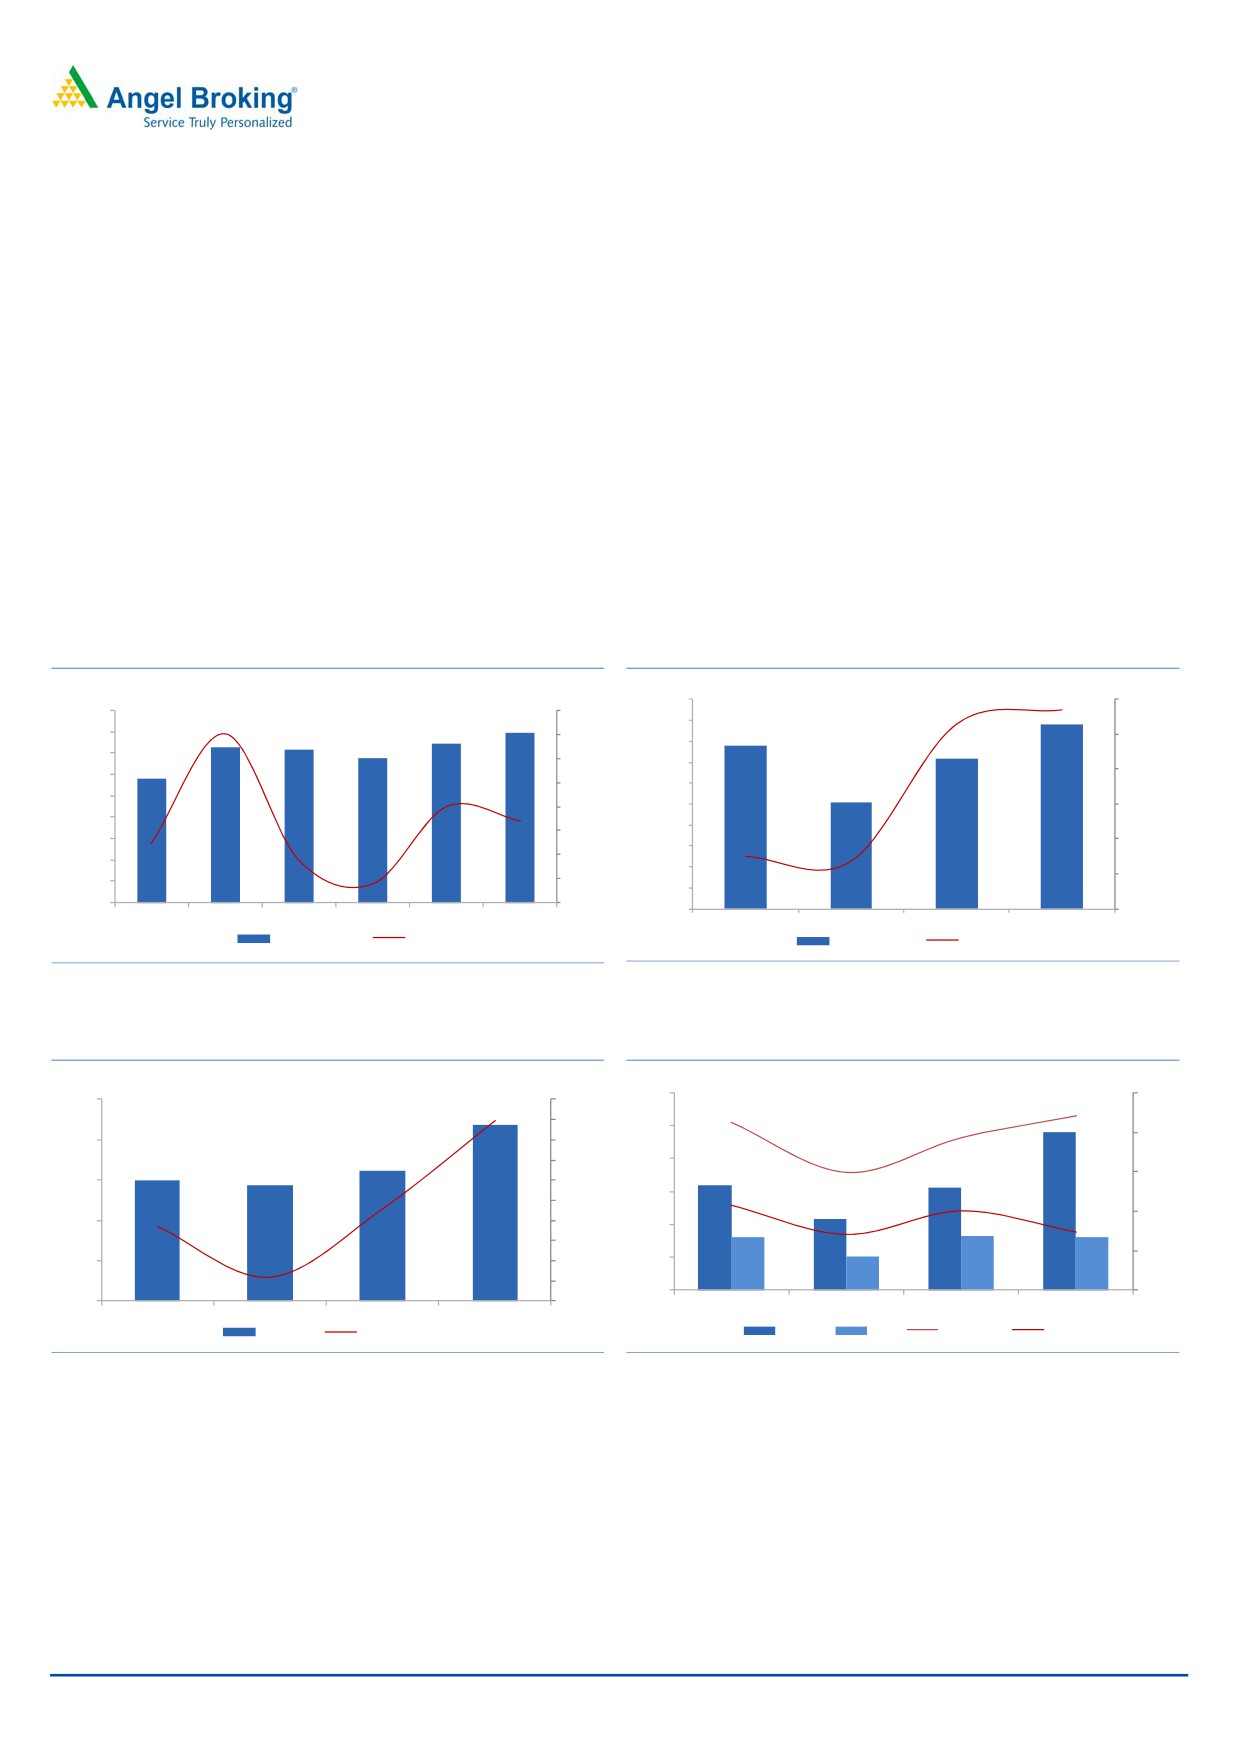
Financial outlook
We expect Orient to report a healthy 23.2% revenue CAGR during FY2014-16E.
This should be on the back of strong volume growth as a new capacity will be
operational in 1QFY2016 and better cement demand outlook will lead to higher
realizations.
In FY2014, the company’s EBITDA declined sharply by 32.6% yoy to `215cr while
its EBITDA margin declined to
14.9% vs 21.2% in FY2013 due to fall in
realizations. Going forward we expect the EBITDA margin to improve due to higher
realizations and owing to the cost efficient structure of the company. The EBITDA
margin is expected to improve from 14.9% in FY2014 to 22% by FY2016E. Overall
we expect EBITDA to grow at a CAGR of 49.7% over FY2014-16E. With better
profitability, we expect Orient’s RoE to improve from current levels of 12.7% to
16% by FY2016E.
Exhibit 7: Expected realizations to grow
Exhibit 8: Expect improvement in EBITDA/tonne
(mn/tn)
(mn/tn)
1000
60.0
4500
30.0
53.9
3638
3972
900
3712
45.7
4000
3594
25.0
40.0
25.2
3375
800
3500
2907
20.0
700
779
879
3000
20.0
15.0
600
2500
10.0
500
719
0.0
2000
511
10.0
400
5.0
1500
7.0
(20.0)
2.3
300
0.0
(29.8)
1000
(32.6)
(1.2)
200
(5.0)
(40.0)
500
(6.1)
100
0
(10.0)
0
(60.0)
FY11
FY12
FY13
FY14
FY15E
FY16E
FY13
FY14
FY15E
FY16E
Net Realization
yoy%
EBITDA/tonne
% chg
Source: Company, Angel Research
Source: Company, Angel Research
Exhibit 9: Revenue Growth Trend
Exhibit 10: Profitability Trend
(` cr)
(` cr)
600
25.0
2500
40.0
34.7
35.0
22.0
500
21.2
19.3
20.0
2000
30.0
25.0
400
14.9
2185
15.0
1500
1622
20.0
300
1502
1438
15.0
10.8
12.8
10.0
10.0
1000
10.0
7.0
200
7.3
5.0
313
319
481
5.0
100
162
215
163
160
500
8.4
0.0
101
(4.2)
(5.0)
0
0.0
0
(10.0)
FY13
FY14
FY15E
FY16E
FY13
FY14
FY15E
FY16E
Net Sales
% chg
EBITDA
PAT
EBITDA %
PAT%
Source: Company, Angel Research
Source: Company, Angel Research
December 22, 2014
4
Orient Cement | Initiating coverage
Outlook and Valuation
Orient’s capacity addition would drive volume growth. Further, a possible uptick in
realizations and better cost efficiency will improve profitability, going forward.
At CMP of `148, the stock is trading at FY2016E EV/ton of $86 (on its 8mtpa
expanded capacity), which is at a huge discount to its south based peers (Ramco
Cement trades at $120/tonne). The stock is trading at 8.8x and 8.9x of its
FY2015E and FY2016E EV/EBITDA, respectively. We initiate coverage on Orient
Cement with a Buy recommendation and a target price of `183 based on 10.6x
FY2016E EV/EBIDTA and at EV/tonne at $95.
December 22, 2014
5
Orient Cement | Initiating coverage
Company Background
Orient Cement Ltd (Orient) a CK Birla group company was incorporated in 1979.
Orient has 5mtpa cement grinding capacity plant located at Devapur, Telengana
(3mtpa capacity) and Jalgaon, Maharashtra (2mtpa capacity) along with 50MW
captive power capacity. Orient is setting up greenfield plant with proposed
capacity of 3mtpa at Gulbarga, Karnataka which would take the total cement
capacity to 8mtpa. Orient offers its product under Birla-A1 under PPC category
and Orient Gold 53-grade under OPC category. Currently, Orient sells its
products through a network of 2760 dealers spread across west, central and south
India.
December 22, 2014
6
Orient Cement | Initiating coverage
Profit & Loss Statement
Y/E March (` cr)
FY13
FY14
FY15E
FY16E
Net Sales
1,502
1,438
1,622
2,185
% Chg
(4.2)
12.8
34.7
Total expenditure
1,183
1,224
1,309
1,703
Net Consumption of Materials
226
259
266
346
Power and Fuel
379
389
408
504
Employee benefit expenses
52
58
66
88
Transport, clearing & for. charges
310
313
350
470
EBITDA
319
215
313
481
% Chg
(32.6)
45.7
53.9
EBIDTA %
21.2
14.9
19.3
22.0
Depreciation
56
56
58
128
EBIT
263
158
255
354
% Chg
0.0
(39.7)
60.8
38.9
Interest and Financial Charges
19
14
17
121
Other Income
5
9
9
9
PBT
249
153
247
242
Tax
87
52
84
82
% of PBT
35.0
34.1
34.0
34.0
PAT before Exceptional item
162
101
163
160
Exceptional item
0
0
0
0
PAT
162
101
163
160
% Chg
(37.5)
61.2
(1.7)
PAT %
10.8
7.0
10.0
7.3
Basic EPS
8
5
8
8
Diluted EPS
8
5
8
8
% Chg
0.0
(37.5)
61.2
(1.7)
December 22, 2014
7
Orient Cement | Initiating coverage
Balance Sheet
Y/E March (` cr)
FY13
FY14
FY15E
FY16E
Sources of Funds
Equity Capital
20
20
20
20
Reserves Total
736
808
923
1,037
Networth
757
829
944
1,057
Total Debt
46
328
1,328
1,378
Other long term liabilities
29
46
46
46
Deferred Tax Liability
129
127
127
127
Total Liabilities
962
1,329
2,445
2,608
Application of Funds
Gross Block
1,277
1,293
1,293
3,043
Accumulated Depreciation
423
468
526
654
Net Block
854
826
767
2390
Capital WIP
40
328
1528
28
Investments
0
0
0
0
Current Assets
Inventories
87
71
69
81
Sundry Debtors
76
65
73
98
Cash and Bank Balance
76
82
75
113
Loans, Advances and Deposits
106
160
294
314
Other Current Asset
19
25
37
39
Current Liabilities
297
232
423
481
Net Current Assets
68
170
125
164
Miscellaneous Expenditure
0
0
0
0
Total Assets
962
1,329
2,445
2,608
December 22, 2014
8
Orient Cement | Initiating coverage
Cash Flow Statement
Y/E March (` cr)
FY13
FY14
FY15E
FY16E
Profit before tax
249
153
247
242
Depreciation
56
56
58
128
Change in Working Capital
20
(97)
38
(1)
Less: Other income
5
9
9
9
Direct taxes paid
87
52
84
82
Cash Flow from Operations
233
51
250
278
(Inc)/ Dec in Fixed Assets
(44)
(305)
(1,200)
(250)
(Inc)/ Dec in Investments
0
(0)
0
0
Other income
5
9
9
9
Cash Flow from Investing
(39)
(295)
(1,191)
(241)
Issue/(Buy Back) of Equity
0
0
0
0
Inc./(Dec.) in loans
(117)
281
1000
50
Dividend Paid (Incl. Tax)
48
36
48
47
Others
(11)
(4)
19
2
Cash Flow from Financing
(154)
250
934
2
Inc./(Dec.) in Cash
39
5
(7)
38
Opening Cash balances
37
76
82
75
Closing Cash balances
76
82
75
113
December 22, 2014
9
Orient Cement | Initiating coverage
Key Ratios
Y/E March
FY13
FY14
FY15E
FY16E
Valuation Ratio (x)
P/E (on FDEPS)
18.8
30.0
18.6
19.0
P/CEPS
13.9
19.3
13.7
10.5
Dividend yield (%)
1.4
1.0
1.3
1.3
EV/Sales
2.0
2.1
1.7
2.0
EV/EBITDA
9.3
13.7
8.8
8.9
EV / Total Assets
3.1
2.2
1.1
1.6
Per Share Data (`)
EPS (Basic)
7.9
4.9
7.9
7.8
EPS (fully diluted)
7.9
4.9
7.9
7.8
Cash EPS
10.6
7.7
10.8
14.0
DPS
2.0
1.5
2.0
2.0
Operating ROE
-
11.2
17.1
14.1
Returns (%)
RoCE (Pre-tax)
-
13.8
13.5
14.0
Angel RoIC (Pre-tax)
-
17.9
28.9
21.4
RoE
-
12.7
18.4
16.0
Turnover ratios (x)
Asset Turnover (Gross Block) (x)
-
1.1
1.3
1.0
Inventory / Sales (days)
-
20
16
13
Receivables (days)
-
18
15
14
Payables (days)
-
79
91
97
December 22, 2014
10
Orient Cement | Initiating coverage
Research Team Tel: 022 - 39357800
DISCLAIMER
This document is solely for the personal information of the recipient, and must not be singularly used as the basis of any investment
decision. Nothing in this document should be construed as investment or financial advice. Each recipient of this document should
make such investigations as they deem necessary to arrive at an independent evaluation of an investment in the securities of the
companies referred to in this document (including the merits and risks involved), and should consult their own advisors to determine
the merits and risks of such an investment.
Angel Broking Pvt. Limited, its affiliates, directors, its proprietary trading and investment businesses may, from time to time, make
investment decisions that are inconsistent with or contradictory to the recommendations expressed herein. The views contained in this
document are those of the analyst, and the company may or may not subscribe to all the views expressed within.
Reports based on technical and derivative analysis center on studying charts of a stock's price movement, outstanding positions and
trading volume, as opposed to focusing on a company's fundamentals and, as such, may not match with a report on a company's
fundamentals.
The information in this document has been printed on the basis of publicly available information, internal data and other reliable
sources believed to be true, but we do not represent that it is accurate or complete and it should not be relied on as such, as this
document is for general guidance only. Angel Broking Pvt. Limited or any of its affiliates/ group companies shall not be in any way
responsible for any loss or damage that may arise to any person from any inadvertent error in the information contained in this report.
Angel Broking Pvt. Limited has not independently verified all the information contained within this document. Accordingly, we cannot
testify, nor make any representation or warranty, express or implied, to the accuracy, contents or data contained within this document.
While Angel Broking Pvt. Limited endeavours to update on a reasonable basis the information discussed in this material, there may be
regulatory, compliance, or other reasons that prevent us from doing so.
This document is being supplied to you solely for your information, and its contents, information or data may not be reproduced,
redistributed or passed on, directly or indirectly.
Angel Broking Pvt. Limited and its affiliates may seek to provide or have engaged in providing corporate finance, investment banking
or other advisory services in a merger or specific transaction to the companies referred to in this report, as on the date of this report or
in the past.
Neither Angel Broking Pvt. Limited, nor its directors, employees or affiliates shall be liable for any loss or damage that may arise from
or in connection with the use of this information.
Note: Please refer to the important `Stock Holding Disclosure' report on the Angel website (Research Section). Also, please refer to the
latest update on respective stocks for the disclosure status in respect of those stocks. Angel Broking Pvt. Limited and its affiliates may
have investment positions in the stocks recommended in this report.
Disclosure of Interest Statement
Orient Cement
1. Analyst ownership of the stock
No
2. Angel and its Group companies ownership of the stock
No
3. Angel and its Group companies' Directors ownership of the stock
No
4. Broking relationship with company covered
No
Note: We have not considered any Exposure below ` 1 lakh for Angel, its Group companies and Directors
Ratings (Returns):
Buy (> 15%)
Accumulate (5% to 15%)
Neutral (-5 to 5%)
Reduce (-5% to -15%)
Sell (< -15%)
December 22, 2014
11
Orient Cement | Initiating coverage
6th Floor, Ackruti Star, Central Road, MIDC, Andheri (E), Mumbai- 400 093. Tel: (022) 39357800
Research Team
Fundamental:
Sarabjit Kour Nangra
VP-Research, Pharmaceutical
Vaibhav Agrawal
VP-Research (Banking)
Amarjeet Maurya
Analyst (FMCG, Media, Mid-Cap)
Bharat Gianani
Analyst (Automobile)
Shrenik Gujrathi
Analyst (Cap Goods, Cement)
Umesh Matkar
Analyst (Banking)
Twinkle Gosar
Analyst (Mid-Cap)
Tejas Vahalia
Research Editor
Technicals and Derivatives:
Siddarth Bhamre
Head - Technical & Derivatives
Sameet Chavan
Technical Analyst
Sneha Seth
Associate (Derivatives)
Institutional Sales Team:
Mayuresh Joshi
VP - Institutional Sales
Meenakshi Chavan
Dealer
Gaurang Tisani
Assistant Manager
Production Team:
Dilip Patel
Production Incharge
CSO & Registered Office: G-1, Ackruti Trade Centre, Road No. 7, MIDC, Andheri (E), Mumbai - 93. Tel: (022) 3083 7700. Angel Broking Pvt. Ltd: BSE Cash: INB010996539 / BSE F&O: INF010996539, CDSL Regn. No.: IN - DP - CDSL - 234 - 2004, PMS Regn. Code: PM/INP000001546, NSE Cash: INB231279838 /
NSE F&O: INF231279838 / NSE Currency: INE231279838, MCX Stock Exchange Ltd: INE261279838 / Member ID: 10500. Angel Commodities Broking (P) Ltd.: MCX Member ID: 12685 / FMC Regn. No.: MCX / TCM / CORP / 0037 NCDEX: Member ID 00220 / FMC Regn. No.: NCDEX / TCM / CORP / 0302.
December 22, 2014
12