FPO Note | Oil & Gas
January 31, 2013
OIL INDIA
SUBSCRIBE
Issue Open: February 01, 2013
Attractively priced
Issue Close: February 01, 2013
Oil India is a government-owned company that explores, develops and produces
Issue Details
oil and gas. It is India’s second-largest E&P company in terms of production and
Face Value: `10
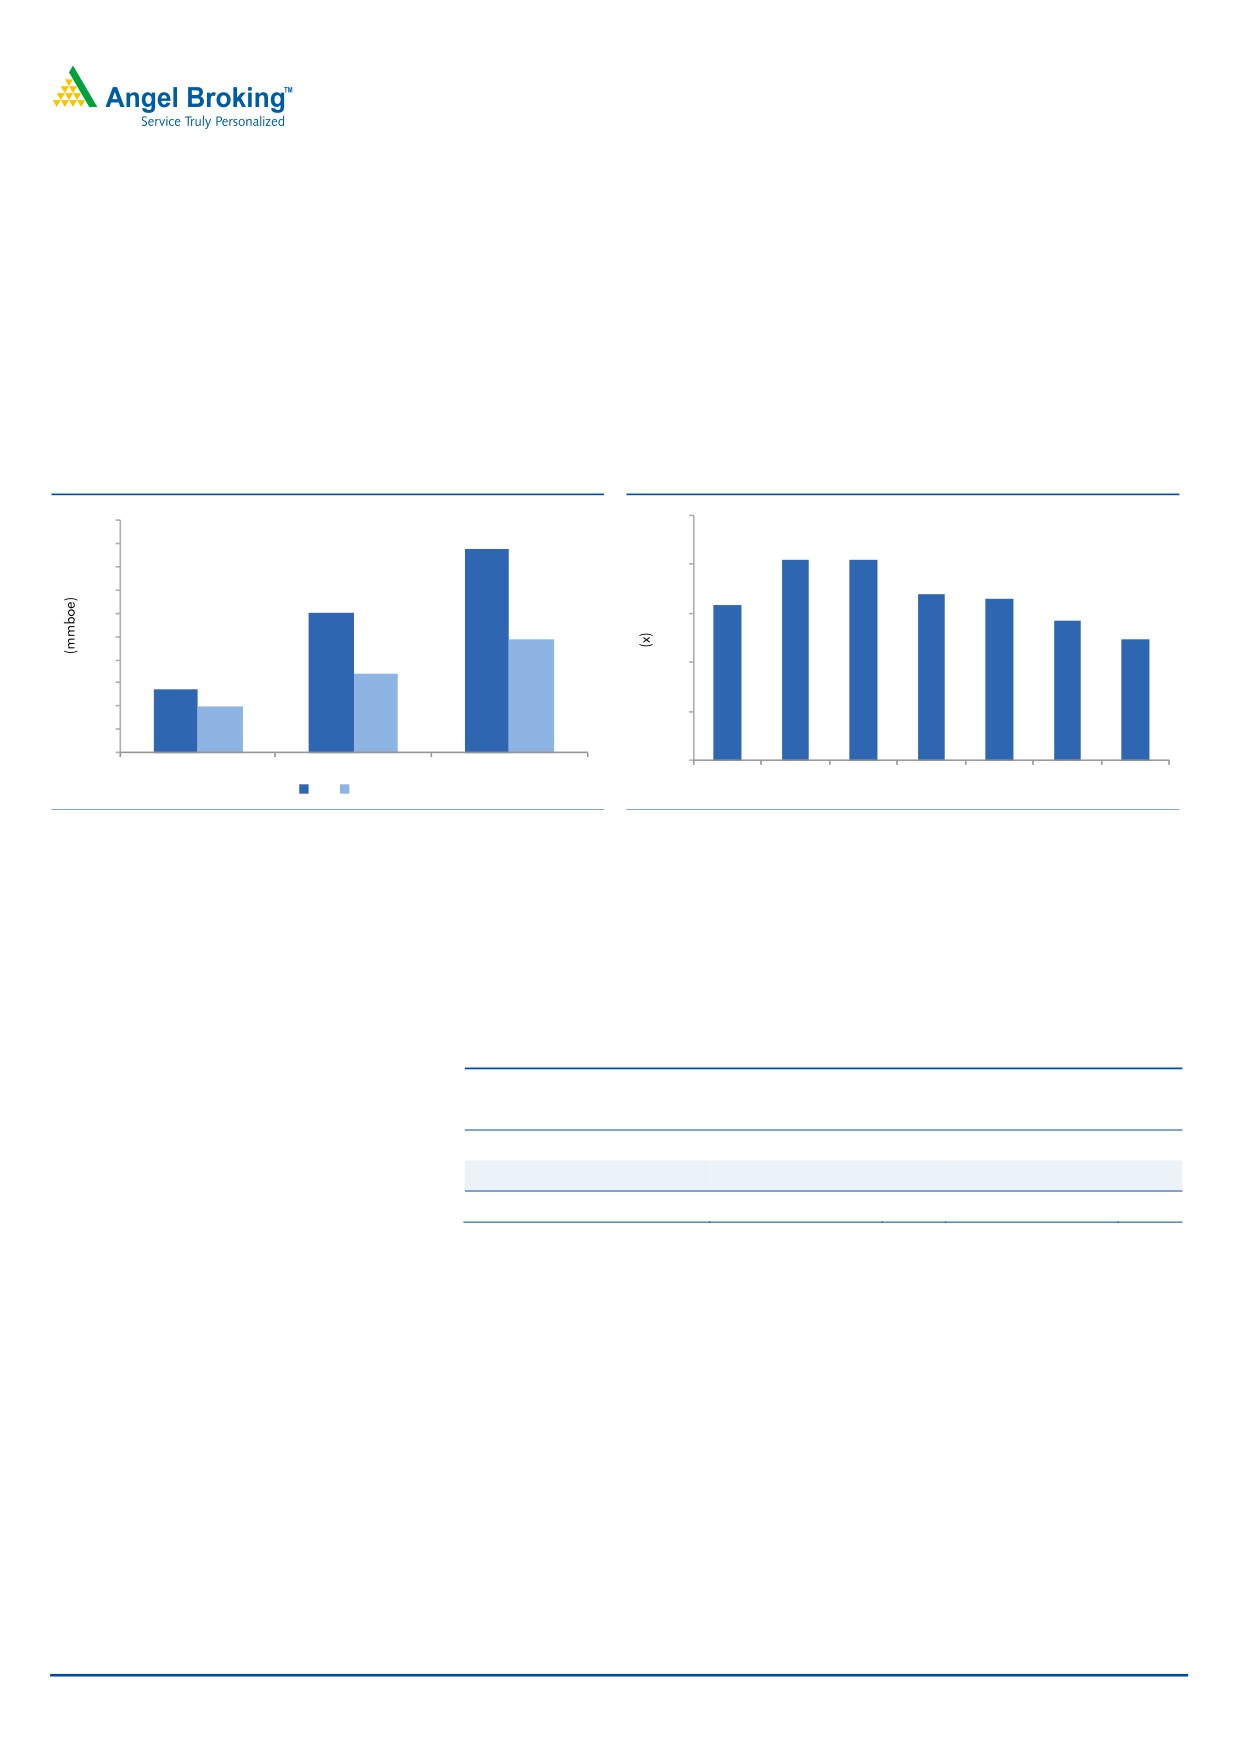
reserves. Currently, Oil India has 2P reserves of 941mnboe, indicating a reserve
life of 22 years.
Present Eq. Paid-up Capital: `240cr
Offer Size: 6.01cr Shares
One of the lowest cost producers: During FY2012, Oil India’s cost of oil
production stood at US$8.3/bbl, which is one of the lowest in our view. Its cost of
Post Eq. Paid-up Capital: `240cr
natural gas production stood at US$1.4/mmbtu. Due to lower cost of production,
Issue size (amount):* `3,065cr
Oil India enjoys robust operating margins (~30%) despite lower net realizations,
Floor Price: `510
on the back of subsidy sharing with Oil Marketing Companies (OMCs).
Post-issue implied mkt cap: `32,413cr
Rise in fuel prices could pave way for re-rating: Upstream oil PSU companies
Promoters holding Pre-Issue: 78.4%
have been sharing under-recoveries by the downstream companies who sell
Promoters holding Post-Issue: 68.4%
diesel, kerosene and LPG cylinders at subsidized rates. As there is no concrete
formula or methodology to determine the annual subsidy of any of these
companies, investors have remained concerned over the lack of visibility on
profitability of downstream and upstream companies. During FY2012, subsidy
Post Issue Shareholding Pattern
shared by Oil India rose by 123.3% yoy to `7,352cr. However, given the rising
Promoters Group
68.4
under-recoveries, government has hinted at diesel price de-regulation (diesel
MF/Banks/Indian
contributes 60% to total under-recoveries). Hence, going forward, diesel price de-
FIs/FIIs/Public &
regulation is likely to result in lower subsidy burden on upstream companies
Others
31.6
including Oil India and thus higher realizations. Oil India’s Management also
expects the subsidy amount to decline significantly during FY2014.
Strong balance sheet paves way for acquisition of energy assets: As on
September 30, 2012, Oil India had net cash of `252/share on the balance sheet.
Considering the operating cash flow and the company’s capex requirements over
the coming few years, we believe the company will maintain high cash balance,
which could pave way for acquisition of oil and gas assets. The company aims to
acquire shale gas assets in the US.
Outlook and valuation: Historically, Oil India stock has traded at a lower EV/1P
Reserves compared to its global peers on account of lower realizations on crude
oil (subsidy sharing with downstream companies’ results in lower net realizations).
However, we believe that the government’s initiatives to raise (de-regulate) the
price of diesel gradually should lead to lower subsidy sharing by upstream
companies from FY2014 and hence, result in higher realizations. Consequently,
we expect Oil India’s valuation gap to narrow gradually with global peers. We
derive a SOTP-based target price of `600 and recommend investors with
Bhavesh Chauhan
long-term horizon to Subscribe to the shares of Oil India.
Tel: 022- 39357600 Ext: 6821
Vinay Rachh
Tel: 022- 39357600 Ext: 6841
Please refer to important disclosures at the end of this report
1
Oil India | FPO Note
Company background
Oil India is a Navratna company that is into exploration, development and
production of oil and gas. It is India’s second-largest E&P company in terms of
production and reserves. Approximately 95% of Oil India’s production comes from
its Upper Assam basin. The company holds several NELP blocks as an operator
and some with joint ventures. Currently, Oil India has 2P reserves of 941mnboe,
indicating a reserve life of 22 years.
Exhibit 1: Reserves break-up
Exhibit 2: Reserve Replacement ratio
2.5
1000
878
900
2.0
2.0
800
2.0
1.7
1.7
700
1.6
600
1.4
600
1.5
486
1.2
500
400
341
1.0
274
300
199
200
0.5
100
0
0.0
1P
2P
3P
FY2006
FY2007
FY2008
FY2009
FY2010
FY2011
FY2012
Oil Gas
Source: Company, Angel Research
Source: Company, Angel Research
Issue details
The issue comprises an offer for sale of 6.01cr equity shares of face value `10
each. There is no fresh issue of equity. Oil India has fixed the floor price of the
issue at `510 per share.
Exhibit 3: Shareholding Pattern
Pre-Issue
Post-Issue
Particulars
No. of shares
(%)
No. of shares
(%)
Promoter and promoter group
47,14,98,900
78.4
41,11,76,993
68.4
Total public holding
12,96,37,055
21.6
18,99,58,962
31.6
Total
60,11,35,955
100
60,11,35,955
100
Source: Source: RHP, Angel Research
January 31, 2013
2
Oil India | FPO Note
Investment arguments
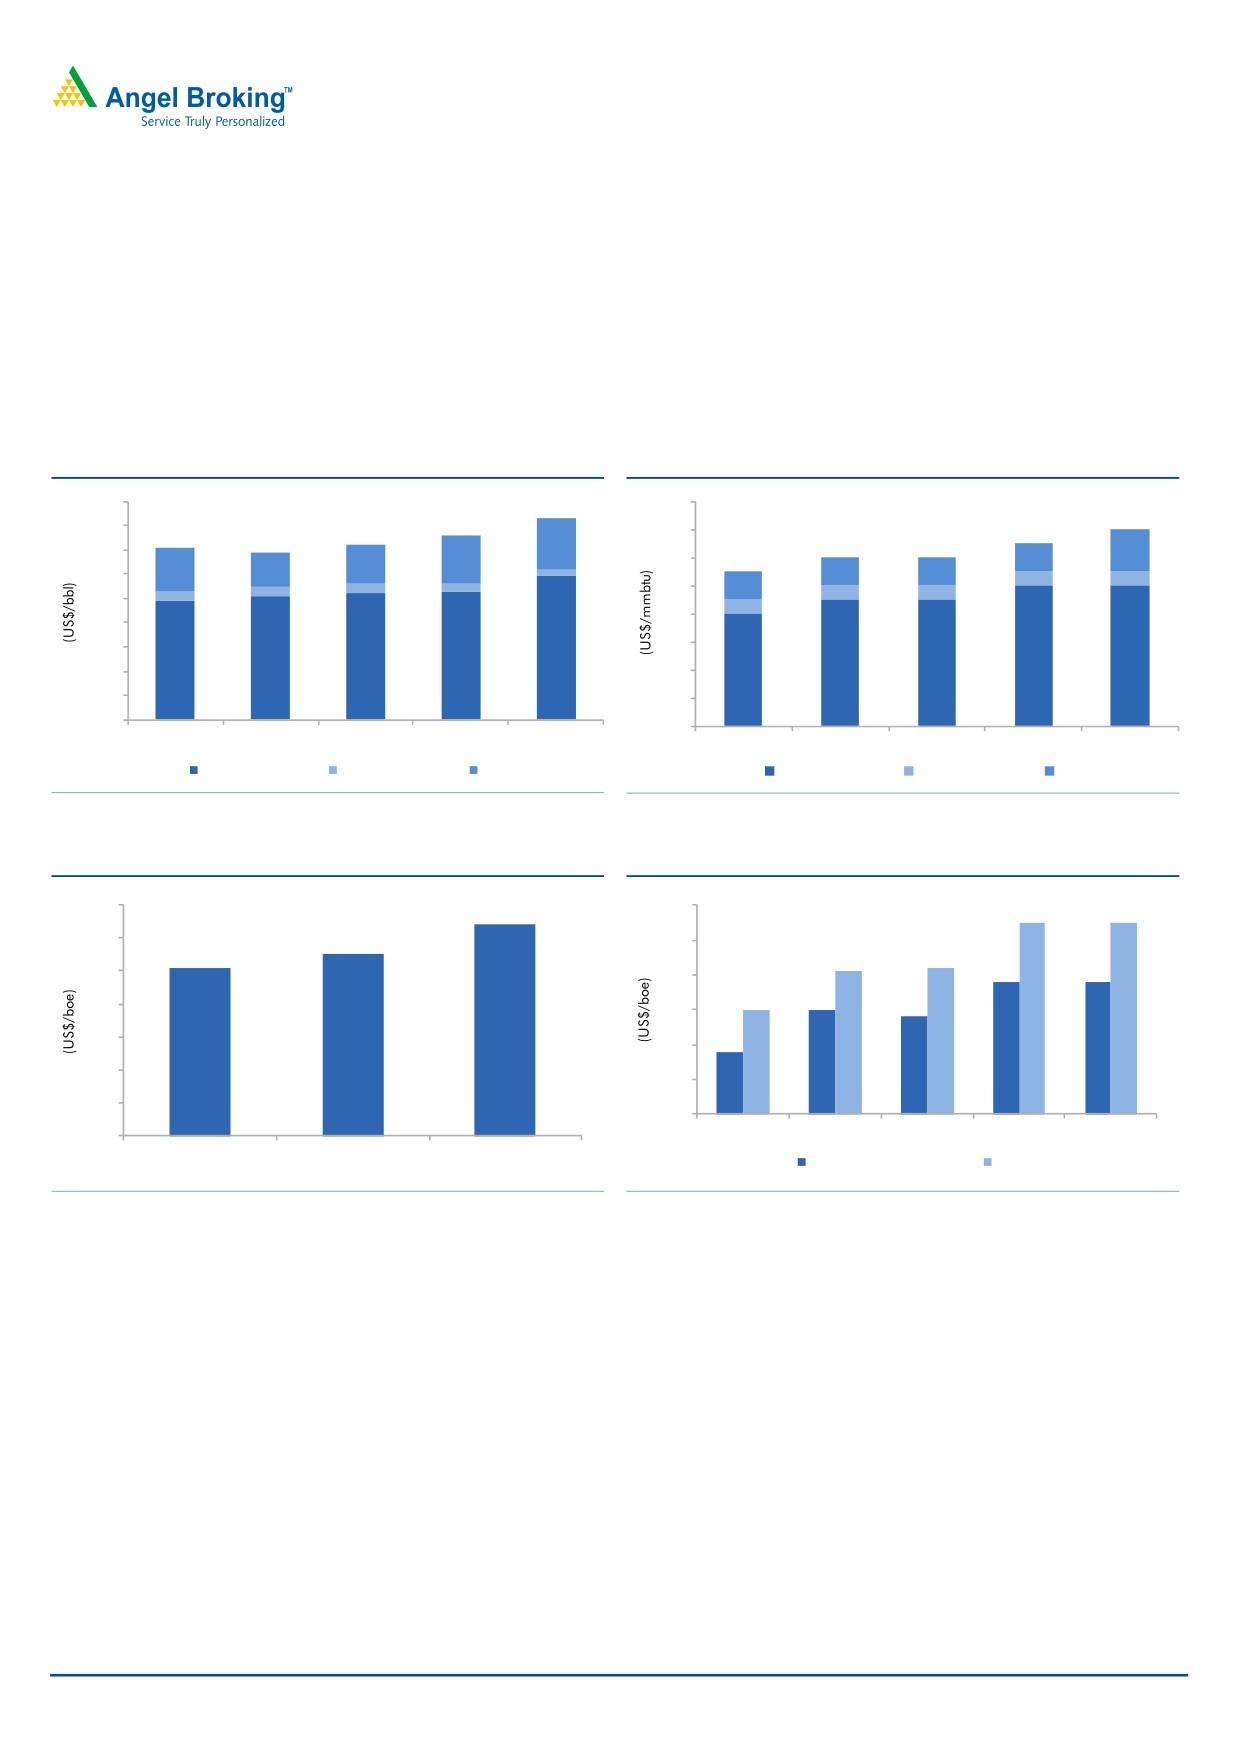
One of the lowest cost producers
During FY2012, Oil India’s cost of oil production stood at US$8.3/bbl, which is
one of the lowest in our view. Its cost of natural gas production stood at
US$1.4/mmbtu. Due to lower cost of production, Oil India enjoys robust operating
margins (~30%) despite lower net realizations, on the back of subsidy sharing with
Oil Marketing Companies (OMCs).
Exhibit 4: Crude oil production cost trend
Exhibit 5: Natural gas production cost trend
9.0
1.6
8.0
1.4
7.0
1.2
6.0
1.0
5.0
0.8
4.0
0.6
3.0
2.0
0.4
1.0
0.2
0.0
0.0
FY2008
FY2009
FY2010
FY2011
FY2012
FY2008
FY2009
FY2010
FY2011
FY2012
Raising Cost
Depreciation
Depletion
Raising Cost
Depreciation
Depletion
Source: Company, Angel Research
Source: Company, Angel Research
Exhibit 6: Lowest cost operator (FY2012)
Exhibit 7: Finding and development costs trend
7.0
6.4
6.0
5.5
5.5
6.0
5.5
5.0
5.1
4.1
4.2
3.8
3.8
5.0
4.0
3.0
3.0
4.0
2.8
3.0
3.0
1.8
2.0
2.0
1.0
1.0
0.0
0.0
FY2008
FY2009
FY2010
FY2011
FY2012
Lifting/Prod'n Costs
Finding & Dev. costs
Opex
Finding Costs
F&D Costs
Source: Company, Angel Research
Source: Company, Angel Research
Rise in fuel prices could pave way for re-rating
Upstream oil PSU companies have been sharing under-recoveries by the
downstream companies who sell diesel, kerosene and LPG cylinders at subsidized
rates. As there is no concrete formula or methodology to determine the annual
subsidy of any of these companies, investors have remained concerned over the
lack of visibility on profitability of downstream and upstream companies. During
FY2012, subsidy shared by Oil India rose by 123.3% yoy to `7,352cr. However,
given the rising under-recoveries, government has hinted at diesel price
de-regulation (diesel contributes 60% to total under-recoveries). Hence, going
forward, diesel price de-regulation is likely to result in lower subsidy burden on
upstream companies including Oil India and thus higher realizations. Oil India’s
Management also expects the subsidy amount to decline significantly
during FY2014.
January 31, 2013
3
Oil India | FPO Note
Exhibit 8: Subsidy sharing by upstream companies (` cr)
FY2008
FY2009
FY2010
FY2011
FY2012
ONGC
22,001
28,226
11,550
24,786
44,500
Oil India
2,305
3,023
1,549
3,293
7,352
GAIL
1,314
1,781
1,327
2,111
3,183
Source: Company, Angel Research
Strong balance sheet paves way for acquisition of energy assets
As on September 30, 2012, Oil India had net cash of `252/share on the balance
sheet. Considering the operating cash flow and the company’s capex requirements
over the coming few years, we believe the company will maintain high cash
balance, which could pave way for acquisition of oil and gas assets. The company
aims to acquire shale gas assets in the US.
Oil India vs ONGC
ONGC is the largest explorer and crude oil producer in India with reserves which
are more than 10x Oil India’s reserves. ONGC shares subsidy-burden similar to
Oil India. Hence, we compare Oil India vis-à-vis ONGC on several parameters.
We find that Oil India scores over ONGC on most of these parameters. Even on
valuations front, Oil India is currently trading at 3.5x EV/2P Reserves compared to
ONGC which is trading at 4.7x.
January 31, 2013
4
Oil India | FPO Note
Exhibit 9: ONGC vs Oil India - Reserve Life (Stand.)
Exhibit 10: ONGC vs Oil India - Realizations (Stand.)
70
35
31
58.1
59
60
56
56
56
55
30
27
60
52.9
53.8
49
25
22
21
50
40
20
16
15
30
10
10
20
5
10
0
0
1P
2P
3P
FY2008
FY2009
FY2010
FY2011
FY2012
OIL
ONGC
OIL INDIA ONGC
Source: Company, Angel Research
Source: Company, Angel Research
Exhibit 11: ONGC vs Oil India - Oil production (mmt)
Exhibit 12: ONGC vs Oil India - Gas production (bcm)
28.2
2.7
35.0
4.5
2.6
4.0
28.0
34.5
2.6
3.5
27.8
2.5
34.0
3.0
27.6
2.5
2.5
27.4
2.4
33.5
2.0
2.4
27.2
33.0
1.5
2.3
27.0
1.0
2.3
32.5
26.8
0.5
2.2
32.0
0.0
26.6
2.2
FY2008
FY2009
FY2010
FY2011
FY2012
FY2008
FY2009
FY2010
FY2011
FY2012
ONGC
Oil India -(RHS)
ONGC
Oil India -(RHS)
Source: Company, Angel Research
Source: Company, Angel Research
Exhibit 13: ONGC vs Oil India - ROE
Exhibit 14: ONGC vs Oil India EV/2P reserves valuation
30
5.0
25
4.7
23
23
23
4.8
25
21
21
20
20
4.6
20
4.4
15
4.2
4.0
10
3.8
5
3.5
3.6
0
3.4
FY2009
FY2010
FY2011
FY2012
3.2
3.0
ONGC
OIL
ONGC
Oil India
Source: Company, Angel Research
Source: Company, Angel Research
January 31, 2013
5
Oil India | FPO Note
Outlook and valuation
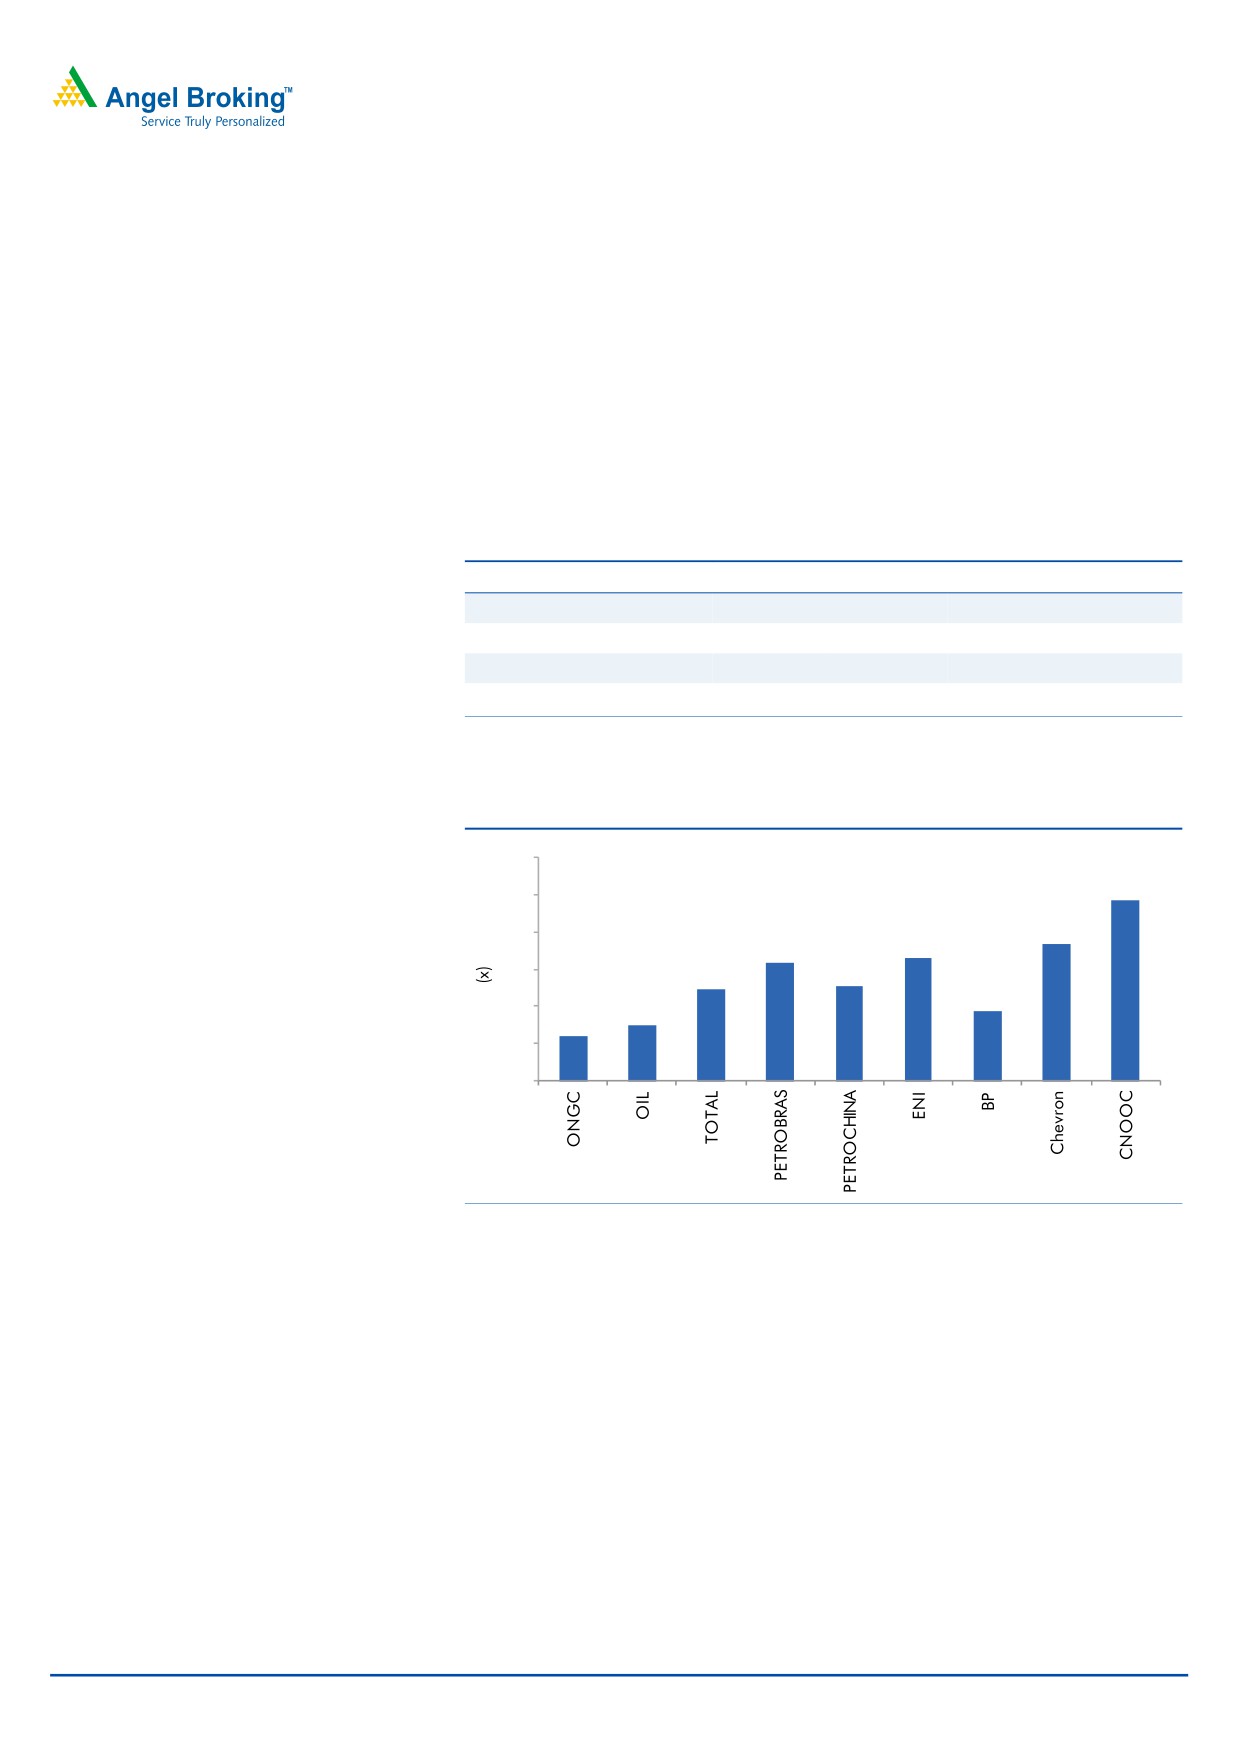
Historically, Oil India stock has traded at a lower EV/1P Reserves compared to its
global peers on account of lower realizations on crude oil (subsidy sharing with
downstream companies’ results in lower net realizations). However, we believe that
the government’s initiatives to raise (de-regulate) the price of diesel gradually
should lead to lower subsidy sharing by upstream companies from FY2014 and
hence, result in higher realizations. Consequently, we expect Oil India’s valuation
gap to narrow gradually with global peers. We derive a SOTP-based target price
of `600 and recommend investors with long-term horizon to Subscribe to the
shares of Oil India.
Exhibit 15: SOTP valuation
mm/bbl
US$/boe
US$ mn
`/share
2P oil reserves
600
5.2
3,120
285
2P gas reserves
341
2.0
682
62
Net cash
252
Target price
600
Source: Company, Angel Research
Exhibit 16: EV/1P Reserves matrix
30
24.3
25
18.3
20
16.5
15.8
15
12.2
12.6
9.4
10
7.4
6.1
5
-
Source: Angel Research, Bloomberg
Key concerns
High dependence on one region
Currently, 95% of Oil India’s production comes from its Upper Assam basin. Any
adverse event or security concerns in this region can potentially affect Oil India’s
operations.
Risk of higher subsidy sharing
Over the past five years, Oil India’s subsidy sharing has remained volatile as there
is no concrete formula for calculating subsidy. Although we anticipate government
to gradually de-regulate diesel prices, the risk of higher subsidy sharing by Oil
India remains in the near-term.
January 31, 2013
6
Oil India | FPO Note
Profit & Loss Statement (Standalone)
Y/E March (` cr)
FY2009
FY2010
FY2011
FY2012
Net Sales
7,241
9,454
11,614
17,215
% chg
-
30.6
22.8
48.2
Total Expenditure
4,635
6,290
7,346
12,518
EBIDTA
3,564
4,119
5,142
6,142
(%of Net Sales)
49.2
43.6
44.3
35.7
Other Income
957
954
874
1,445
Depreciation & Amortization
168
220
820
1,009
Interest
9
4
13
9
PBT
3,387
3,895
4,309
5,124
(% of Net Sales)
46.8
41.2
37.1
29.8
Extraordinary Expense/(Inc.)
-
-
-
-
Tax
1,225
1,285
1,425
1,655
(% of PBT)
36.2
33.0
33.1
32.3
PAT
2,162
2,610
2,884
3,469
% chg
-
20.8
10.5
20.3
Ad. PAT
2,162
2,610
2,884
3,469
% chg
-
20.8
10.5
20.3
Balance Sheet (Standalone)
Y/E March (` cr)
FY2009
FY2010
FY2011
FY2012
SOURCES OF FUNDS
Equity Share Capital
214
240
240
240
Reserves & Surplus
9,118
13,525
15,357
17,499
Shareholders’ Funds
9,332
13,766
15,598
17,740
Share warrants
-
-
-
-
Minority Interest
-
-
-
-
Total Loans
56
38
1,027
19
Other Liabilities
-
-
325
404
Deferred Tax Liability (net)
900
1,021
1,149
1,077
Total Liabilities
10,289
14,824
18,099
19,239
APPLICATION OF FUNDS
Gross Block
2,972
3,211
3,320
3,534
Less: Acc. Depreciation
1,838
2,136
2,331
2,476
Net Block
1,134
1,075
990
1,058
Capital Work-in-Progress
3,402
3,871
4,477
4,567
Goodwill
-
-
-
-
Investments
489
859
885
2,632
Current Assets
8,413
12,307
14,553
14,166
Current liabilities
3,149
3,306
3,184
3,509
Net Current Assets
5,264
9,000
11,369
10,657
Other assets
-
-
379
325
Misc Expenditure
-
18
-
-
Total Assets
10,289
14,824
18,099
19,239
January 31, 2013
7
Oil India | FPO Note
Cash Flow Statement (Standalone)
Y/E March (` cr)
FY2009
FY2010
FY2011
FY2012
Profit before tax
3,387
3,895
4,313
5,102
Depreciation
173
222
178
151
(Inc)/Dec in Working Capital
386
(500)
402
313
Direct taxes paid
(517)
(1,248)
(1,382)
(1,897)
Others
(259)
(405)
(458)
(571)
Cash Flow from Operations
3,170
1,964
3,052
3,097
(Inc.)/Dec. in Fixed Assets
-
-
(952)
(860)
Free Cash Flow
3,170
1,964
2,100
2,237
(Inc)/Dec in Investments
-
(371)
(31)
(1,724)
Others
(124)
210
(120)
1,504
Issue of Equity
-
2,777
-
-
Inc./(Dec.) in loans
(118)
(16)
989
(1,004)
Dividend Paid (Incl.Tax)
(642)
(765)
(818)
(1,310)
Cash Flow from Financing
(884)
1,836
21
(2,534)
Inc./(Dec.) in Cash
1,789
2,473
3,225
(832)
Opening Cash balances
4,281
6,070
8,543
11,767
Closing Cash balances
6,070
8,543
11,767
10,935
Key Ratios
Y/E March
FY2009
FY2010
FY2011
FY2012
Per Share Data (`)
EPS (diluted)
50.5
54.3
60.0
72.1
Book Value
218.0
286.2
324.3
368.9
Ratios
EBITDA margin (%)
49.2
43.6
44.3
35.7
Adj. Net margin (%)
29.9
27.6
24.8
20.2
Net Debt/Equity (x)
(0.6)
(0.6)
(0.7)
(0.6)
Returns (%)
RoE
230
23.0
20.0
21.0
RoCE
36.2
33.7
28.1
29.2
RoIC
52.4
61.5
69.5
70.7
Valuation Ratio (x)
P/E
10.0
10.1
9.2
7.0
P/BV
2.4
1.8
1.6
1.4
EV/Sales
2.2
1.7
1.2
0.7
EV/EBITDA
4.4
3.8
2.6
1.9
January 31, 2013
8
Oil India | FPO Note
Research Team Tel: 022 - 39357800
DISCLAIMER
This document is solely for the personal information of the recipient, and must not be singularly used as the basis of any investment
decision. Nothing in this document should be construed as investment or financial advice. Each recipient of this document should make
such investigations as they deem necessary to arrive at an independent evaluation of an investment in the securities of the companies
referred to in this document (including the merits and risks involved), and should consult their own advisors to determine the merits and
risks of such an investment.
Angel Broking Limited, its affiliates, directors, its proprietary trading and investment businesses may, from time to time, make
investment decisions that are inconsistent with or contradictory to the recommendations expressed herein. The views contained in this
document are those of the analyst, and the company may or may not subscribe to all the views expressed within.
Reports based on technical and derivative analysis center on studying charts of a stock's price movement, outstanding positions and
trading volume, as opposed to focusing on a company's fundamentals and, as such, may not match with a report on a company's
fundamentals.
The information in this document has been printed on the basis of publicly available information, internal data and other reliable
sources believed to be true, but we do not represent that it is accurate or complete and it should not be relied on as such, as this
document is for general guidance only. Angel Broking Limited or any of its affiliates/ group companies shall not be in any way
responsible for any loss or damage that may arise to any person from any inadvertent error in the information contained in this report.
Angel Broking Limited has not independently verified all the information contained within this document. Accordingly, we cannot testify,
nor make any representation or warranty, express or implied, to the accuracy, contents or data contained within this document. While
Angel Broking Limited endeavours to update on a reasonable basis the information discussed in this material, there may be regulatory,
compliance, or other reasons that prevent us from doing so.
This document is being supplied to you solely for your information, and its contents, information or data may not be reproduced,
redistributed or passed on, directly or indirectly.
Angel Broking Limited and its affiliates may seek to provide or have engaged in providing corporate finance, investment banking or
other advisory services in a merger or specific transaction to the companies referred to in this report, as on the date of this report or in
the past.
Neither Angel Broking Limited, nor its directors, employees or affiliates shall be liable for any loss or damage that may arise from or in
connection with the use of this information.
Note: Please refer to the important `Stock Holding Disclosure' report on the Angel website (Research Section). Also, please refer to the
latest update on respective stocks for the disclosure status in respect of those stocks. Angel Broking Limited and its affiliates may have
investment positions in the stocks recommended in this report.
January 31, 2013
9
Oil India | FPO Note
6th Floor, Ackruti Star, Central Road, MIDC, Andheri (E), Mumbai- 400 093. Tel: (022) 39357800
Research Team
Fundamental:
Sarabjit Kour Nangra
VP-Research, Pharmaceutical
Vaibhav Agrawal
VP-Research, Banking
Bhavesh Chauhan
Sr. Analyst (Metals & Mining)
Viral Shah
Sr. Analyst (Infrastructure)
Sharan Lillaney
Analyst (Mid-cap)
V Srinivasan
Analyst (Cement, FMCG)
Yaresh Kothari
Analyst (Automobile)
Ankita Somani
Analyst (IT, Telecom)
Sourabh Taparia
Analyst (Banking)
Bhupali Gursale
Economist
Vinay Rachh
Research Associate
Amit Patil
Research Associate
Shareen Batatawala
Research Associate
Twinkle Gosar
Research Associate
Tejashwini Kumari
Research Associate
Technicals:
Shardul Kulkarni
Sr. Technical Analyst
Sameet Chavan
Technical Analyst
Sacchitanand Uttekar
Technical Analyst
Derivatives:
Siddarth Bhamre
Head - Derivatives
Institutional Sales Team:
Mayuresh Joshi
VP - Institutional Sales
Hiten Sampat
Sr. A.V.P- Institution sales
Meenakshi Chavan
Dealer
Gaurang Tisani
Dealer
Akshay Shah
Sr. Executive
Production Team:
Tejas Vahalia
Research Editor
Dilip Patel
Production
Angel Broking Ltd: BSE Sebi Regn No : INB 010996539 / CDSL Regn No: IN - DP - CDSL - 234 - 2004 / PMS Regn Code: PM/INP000001546 Angel Securities Ltd:BSE: INB010994639/INF010994639 NSE: INB230994635/INF230994635 Membership numbers: BSE 028/NSE:09946
Angel Capital & Debt Market Ltd: INB 231279838 / NSE FNO: INF 231279838 / NSE Member code -12798 Angel Commodities Broking (P) Ltd: MCX Member ID: 12685 / FMC Regn No: MCX / TCM / CORP / 0037 NCDEX : Member ID 00220 / FMC Regn No: NCDEX / TCM / CORP / 0302
January 31, 2013
10