Initiating coverage | Plastic Product
February 5, 2015
Nilkamal
BUY
CMP
`440
Initiating Coverage
Target Price
`566
Nilkamal (NILK) is a pioneer in the plastic industry and is among the leading
Investment Period
12 Months
manufacturers of moulded plastic products. It is present in three verticals, viz
Plastics (83% of revenue), Retail (13%) and Mattress (4%). The Plastics division is
Stock Info
made up of Material Handling and Moulded Furniture segments. Material
Sector
Plastic Product
handling accounts for
~58% of the total Plastics division’s business while
Market Cap (` cr)
657
Moulded Furniture accounts for the remaining ~42%. @home is the retail division
Net debt (` cr)
276
of NILK, operating 19 large format stores across 13 cities with an average size of
16,000 sq.ft. per store. The Mattress division is its recent venture (2012) with
Beta
1.2
manufacturing facilities in Hosur, Tamil Nadu and Dankuni West Bengal.
52 Week High / Low
505 / 135
Plastics division to benefit from revival in economy: NILK’s most profitable
Avg. Daily Volume
22,049
division, ie Plastics, saw volume de-growth in both, Material Handling and
Face Value (`)
10
Moulded Furniture segments, due to a subdued macro environment in FY2014.
BSE Sensex
2,883
After a period of sluggish performance, the Indian GDP is projected (by the
Nifty
8,724
International Monetary Fund [IMF]) to improve from 3.8% in FY2014 to 5.6% in
FY2015, 6.4% in FY2016 and 6.5% in FY2017. Additionally, with no major capex
Reuters Code
NKML.BO
plans going ahead and sufficient capacity to service the recovery in demand, we
Bloomberg Code
NILK IN
expect operating leverage to come into play, thereby adding to the bottom-line.
Sliding oil prices to result in lower Net RM cost: The ongoing weakness in crude
oil prices will have a positive impact on NILK’s net raw material cost as polymers
Shareholding Pattern (%)
are a major raw material for the plastic industry. Crude price is likely to remain at
Promoters
63.6
lower levels due to declining demand from China and with OPEC’s reluctance to
MF / Banks / Indian Fls
11.2
cut down oil production. Despite the pressure on margins in the short run owing
FII / NRIs / OCBs
2.3
to inventory loss, in the longer run, we expect the reduced raw material cost to
Indian Public / Others
22.9
improve EBITDA margin from 7.5% in FY2015E to 8.1% in FY2017E
Outlook and Valuation: We expect the company’s Plastics business to post a
CAGR of 11.5% (with an upturn in the economy) over FY2014-2017E, which will
Abs.(%)
3m 1yr
3yr
aid the company to post a revenue CAGR of 9.4%, over the same period, to
Sensex
4.1
43.5
64.7
`2,167cr. The EBITDA margin is expected to stabilize at 7.5% in FY2015E and
improve to 8.1% in FY2017E. The debt for the company is expected to reduce by
NILK
22.1
209.9
120.3
`62cr over FY2014-17E, resulting in lower finance costs. Consequently, the
company would post a net profit CAGR of 17.5% over FY2014-17E to `65cr, as
per our estimates. At the current market price, the stock is trading at FY2017E PE
of 10.1x. We initiate coverage on the stock with a Buy rating and a target price of
`566, based on a target FY2017E PE of 13x.
Financials (Standalone)
Y/E
Sales OPM PAT EPS RoE P/E P/BV EV/BITDA EV/Sales
March
(` cr)
(%)
(` cr)
(`)
(%)
(x)
(x)
(x)
(x)
FY2015E
1,821
7.5
36
23.8
7.4
18.5
1.3
6.7
0.5
Milan Desai
FY2016E
1,979
8.0
49
32.8
9.6
13.4
1.2
5.6
0.4
022-39357600 Ext.: 6846
FY2017E
2,167
8.1
65
43.5
11.5
10.1
1.1
4.7
0.4
Source: Company, Angel Research; Note: CMP as of February 4, 2015
Please refer to important disclosures at the end of this report
1
Initiating coverage | Nilkamal
Investment Arguments
Plastics division to benefit from revival in Economy
The Plastics business, accounting for ~83% of the company’s total revenue, is the
primary business of the company. Owing to a poor macro environment, the
Plastics division had witnessed volume de-growth in FY2014. However, going
forward, both the segments of the division (Material Handling and Moulded
Furniture) will benefit from an expected improvement in the macro conditions in
India.
The Material Handling segment is B2B in nature and is an important part of
industrial activity. NILK is a “One Stop Shop’ for material handling solutions, being
the largest manufacturer of plastic crates and other products like pallets, metal
storage racks, and material handling equipment for various industries. As far as
Moulded Furniture is concerned, NILK is a recognized name in the industry with a
market share of ~39% amongst organized players. The demand for moulded
plastic furniture is expected to improve owing to its cost effective nature vis-à-vis
traditional wooden furniture. Improvement in the population’s lifestyle and
disposable income along with rural penetration in terms of use of plastic furniture
bodes well for NILK.
As per the IMF, the Indian economy has “recovered from its slump” on the back of
effective policies and there is renewed confidence following the elections at the
center. It has forecasted at India’s GDP expanding by 5.6% in FY2015, 6.4% in
FY2016 and 6.5% in FY2017.
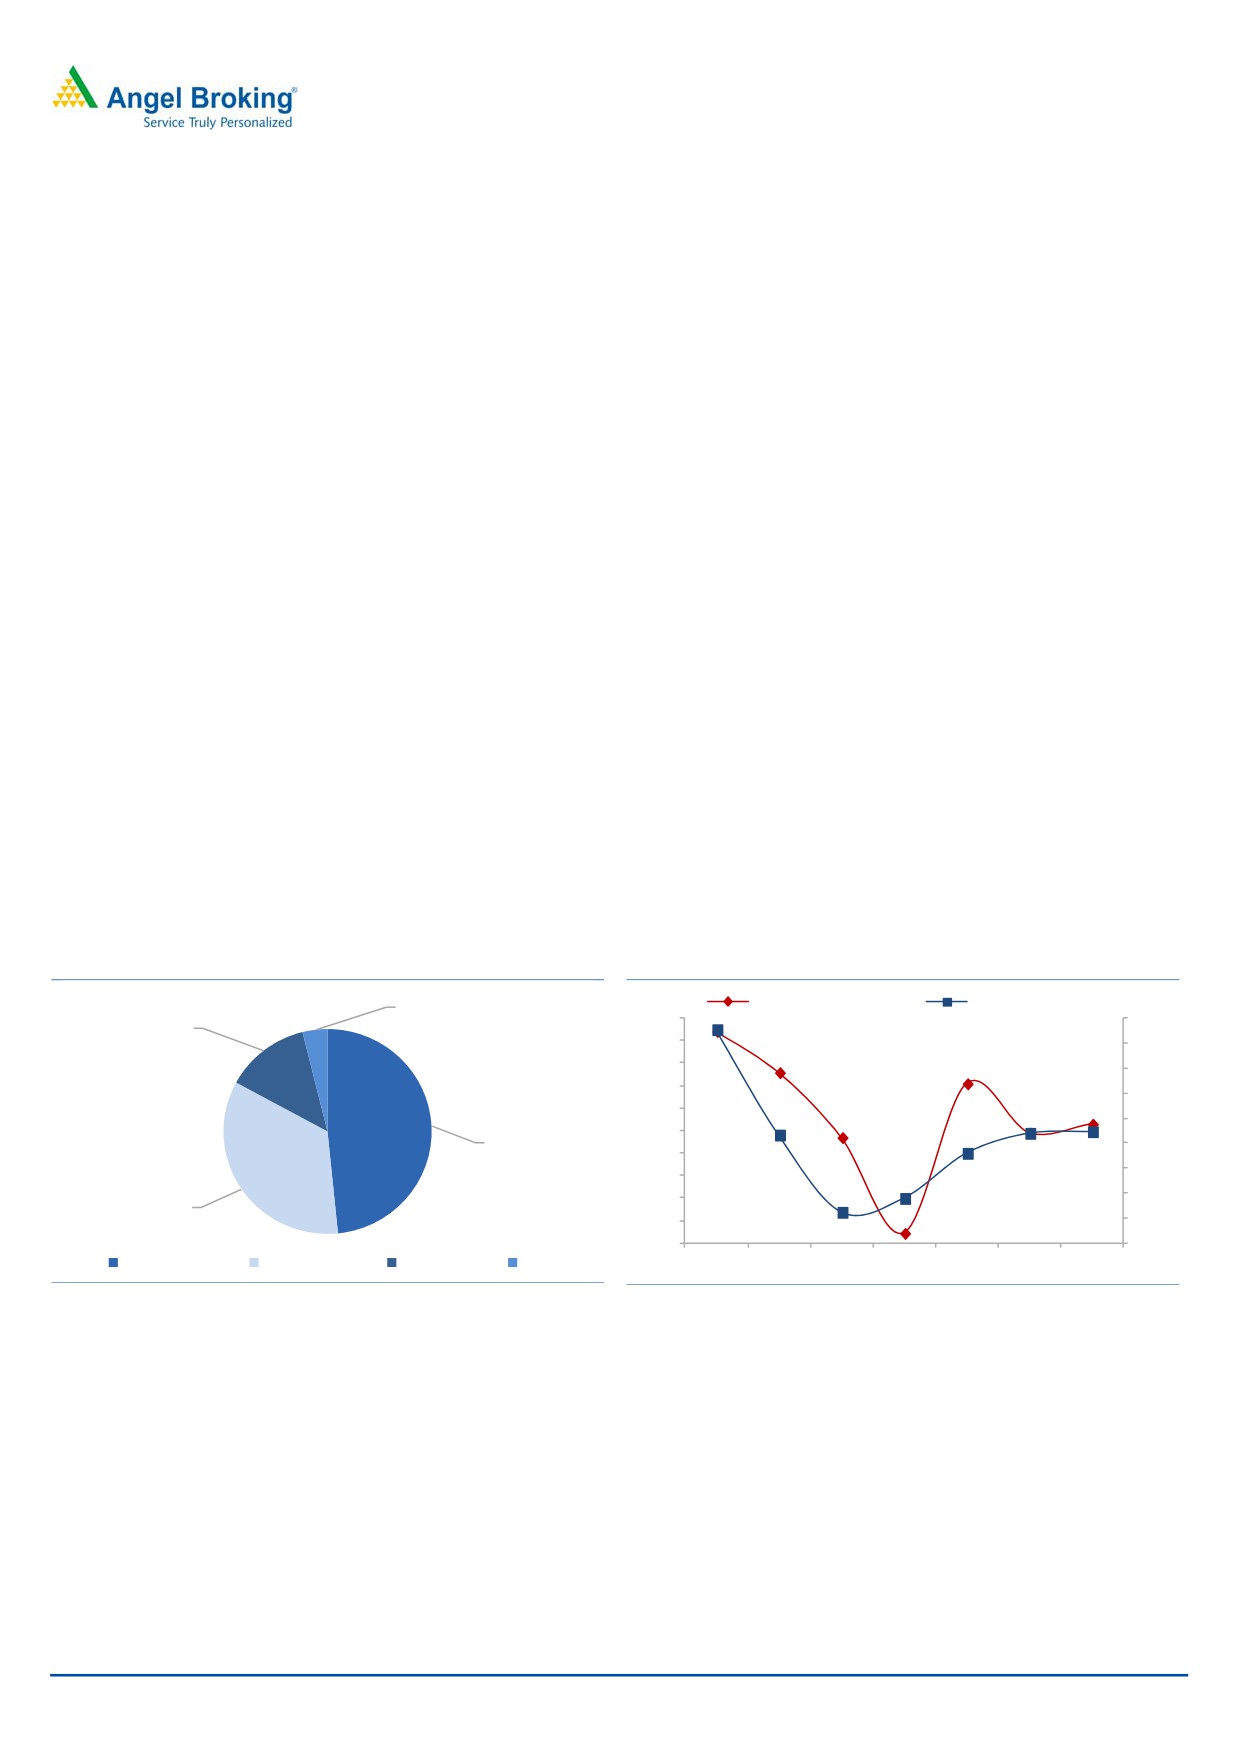
Exhibit 1: Plastic division’s contribution to revenue
Exhibit 2: Plastic growth rate vs. GDP
4%
Plastics Growth (%) (LHS)
GDP Growth (%) (RHS)
13%
20.0
11.0
18.8
18.0
10.0
10.5
15.2
16.0
14.2
9.0
14.0
8.0
12.0
9.8
10.6
9.4
7.0
10.0
48%
6.0
8.0
6.3
6.5
5.6
6.4
5.0
6.0
3.8
4.0
4.0
35%
2.0
3.0
0.9
3.2
-
2.0
Material Handling
Moulded Furniture
Retail (@Home)
Mattress
FY2011
FY2012
FY2013
FY2014
FY2015E FY2016E FY2017E
Source: Company, Angel Research
Source: Company, Angel Research
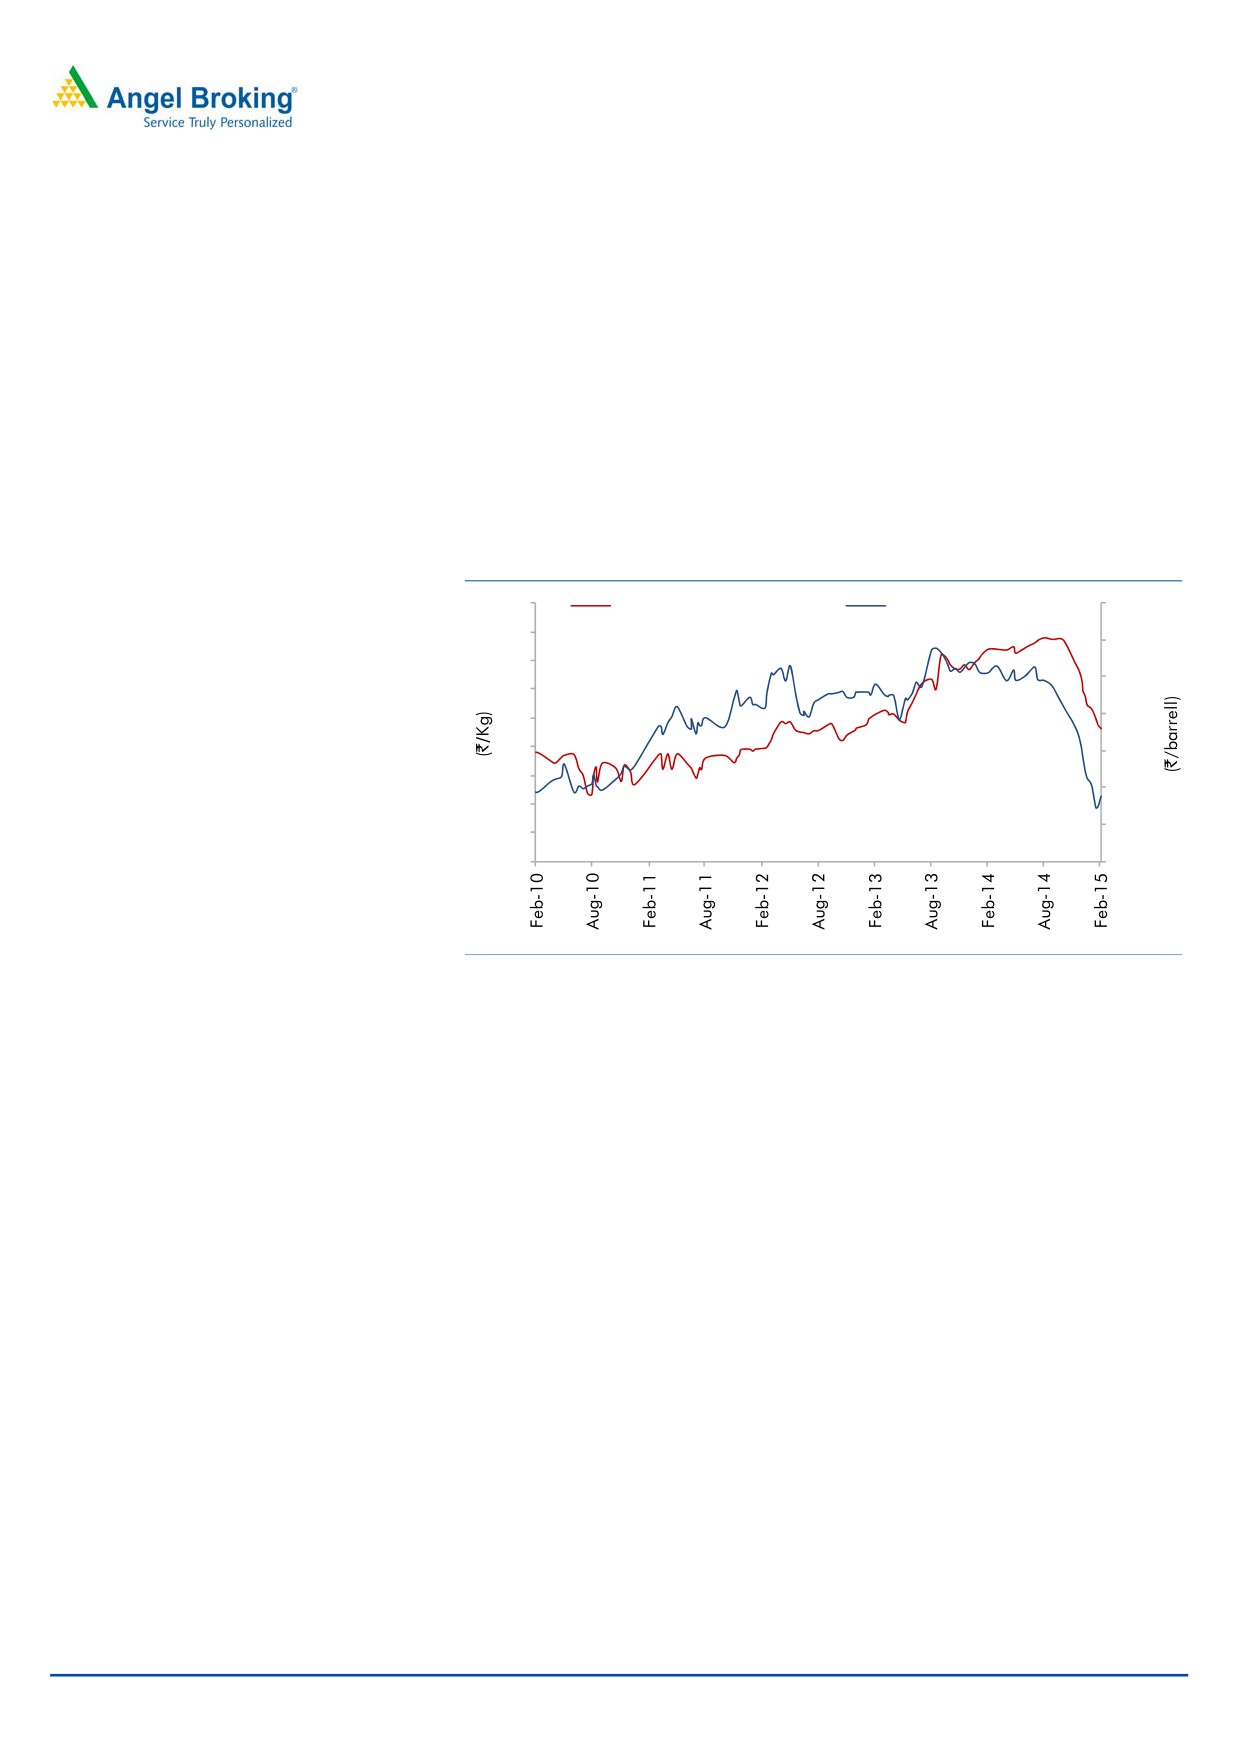
Declining oil prices to result in lower Net RM cost
Since the year 2011 and until recent past, the Brent crude price has been at higher
levels of ~US$100/barrel, mainly due to higher consumption from China. A shift
from crude to alternate energy resources (shale) and a slowing global economy
have resulted in reduction in demand for crude, thereby causing Brent prices to
plummet from US$112/barrel in July 2014 to current levels of US$53/barrel;
down by ~53% during the period. This weakness is likely to persist owing to
OPEC’s reluctance to curb oil production. On this account, NILK will stand to
benefit on the margin front by way of decline in the price of polymer (oil
derivative), which is the main raw material for plastic manufacturers. In
February 5, 2015
2
Initiating coverage | Nilkamal
comparison to ~53% drop in crude oil price, average polyethylene prices have
declined by ~26% during the year.
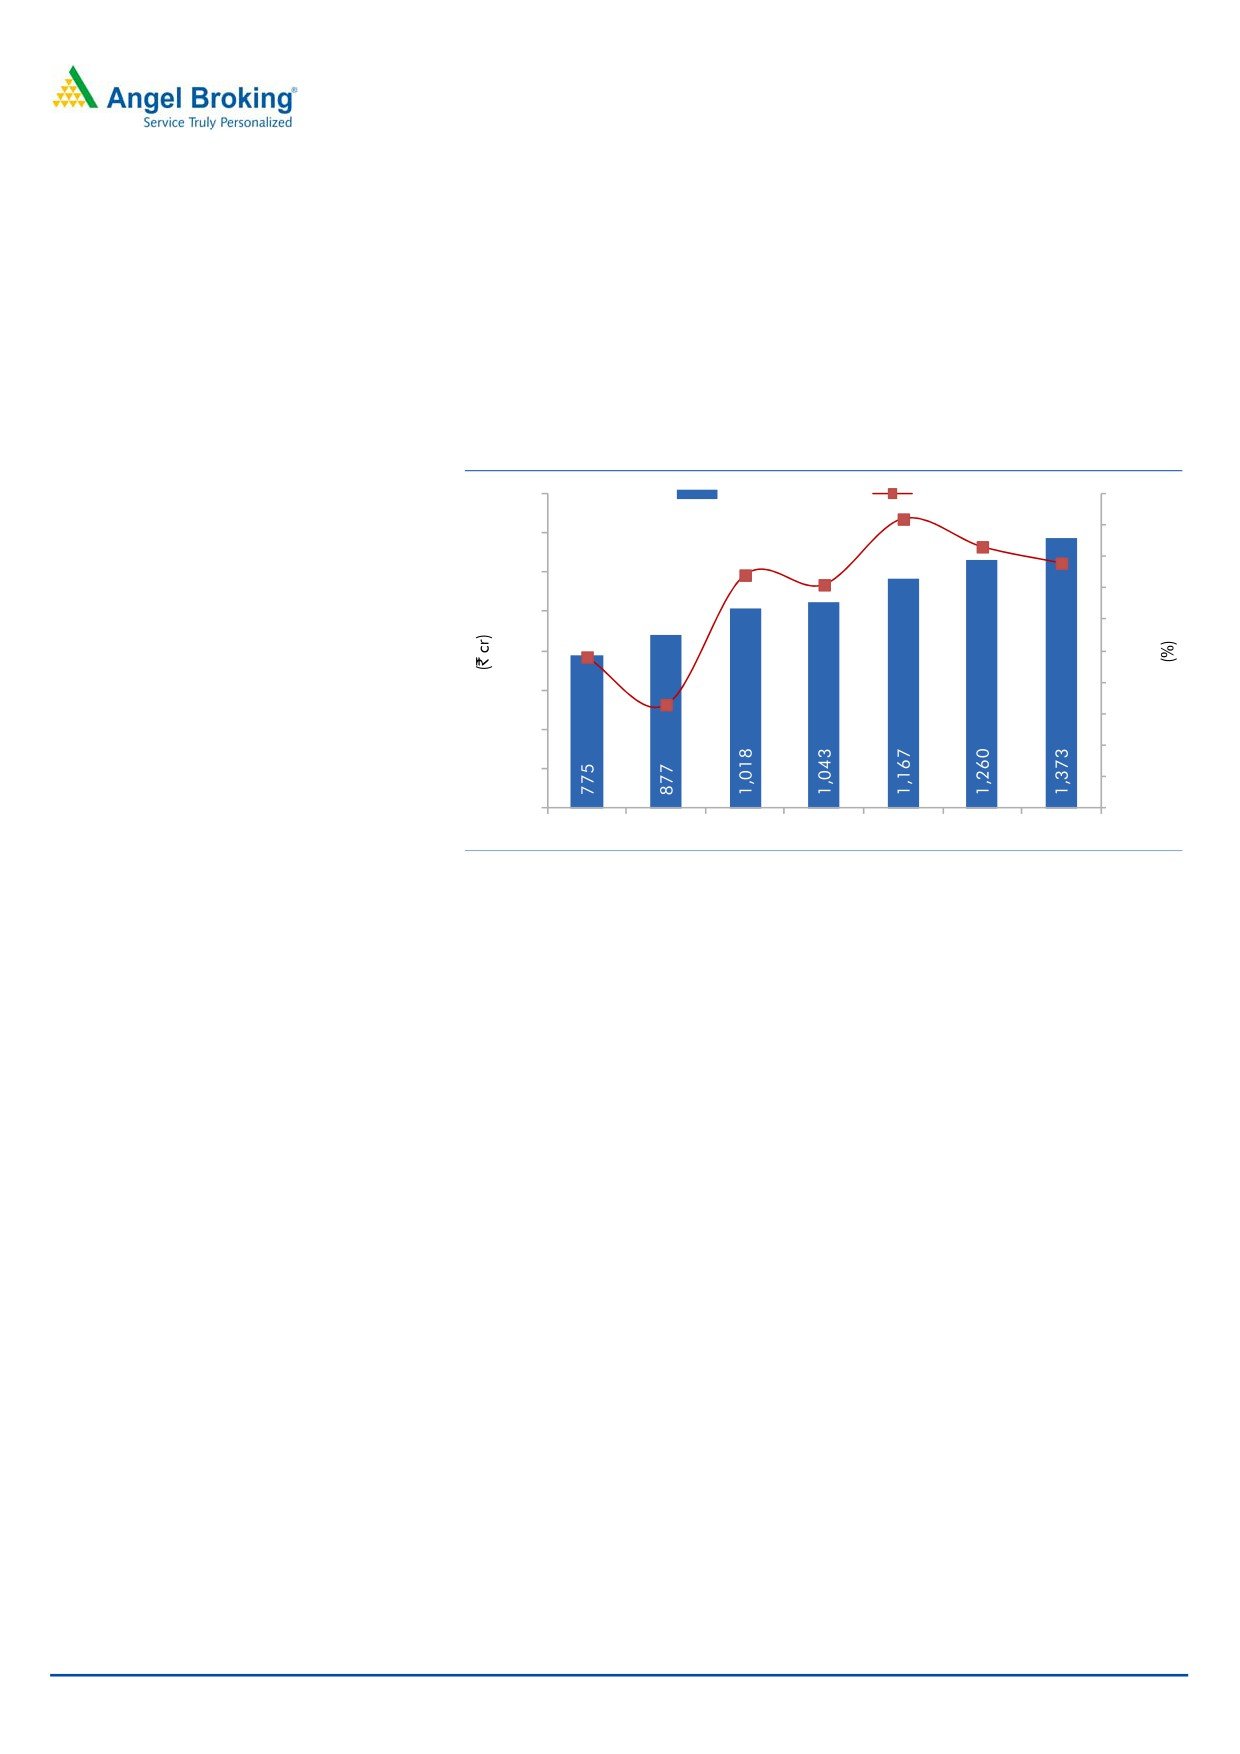
After a similar correction in oil prices post the 2008 crisis, NILK had witnessed a
drop in net raw material cost as a percentage of sales. We expect a similar
reaction this time around and are projecting net raw material cost as a percentage
of sales to peak out in FY2015E at 64.1% and decline from thereon to 63.4% in
FY2017E.
Exhibit 3: Declining Oil prices to result in lower RM cost
1,600
Net Raw Material
As % of Sales
64.5
64.0
1,400
64.1
63.7
63.463.5
63.2
63.1
1,200
63.0
1,000
62.5
800
62.0
61.9
61.5
600
61.1
61.0
400
60.5
200
60.0
-
59.5
FY2011
FY2012
FY2013
FY2014
FY2015E FY2016E FY2017E
Source: Company, Angel Research
Strong Balance Sheet
The “Nilkamal” brand is well perceived in the Moulded Furniture industry. We
believe this augurs well for the retail business as well as the mattress business as
the strong branding enables the company to draw customers. Additionally, NILK’s
balance sheet is stress free with its net-debt/equity maintained below the 1.0x
mark over the past three years. The Management has guided for the debt level to
come down by ~`50cr by FY2016E and stated that it does not have any major
capex plans in the foreseeable future. With sufficient capacity in place, we expect
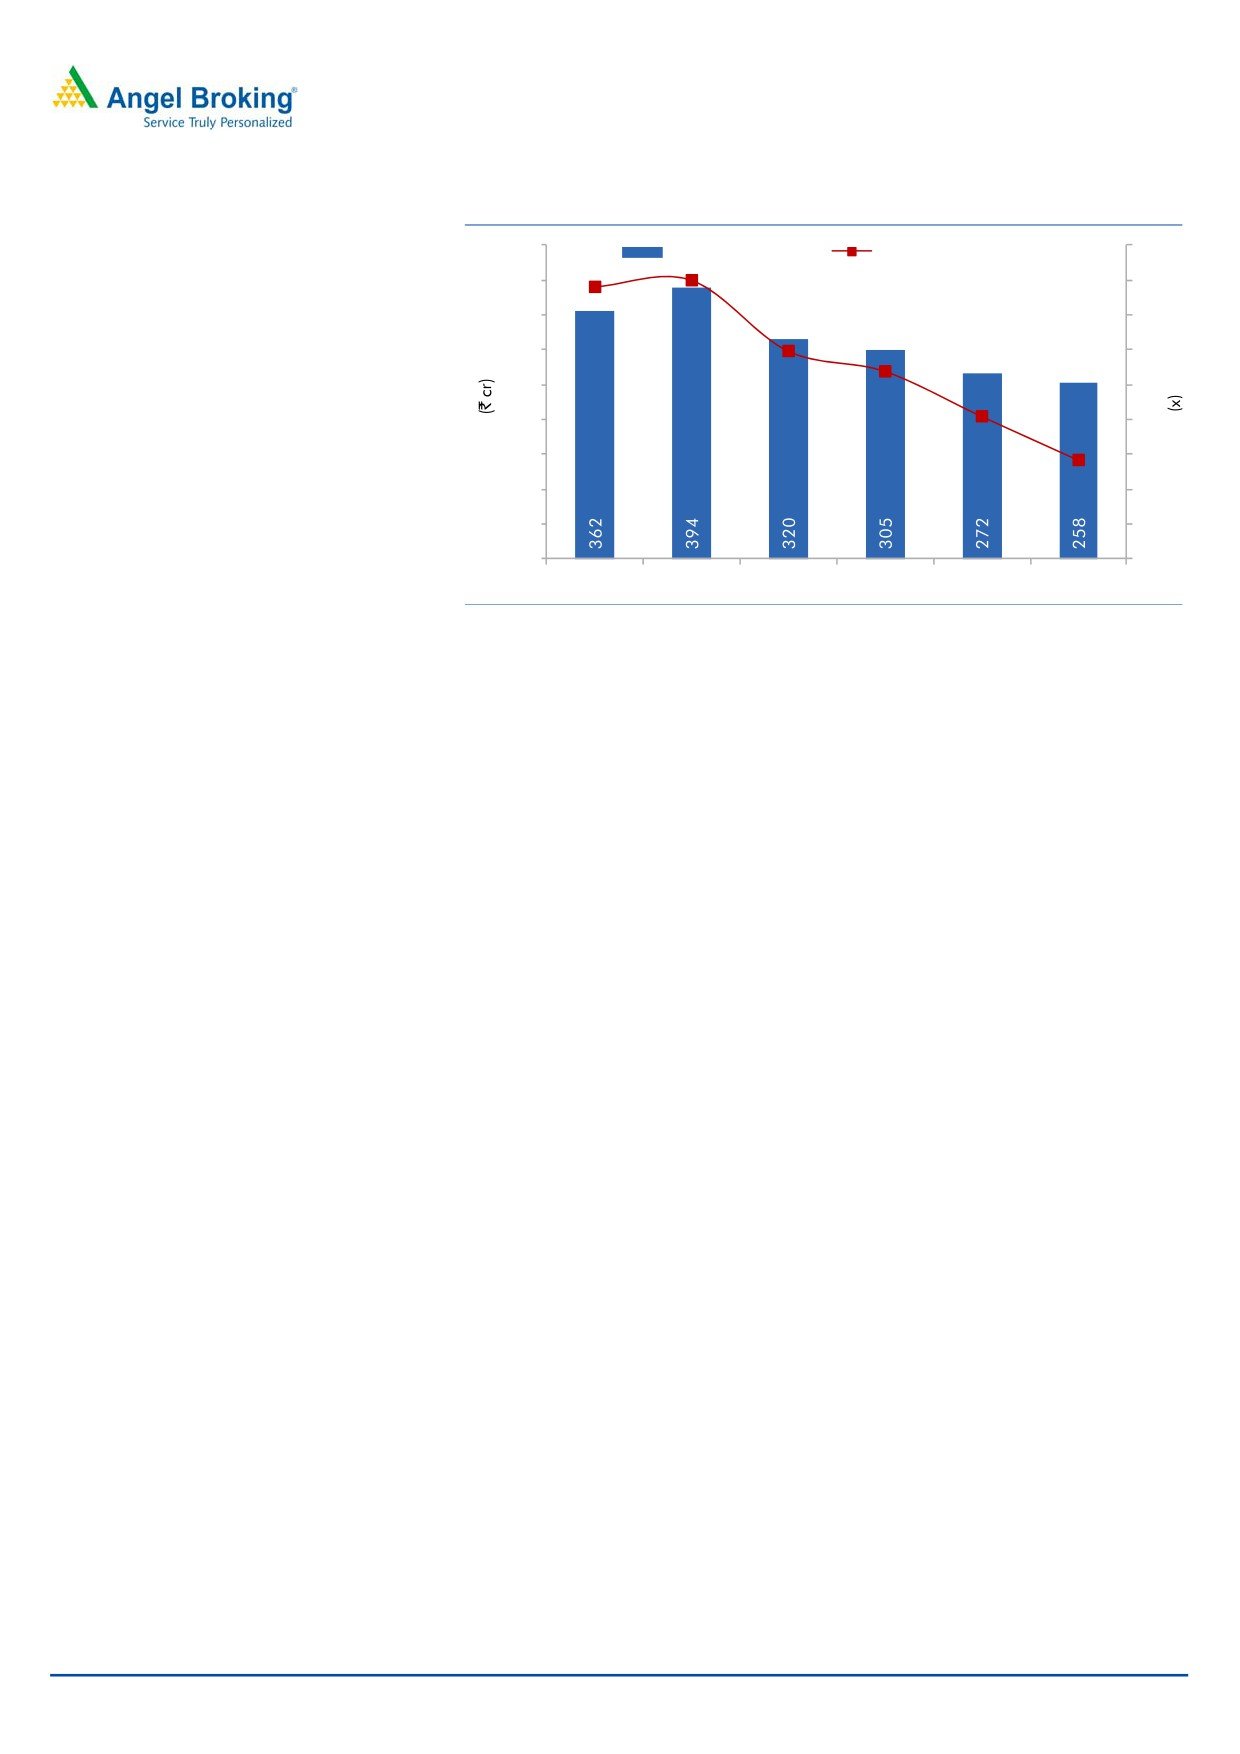
operating leverage to come into play. We expect the company’s net debt to equity
to decline from 0.6x in FY2014 to 0.3x in FY2017E. The asset turnover (Gross
Block) is expected to increase from 2.4x in FY2014 to 2.8x in FY2017E due to
sales CAGR of 9.4% over FY2014-17E and gross block CAGR of 2.6%.
February 5, 2015
3
Initiating coverage | Nilkamal
Exhibit 4: Net debt to equity to decline
455
0.9
Total Debt (LHS)
Net debt to equity (RHS)
405
0.8
0.8
0.8
355
0.7
305
0.6
0.6
0.5
255
0.5
0.4
205
0.4
155
0.3
0.3
105
0.2
55
0.1
5
0.0
FY2012
FY2013
FY2014
FY2015E FY2016E FY2017E
Source: Company, Angel Research
February 5, 2015
4
Initiating coverage | Nilkamal
Financials
Exhibit 5: Key assumptions
Y/E March
FY2015E
FY2016E
FY2017E
Plastics Division Growth
14.2
9.8
10.6
Polyethylene change (%)
5.0
(5.0)
2.0
Source: Company, Angel Research
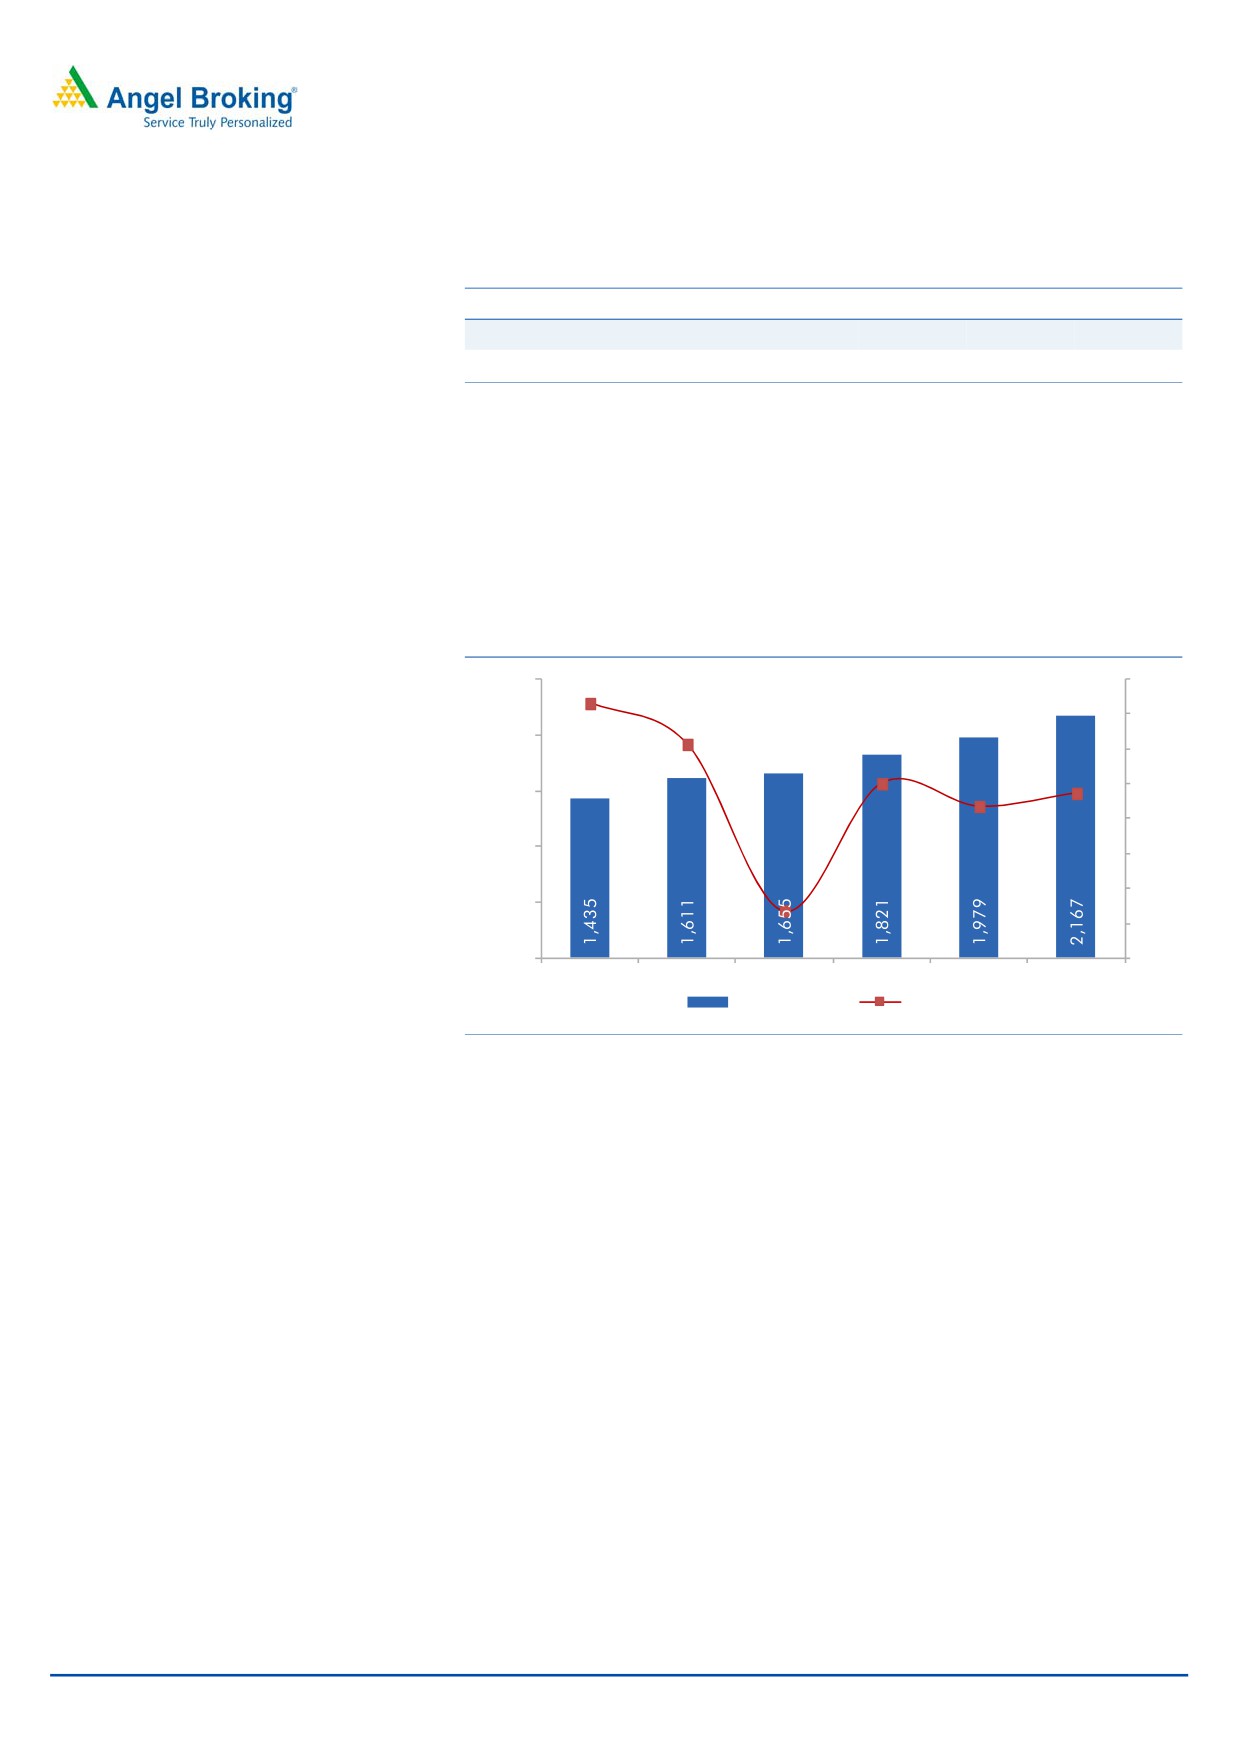
Revival in Indian economy to aid revenue growth
The Material Handling segment and the Moulded Furniture segment are expected
to benefit from an up-turn in the economy. We are estimating its Plastics division to
post a CAGR of
11.5% over FY2014-17E resulting in the overall top-line
registering a CAGR of 9.4% over FY2014-2017E to `2,167cr in FY2017E.
Exhibit 6: Revenue to improve by 9.4% CAGR over FY2014-17E
2,500
16.0
14.6
14.0
2,000
12.3
12.0
10.0
8.7
10.0
1,500
9.5
8.0
1,000
6.0
4.0
500
2.7
2.0
-
0.0
FY2012
FY2013
FY2014
FY2015E FY2016E FY2017E
Revenue (LHS)
Growth (RHS)
Source: Company, Angel Research
In 9MFY2015, the EBITDA margin witnessed a decline on account of increase in
raw material cost. The company has the ability to pass on the increase in raw
material costs, but with some lag. With the ongoing decline in oil prices, we expect
the company’s margin to be impacted on account of inventory loss, but this will
turnaround in the future and lead to improvement in margins. We expect the
EBITDA margin to stabilize at 7.5% in FY2105E and improve from thereon to 8.1%
in FY2017E. The company has guided towards reducing its debt level by ~`50cr
by FY2016E and the resulting decline in interest cost will directly add on to the
bottom-line. Consequently, the company’s net profit is expected to register a CAGR
of 17.5% to `65cr over FY2014-17E.
February 5, 2015
5
Initiating coverage | Nilkamal
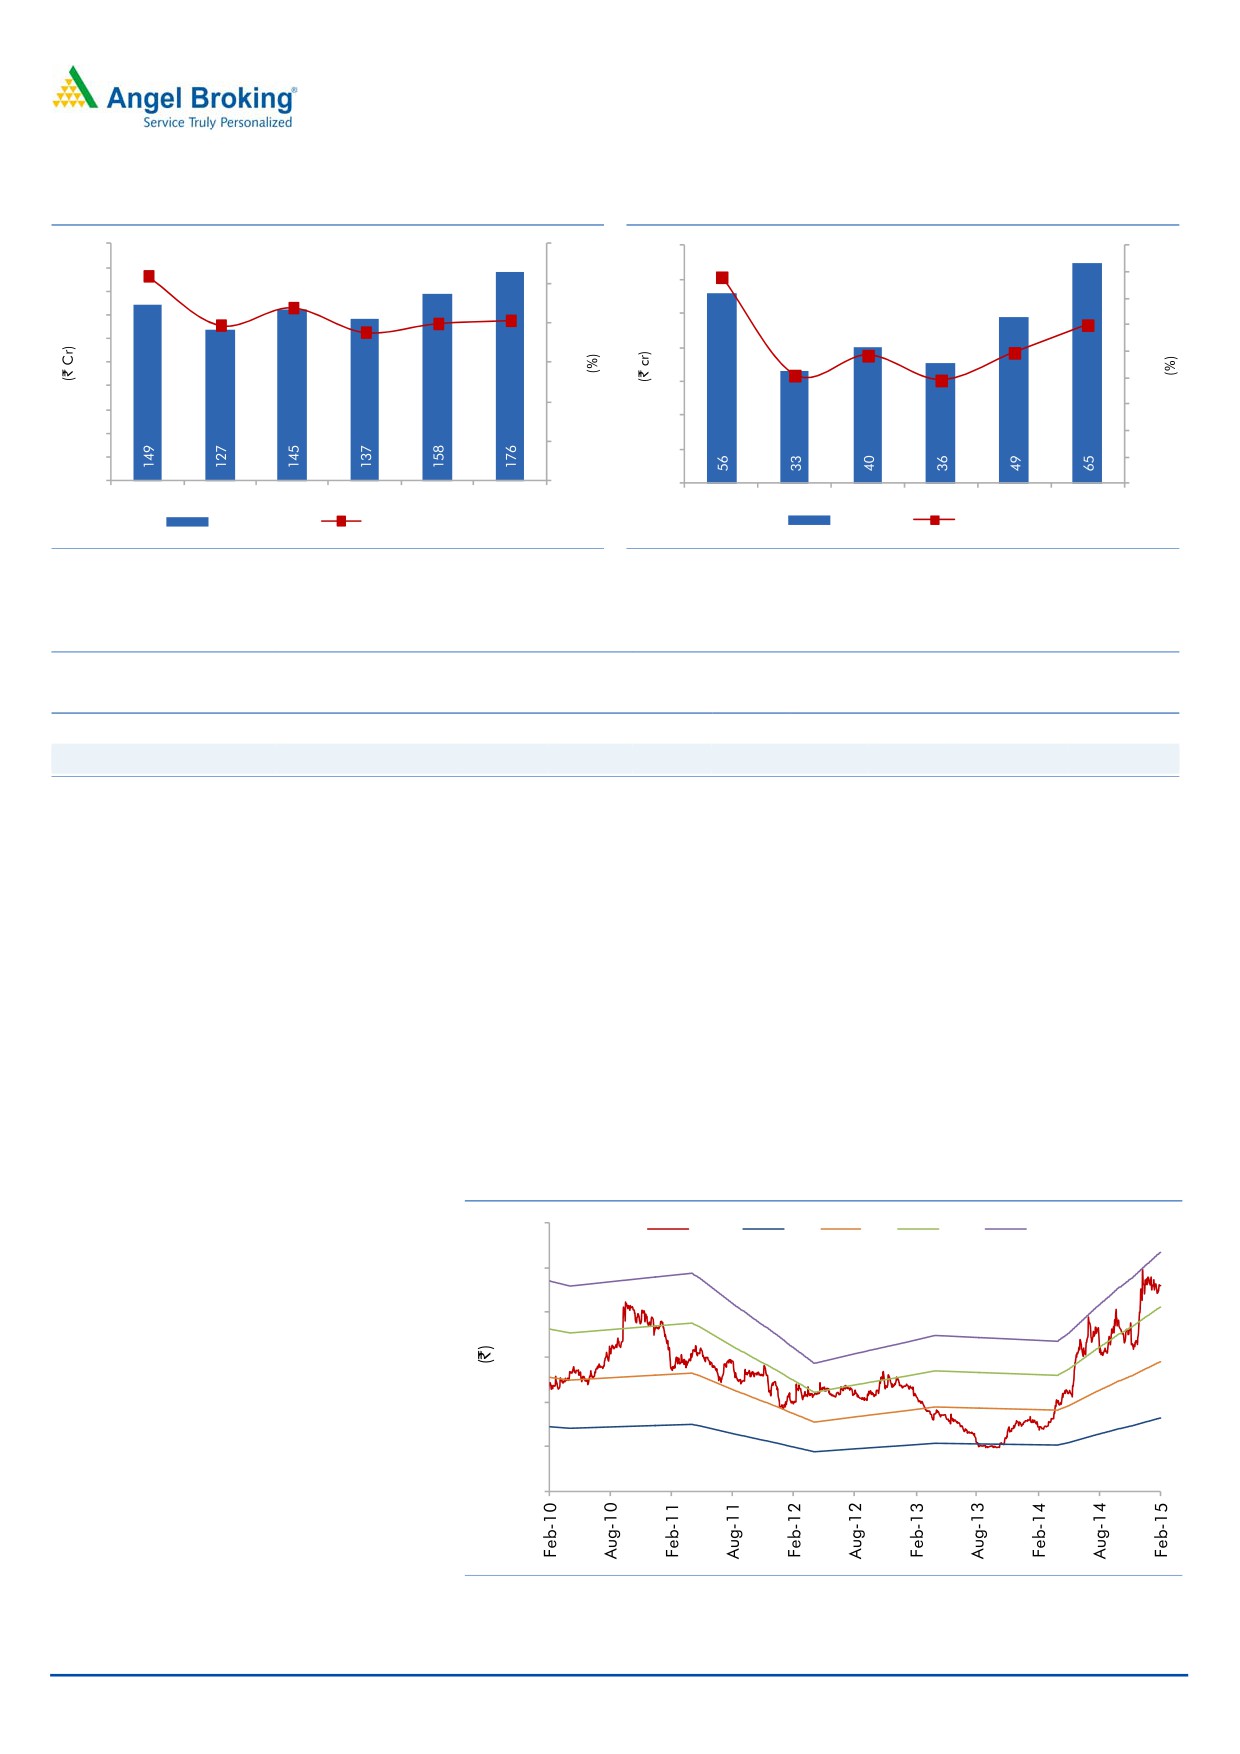
Exhibit 7: EBITDA margins to rebound
Exhibit 8: Expected PAT
200
12.0
70
4.5
10.4
180
3.9
4.0
8.8
10.0
60
160
7.9
8.1
3.5
7.5
8.0
140
50
3.0
8.0
3.0
2.5
120
2.4
40
2.0
2.5
100
6.0
30
2.0
80
2.0
4.0
1.5
60
20
40
1.0
2.0
10
20
0.5
0
0.0
0
0.0
FY2012
FY2013
FY2014
FY2015E FY2016E FY2017E
FY2012
FY2013
FY2014
FY2015E FY2016E FY2017E
EBITDA (LHS)
EBITDA Margin (RHS)
PAT (LHS)
PATM (RHS)
Source: Company, Angel Research
Source: Company, Angel Research
Exhibit 9: Relative valuation (Trailing twelve months)
Company
Mcap
Sales
OPM
PAT
EPS
RoE
P/E
P/BV
EV/BITDA
EV/Sales
(` cr)
(` cr)
(%)
(` cr)
(`)
(%)
(x)
(x)
(x)
(x)
Nilkamal
657
1,618
8.0
31
20.6
6.4
21.4
1.4
6.8
0.5
Supreme Industries
7,884
3,591
15.9
282
18.4
28.3
28.0
7.9
14.9
2.4
Source: Company, Angel Research
Outlook and Valuation
We expect the Material Handling segment of the Plastics division to be the main
beneficiary from an expected up-turn in the economy. We have built in a revenue
CAGR of 9.4% over FY2014-17E. The EBITDA margin of the company is expected
to dip in FY2015E to 7.5% and improve to 8.1% by FY2017E. The debt level is
expected to come down by `62cr over FY2014-17E, resulting in lower finance
costs. Consequently, the net profit is expected to post a CAGR of 17.5% over
FY2014-17E to `65cr. At the current market price, the stock is trading at FY2017E
PE of 10.1x. We initiate coverage on the stock with a Buy rating and a target price
of `566 based on a target FY2017E PE of 13x.
Exhibit 10: One-year forward PE chart
600
Price
4x
7x
10x
13x
500
400
300
200
100
0
Source: Company, Angel Research
February 5, 2015
6
Initiating coverage | Nilkamal
Concerns
Volatile raw material prices: Raw materials account for 63% of net sales.
High volatility in crude and raw material prices could have a negative impact
on the company’s performance.
Economic Slowdown: Economic slowdown will have a negative impact on
the performance of the company as both plastics and @home are dependent
on the economic scenario.
Competition from the unorganized segment: Availability of low priced
furniture from the unorganized segment poses a threat as they are able to
undercut prices by compromising on quality.
Exhibit 11: Crude and Polypropylene price fluctuation
130
Avg Polyethylene Prices (LHS)
Brent Prices INR (RHS)
8,500
120
7,500
110
6,500
100
90
5,500
80
4,500
70
3,500
60
2,500
50
40
1,500
Source: Company, Angel Research
Company background
Incorporated in 1985, Nilkamal Ltd (NILK) is a market leader in moulded plastic
products. The company has three divisions, viz Plastics, Lifestyle Furniture, &
Furnishings and Accessories. The products of these divisions are sold through the
company’s retail chain “@home”; further, the company has recently forayed into
the mattress business. The company’s manufacturing plants are located at Barjora
and Hooghly in West Bengal, Hosur in Tamil Nadu, Jammu, Kharadapada and
Vasona in Dadra & Nagar Haveli, Noida in UP, Sinnor in Maharashtra and in
Pudducherry.
NILK is a market leader in the Material Handling segment, backed by its ability to
directly reach a very diverse set of industrial customers through
400+
self-employed sales people operating from 50+ regional sales offices across
India. The Moulded Furniture segment of the company enjoys a ~39% market
share in its category. NILK has 26 small format stores along with a strong network
of 40+ depots and 1000+ channel partners on a pan India basis, thus enabling it
to serve the remotest rural markets. Its retail store chain “@home”, operates
18 stores across
13 cities covering a retail space of over
3.15 lakh sq. ft.
February 5, 2015
7
Initiating coverage | Nilkamal
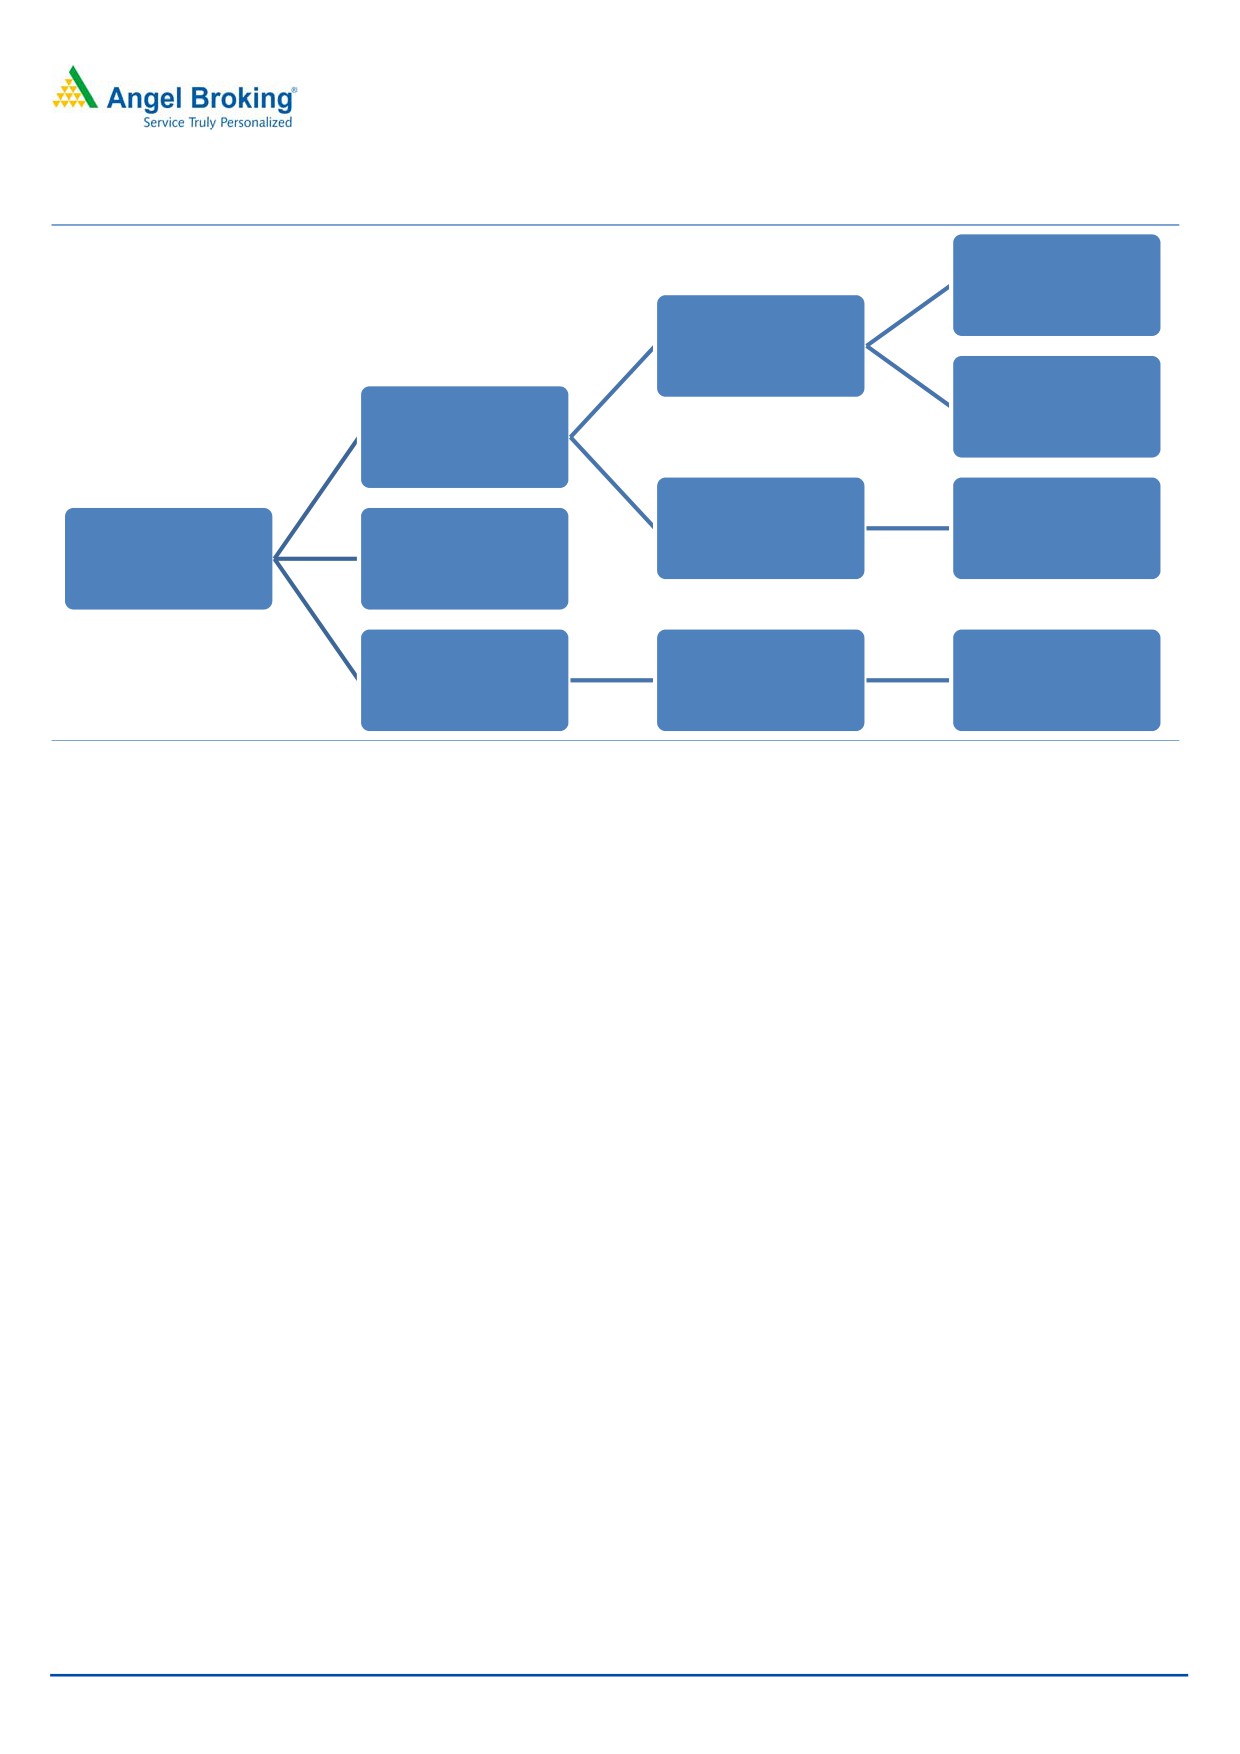
Exhibit 12: NILK Divisions
Major Industries - Dairy,
Pharma, Logistics,
Agriculture, Seafood,
Hospitality
Material Hadling (58%)
Products - Crates, pallets,
metal storage racks,
forklifts and material
Plastics (83%)
handling equipment
Chairs, dining tables,
stools, sofas, trolleys,ready
Moulded Furniture (42%)
to assemble furtniture,
NILK
Mattress & others (4%)
office solutions.
@home - 19 large format
Home furniture,
Retail (13%)
store in 13 cities
furnishings, and
(over 3.15 lac sq.ft.)
accessories.
Source: Company, Angel Research
Subsidiaries
Nilkamal Eswaran Plastic Pvt. Ltd (Sri Lanka): 76% holding; the company is
a leading manufacturer of moulded furniture in Sri Lanka.
Nilkamal Eswaran Marketing Pvt. Ltd (Sri Lanka): 76% holding.
Nilkamal Crates & Bins FZE (UAE): A wholly owned subsidiary, manufacturing
and exporting plastic containers, pallets, parts bins, waste bins, ice boxes, metal
wire cage and hand pallet trucks.
Joint Ventures
Nilkamal BITO Storage Systems Pvt. Ltd: 50% JV; into manufacturing and selling of
metal storage systems.
Cambro Nilkamal Pvt Ltd: 50% JV; manufactures hospitality products suited for
large restaurants and hotels.
February 5, 2015
8
Initiating coverage | Nilkamal
Industry
Plastic products are made from polymers such as polyethylene (PE), polypropylene
(PP), polystyrene (PS) and polyvinyl chloride (PVC) which are processed in
numerous ways to achieve the desired product. Plastic products have application in
various industries as well as in households. As per a report by India Brand Equity
Foundation (IBEF) on the India plastic industry, the per capita consumption of
plastic in India is very low. According to industry reports, the plastic processing
industry is highly fragmented with approximately
35,000-40,000 plastic
processing units in India, most of which can be classified as small-scale
operations. Citing increase in usage of plastic across various industries, per capita
consumption of plastic is expected to double in the next five years. As per a FICCI
2014 report, the plastic industry is one of the fastest growing industries in India. It
has protracted at ~8% CAGR to reach 8.5mtpa in FY2013 from 6mtpa in FY2008.
As per the Indian retail industry analysis by IBEF, the total market size of the retail
industry in India had reached US$0.5 trillion in 2012, registering a CAGR of 7%
since 1998 and is expected to touch US$1.3 trillion by 2020. Of the overall retail
market in India, unorganised players accounted for a 92% share during 2012.
Organised retail is expected to account for
20% of total retail by
2020.
E-commerce is expected to play a significant role in the development of the
industry going forward. Additionally, annual household income is expected to
increase from $2632(2005) to $3823(2015E) and $6790(2020E).
February 5, 2015
9
Initiating coverage | Nilkamal
Profit and loss statement (standalone)
Y/E March (` cr)
FY2013
FY2014
FY2015E
FY2016E
FY2017E
Net Sales
1,611
1,655
1,821
1,979
2,167
Other operating income
-
-
-
-
-
Total operating income
1,611
1,655
1,821
1,979
2,167
% chg
12.3
2.7
10.0
8.7
9.5
Net Raw Materials
1018
1043
1167
1260
1373
% chg
16.0
2.5
11.8
8.0
9.0
Power and Fuel
47
40
44
47
52
% chg
10.9
(15.8)
10.0
8.7
9.5
Personnel
102
105
113
123
136
% chg
12.9
3.7
7.1
8.7
11.2
Other
317
322
360
392
429
% chg
14.8
1.4
12.1
8.7
9.5
Total Expenditure
1484
1510
1684
1822
1991
EBITDA
127
145
137
158
176
% chg
(14.7)
14.3
(5.6)
15.1
11.6
(% of Net Sales)
7.9
8.8
7.5
8.0
8.1
Depreciation & Amortisation
44
49
55
58
60
EBIT
82
96
82
100
116
% chg
(23.8)
16.4
(15.1)
22.1
16.7
(% of Net Sales)
5.1
5.8
4.5
5.0
5.4
Interest & other Charges
43
41
35
33
31
Other Income
4
4
5
4
9
(% of Net Sales)
0.3
0.2
0.3
0.2
0.4
Recurring PBT
39
55
47
67
85
% chg
(42.4)
38.3
(14.4)
43.3
27.6
PBT (reported)
44
58
52
71
94
Tax
12
18
16
22
29
(% of PBT)
28.6
31.1
31.1
31.1
31.1
PAT (reported)
31
40
36
49
65
Extraordinary Expense/(Inc.)
(2)
(0)
-
-
-
ADJ. PAT
33
40
36
49
65
% chg
(41.2)
21.6
(11.3)
37.8
32.7
(% of Net Sales)
2.0
2.4
2.0
2.5
3.0
Basic EPS (`)
22.1
26.8
23.8
32.8
43.5
Fully Diluted EPS (`)
22.1
26.8
23.8
32.8
43.5
% chg
(41.2)
21.6
(11.3)
37.8
32.7
Dividend
7
7
7
7
7
Retained Earning
26
33
29
42
58
February 5, 2015
10
Initiating coverage | Nilkamal
Balance sheet (Standalone)
Y/E March (`cr)
FY2013
FY2014
FY2015E
FY2016E
FY2017E
SOURCES OF FUNDS
Equity Share Capital
15
15
15
15
15
Reserves& Surplus
414
448
476
518
576
Shareholders’ Funds
429
463
491
533
591
Total Loans
394
320
305
272
258
Other Long Term Liabilities
32
33
33
33
33
Long Term Provisions
7
7
7
7
7
Deferred Tax (Net)
22
24
24
24
24
Total Liabilities
885
847
861
870
914
APPLICATION OF FUNDS
Gross Block
681
717
731
753
775
Less: Acc. Depreciation
343
385
440
498
558
Less: Impairment
-
-
-
-
-
Net Block
338
333
291
255
218
Capital Work-in-Progress
4
2
2
2
2
Lease adjustment
-
-
-
-
-
Goodwill
-
-
-
-
-
Investments
25
26
26
26
26
Long Term Loans and adv.
51
56
56
56
56
Other Non-current asset
1
0
0
0
0
Current Assets
608
579
649
705
802
Cash
25
18
15
28
65
Loans & Advances
48
43
46
47
48
Inventory
305
301
346
365
399
Debtors
230
218
242
266
291
Other current assets
-
-
-
-
-
Current liabilities
143
149
163
175
191
Net Current Assets
465
430
486
530
612
Misc. Exp. not written off
-
-
-
-
-
Total Assets
885
847
861
870
914
February 5, 2015
11
Initiating coverage | Nilkamal
Cash flow statement (Standalone)
Y/E March (`cr)
FY2013
FY2014
FY2015E FY2016E FY2017E
Profit before tax
44
58
52
71
94
Depreciation
44
49
55
58
60
Change in Working Capital
(52)
28
(59)
(32)
(45)
Direct taxes paid
(12)
(18)
(16)
(22)
(29)
Others
(4)
(4)
(5)
(4)
(9)
Cash Flow from Operations
19
113
27
71
71
(Inc.)/Dec. in Fixed Assets
(51)
(34)
(14)
(22)
(23)
(Inc.)/Dec. in Investments
0
(0)
0
0
0
(Incr)/Decr In LT loans & adv.
(1)
(5)
-
-
-
Others
4
4
5
4
9
Cash Flow from Investing
(48)
(36)
(9)
(18)
(14)
Issue of Equity
-
-
-
-
-
Inc./(Dec.) in loans
32
(74)
(14)
(34)
(14)
Dividend Paid (Incl. Tax)
(7)
(7)
(7)
(7)
(7)
Others
9
(3)
-
-
-
Cash Flow from Financing
34
(84)
(21)
(41)
(21)
Inc./(Dec.) in Cash
5
(7)
(3)
13
37
Opening Cash balances
20
25
18
15
28
Closing Cash balances
25
18
15
28
65
February 5, 2015
12
Initiating coverage | Nilkamal
Key Ratios (Standalone)
Y/E March
FY2013
FY2014
FY2015E
FY2016E
FY2017E
Valuation Ratio (x)
P/E (on FDEPS)
20.0
16.4
18.5
13.4
10.1
P/CEPS
8.5
7.4
7.2
6.1
5.3
P/BV
1.5
1.4
1.3
1.2
1.1
Dividend yield (%)
1.1
1.0
1.1
1.1
1.1
EV/Net sales
0.6
0.6
0.5
0.4
0.4
EV/EBITDA
7.9
6.4
6.7
5.6
4.7
EV / Total Assets
1.2
1.1
1.1
1.0
0.9
Per Share Data (`)
EPS (Basic)
14.8
18.0
15.9
22.0
29.2
EPS (fully diluted)
14.8
18.0
15.9
22.0
29.2
Cash EPS
51.8
59.6
60.9
71.6
83.5
DPS
4.7
4.6
4.6
4.6
4.6
Book Value
287.5
310.1
329.2
357.4
396.2
DuPont Analysis
EBIT margin
5.1
5.8
4.5
5.0
5.4
Tax retention ratio
0.7
0.7
0.7
0.7
0.7
Asset turnover (x)
2.1
2.1
2.3
2.5
2.7
ROIC (Post-tax)
7.6
8.3
7.1
8.7
10.1
Cost of Debt (Post Tax)
8.1
8.0
7.7
7.8
8.0
Leverage (x)
0.8
0.6
0.5
0.4
0.3
Operating ROE
7.1
8.6
6.9
9.0
10.7
Returns (%)
ROCE (Pre-tax)
9.9
11.4
9.8
11.8
13.4
Angel ROIC (Pre-tax)
10.6
12.1
10.4
12.6
14.6
ROE
7.9
9.0
7.4
9.6
11.5
Turnover ratios (x)
Asset TO (Gross Block)
2.5
2.4
2.5
2.7
2.8
Inventory / Net sales (days)
66
67
65
66
64
Receivables (days)
48
49
49
49
49
Payables (days)
34
35
35
35
35
WC cycle (ex-cash) (days)
94
94
88
90
88
Solvency ratios (x)
Net debt to equity
0.8
0.6
0.5
0.4
0.3
Net debt to EBITDA
2.7
1.9
1.9
1.4
1.0
Int. Coverage (EBIT/ Int.)
1.9
2.3
2.3
3.1
3.8
February 5, 2015
13
Initiating coverage | Nilkamal
Research Team Tel: 022 - 39357800
DISCLAIMER
This document is solely for the personal information of the recipient, and must not be singularly used as the basis of any investment
decision. Nothing in this document should be construed as investment or financial advice. Each recipient of this document should
make such investigations as they deem necessary to arrive at an independent evaluation of an investment in the securities of the
companies referred to in this document (including the merits and risks involved), and should consult their own advisors to determine
the merits and risks of such an investment.
Angel Broking Pvt. Limited, its affiliates, directors, its proprietary trading and investment businesses may, from time to time, make
investment decisions that are inconsistent with or contradictory to the recommendations expressed herein. The views contained in this
document are those of the analyst, and the company may or may not subscribe to all the views expressed within.
Reports based on technical and derivative analysis center on studying charts of a stock's price movement, outstanding positions and
trading volume, as opposed to focusing on a company's fundamentals and, as such, may not match with a report on a company's
fundamentals.
The information in this document has been printed on the basis of publicly available information, internal data and other reliable
sources believed to be true, but we do not represent that it is accurate or complete and it should not be relied on as such, as this
document is for general guidance only. Angel Broking Pvt. Limited or any of its affiliates/ group companies shall not be in any way
responsible for any loss or damage that may arise to any person from any inadvertent error in the information contained in this report.
Angel Broking Pvt. Limited has not independently verified all the information contained within this document. Accordingly, we cannot
testify, nor make any representation or warranty, express or implied, to the accuracy, contents or data contained within this document.
While Angel Broking Pvt. Limited endeavours to update on a reasonable basis the information discussed in this material, there may be
regulatory, compliance, or other reasons that prevent us from doing so.
This document is being supplied to you solely for your information, and its contents, information or data may not be reproduced,
redistributed or passed on, directly or indirectly.
Angel Broking Pvt. Limited and its affiliates may seek to provide or have engaged in providing corporate finance, investment banking
or other advisory services in a merger or specific transaction to the companies referred to in this report, as on the date of this report or
in the past.
Neither Angel Broking Pvt. Limited, nor its directors, employees or affiliates shall be liable for any loss or damage that may arise from
or in connection with the use of this information.
Note: Please refer to the important `Stock Holding Disclosure' report on the Angel website (Research Section). Also, please refer to the
latest update on respective stocks for the disclosure status in respect of those stocks. Angel Broking Pvt. Limited and its affiliates may
have investment positions in the stocks recommended in this report.
Disclosure of Interest Statement
Nilkamal
1. Analyst ownership of the stock
No
2. Angel and its Group companies ownership of the stock
No
3. Angel and its Group companies' Directors ownership of the stock
No
4. Broking relationship with company covered
No
Note: We have not considered any Exposure below ` 1 lakh for Angel, its Group companies and Directors
Ratings (Returns):
Buy (> 15%)
Accumulate (5% to 15%)
Neutral (-5 to 5%)
Reduce (-5% to -15%)
Sell (< -15%)
February 5, 2015
14
Initiating coverage | Nilkamal
6th Floor, Ackruti Star, Central Road, MIDC, Andheri (E), Mumbai- 400 093. Tel: (022) 39357800
Research Team
Fundamental:
Sarabjit Kour Nangra
VP-Research, Pharmaceutical
Vaibhav Agrawal
VP-Research (Banking)
Amarjeet Maurya
Analyst (FMCG, Media, Mid-Cap)
Bharat Gianani
Analyst (Automobile)
Rahul Dholam
Analyst (Metal, Oil & Gas)
Santosh Yellapu
Analyst (Infrastructure)
Shrenik Gujrathi
Analyst (Cap Goods, Cement)
Umesh Matkar
Analyst (Banking)
Twinkle Gosar
Analyst (Mid-Cap)
Tejas Vahalia
Research Editor
Technicals and Derivatives:
Siddarth Bhamre
Head - Technical & Derivatives
Sameet Chavan
Technical Analyst
Sneha Seth
Associate (Derivatives)
Institutional Sales Team:
Mayuresh Joshi
VP - Institutional Sales
Meenakshi Chavan
Dealer
Gaurang Tisani
Assistant Manager
Production Team:
Dilip Patel
Production Incharge
CSO & Registered Office: G-1, Ackruti Trade Centre, Road No. 7, MIDC, Andheri (E), Mumbai - 93. Tel: (022) 3083 7700. Angel Broking Pvt. Ltd: BSE Cash: INB010996539 / BSE F&O: INF010996539, CDSL Regn. No.: IN - DP - CDSL - 234 - 2004, PMS Regn. Code: PM/INP000001546, NSE Cash: INB231279838 /
NSE F&O: INF231279838 / NSE Currency: INE231279838, MCX Stock Exchange Ltd: INE261279838 / Member ID: 10500. Angel Commodities Broking (P) Ltd.: MCX Member ID: 12685 / FMC Regn. No.: MCX / TCM / CORP / 0037 NCDEX: Member ID 00220 / FMC Regn. No.: NCDEX / TCM / CORP / 0302.
February 5, 2015
15