Nagarjuna Agrichem | Agrichemical
December 22, 2014
Nagarjuna Agrichem
BUY
CMP
`12
Initiating Coverage
Target Price
`18
Nagarjuna Agrichem Ltd (NACL) is one of the largest pesticide agrichemical
Investment Period
12 Months
companies in the country with a market share of ~4% and belongs to the
Nagarjuna Group of Hyderabad. NACL manufactures a comprehensive range of
Stock Info
pesticide technicals, formulations and custom manufactured fine chemicals
Sector
Agrochemical
through its three plants situated at Srikakulam, Ethakota and Shadnagar in
Market Cap (` cr)
193
Andhra Pradesh. Pesticides account for more than 95% of the company's total
Net debt (` cr)
202
revenues. Historically, the domestic business has been contributing by around
Beta
0.8
70% to the company’s overall revenues, while exports have been accounting for
52 Week High / Low
17 / 4
the balance. However, in the recent past, the contribution of exports has come
Avg. Daily Volume
83,067
down, ie to ~20% in FY2014.
Face Value (`)
1
Profitability to improve: NACL’s performance since FY2011-14 has been
BSE Sensex
27,372
impacted on account of a slew of industry and company specific issues. Raw
Nifty
8,225
material constraints and raw material price hikes have diluted the gross margin of
Reuters Code
NAGA.BO
the company, which has now stabilized at around ~30% from a high of ~39%
Bloomberg Code
CGI@IN
(Avg. FY2000-10). Also, in FY2013, exports were significantly impacted due to the
closure of the Srikakulam Plant for about five months and the incapacitation of
Block 5 which was affected by a fire. Block 5 is one of the largest blocks in the
Shareholding Pattern (%)
plant and accounting for around 40% of the total capacity of the plant (FY2013);
Promoters
74.8
its closure impacted the operating profitability of the company. These factors led
MF / Banks / Indian Fls
4.9
the company to post an EBIDTA profit of a mere `4cr in FY2014. However, with
FII / NRIs / OCBs
0.3
the block operational again and raw material prices stabilizing, the company is
Indian Public / Others
20.0
poised to be back on the path of recovery. Hence, we expect the company to post
a 16.1% CAGR in its top-line over FY2014-16E to `849cr and EBDITA margins
bouncing back to around 10.3% levels (in FY2016).
Abs. (%)
3m 1yr 3yr
Outlook & Valuation: With the Srikakulam plant’s Block 5 back into operation, the
Sensex
1.1
29.6
72.9
company is expected to witness improved profitability, going forward. Thus, we
Nag. Agrichem
(18.3)
219.2
90.0
expect the company to post a sales CAGR of 16.1% over FY2014-16E and a net
profit of `39cr in FY2016E V/s a loss of `12.6cr in FY2013. At the CMP, the stock
trades at a P/E of 5.0x FY2016E EPS, which we believe is attractive in comparison
to its peers. Thus we recommend a Buy on the stock with a target price of `18.
Key financials (Consolidated)
Y/E March (` cr)
FY2012
FY2013
FY2014
FY2015E
FY2016E
Net sales
626
596
630
739
849
% chg
12.9
(4.9)
5.7
17.4
14.9
Adj. net profit
7
(13)
(18)
10
39
% chg
61.5
-
40.3
-
298.3
EBITDA Margin (%)
8.6
2.1
0.7
5.8
10.3
EPS (`)
0.5
(0.8)
(1.1)
0.6
2.5
P/E (x)
25.1
(14.6)
(10.9)
20.0
5.0
P/BV (x)
0.9
0.9
1.1
1.1
0.9
RoE (%)
3.6
(6.3)
(9.6)
5.4
19.3
RoCE (%)
9.6
2.1
1.8
9.3
16.2
Sarabjit kour Nangra
EV/Sales (x)
0.6
0.6
0.6
0.6
0.6
+91-22-3935 7800 Ext: 6806
EV/EBITDA (x)
7.1
26.9
92.9
10.3
5.5
Source: Company, Angel Research; Note: CMP as of December 19, 2014
Please refer to important disclosures at the end of this report
1
Nagarjuna Agrichem | Initiating Coverage
Investment arguments
Pick up in exports to drive growth momentum
Revival in exports to drive future top-line
Over the last one decade (FY2000-2010) NACL has emerged as one of the fastest
growth
growing agrochemical companies, posting a sales CAGR of 29.2%. The sales
growth during the period was mainly driven by exports which posted a CAGR of
54.8%, albeit on a lower base, to end the period at `225cr (FY2010). The
domestic markets segment posted a CAGR of around 24.5% (FY2010) during the
period, leading the company to emerge among the top 10 players in the domestic
market. However, since FY2011, the company’s performance has moderated, with
it posting sales CAGR of only 4.3% over the FY2011-14 period. The main cause
for the same has been gyration in exports and institutional sales. Revenues from
these segments were impacted due to lower demand in export markets and owing
to other operational reasons.
Also, in FY2013, exports were significantly impacted due to the closure of
Srikakulam plant for about five months and due to the incapacitation of Block 5
which was affected by a fire. Block 5 is one of the largest blocks in the plant and
accounted for around 40% of the total capacity of the plant (FY2013). Export sales
accordingly decreased to `120cr in FY2013 V/s `197cr in FY2012. Rough
calculations put the overall sales attributable to the plant at ~`200cr. The
incapacitation of the plant has also severely impacted export sales of the company
in FY2014, which dipped by 23.3% to end the period at `92cr. As a result, the
contribution of exports to total revenue dipped to around 20% in FY2014 from
35% in FY2010.
However, the company has finished its rebuilding work of the fire affected Block-5
and it was re-commissioned in March 2014; the first output of the plant was
received on 30th March, 2014. As a part of risk mitigation and in order to prevent
any such untoward event in future, the company has taken various initiatives and
additional safety measures.
Thus the export and institutional sales of the company have resumed and the same
are reflected in the company’s net sales growth of 19.2% for 1HFY2015. During
FY2015, the company expects to clock export sales of `200cr and should reach its
earlier export sales levels of around `250cr by FY2016.
On the domestic markets front, the company has been growing at a rate higher
than the industry. Going forward, with domestic markets expected to grow at a
CAGR of 12%, on a conservative basis, we easily expect the company to post a
CAGR of 13% over FY2014-16E, while exports are expected to post a CAGR of
61.5% during the same period. This would enable the company to post a CAGR of
16.1% in sales over FY2014-16E to `849cr.
December 22, 2014
2
Nagarjuna Agrichem | Initiating Coverage
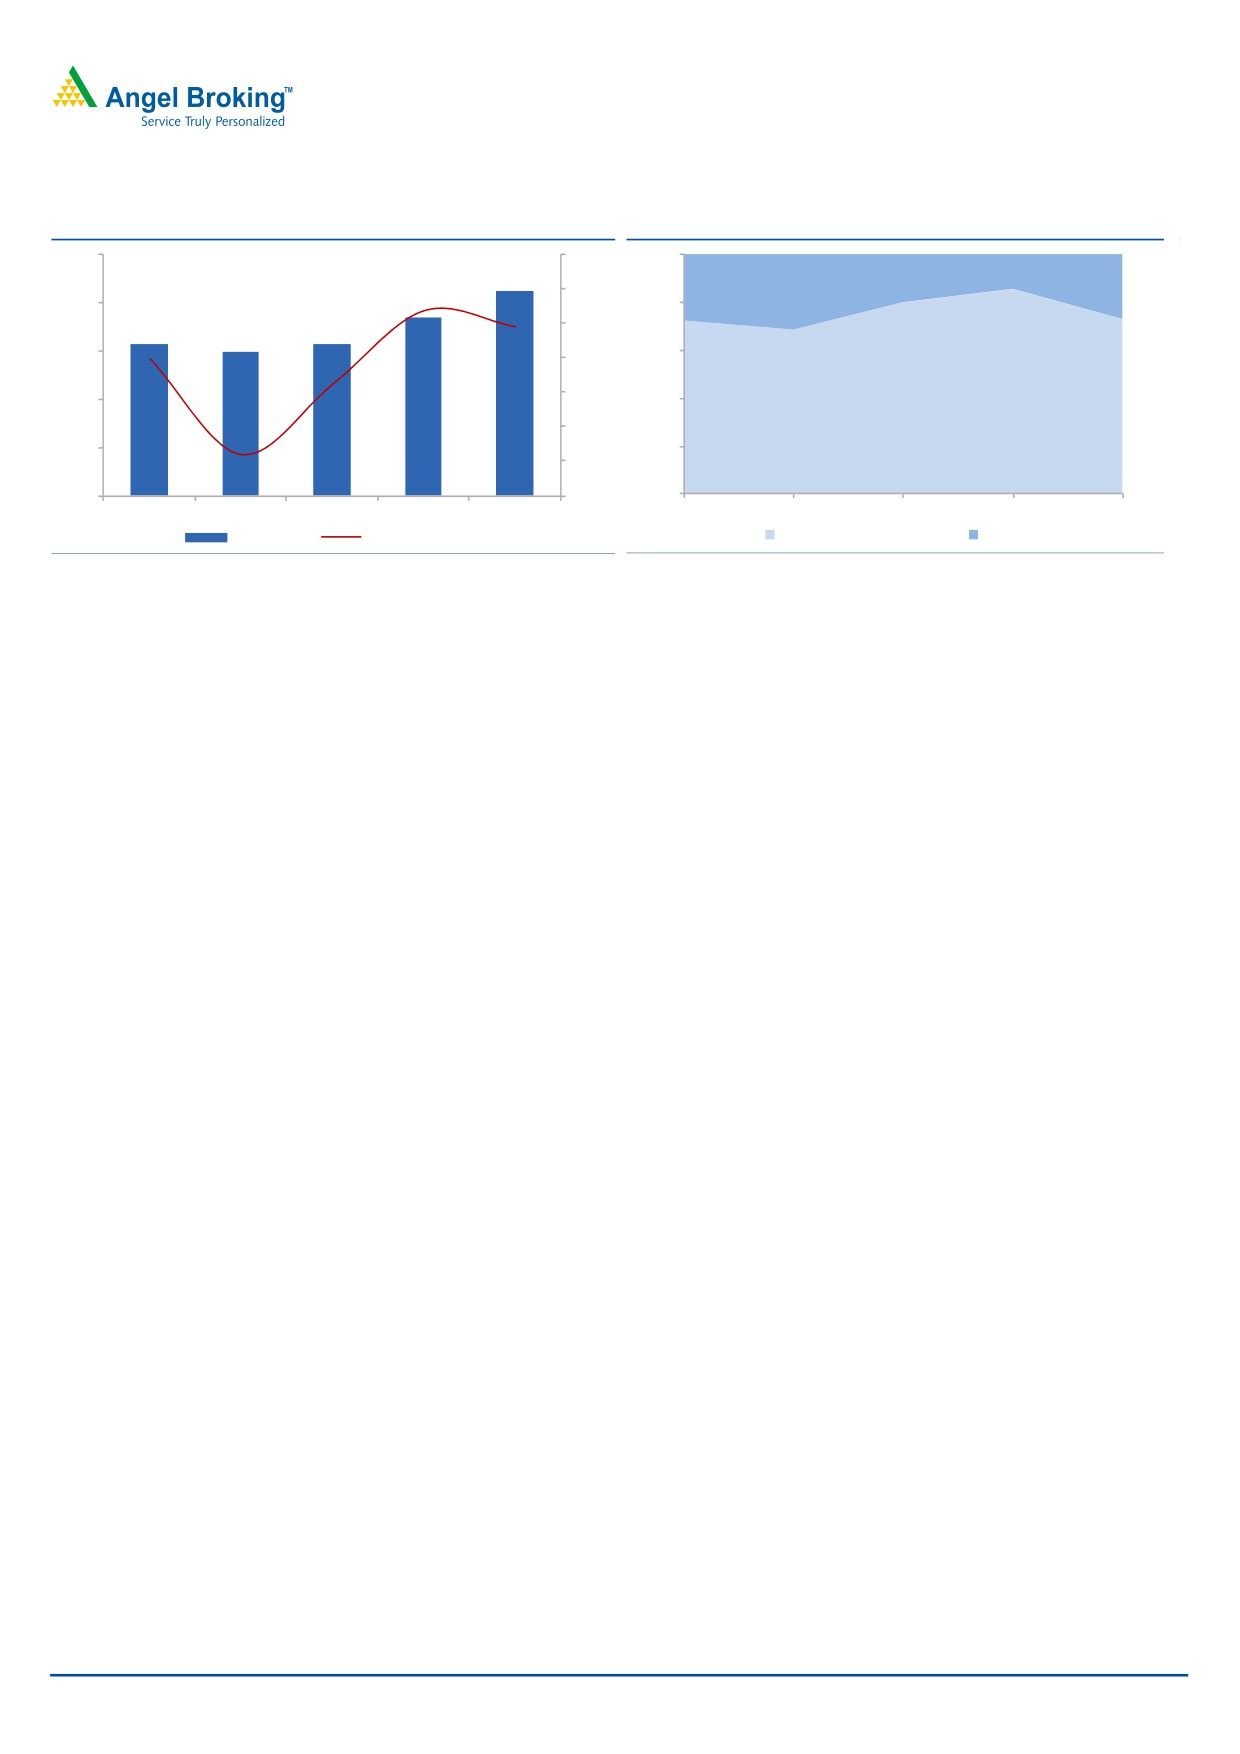
Exhibit 1: Sales growth to rebound
Exhibit 2: Exports to regain prominence
1000
25
100.0
849
14.6
739
20.2
20
27.7
31.4
27.1
800
80.0
626
630
15
596
600
60.0
10
5
72.3
85.4
400
40.0
79.8
68.6
72.9
0
200
20.0
(5)
0
(10)
0.0
FY2012
FY2013
FY2014
FY2015E
FY2016E
FY2012
FY2013
FY2014
FY2015E
FY2016E
Sales (` cr)
Sales growth(%)
Domestic Sales & others (%)
Exports (%)
Source: Company, Angel Research
Source: Company, Angel Research
EBIDTA margin to witness an uptrend
Stability in key raw material prices and
On the operating profitability front, the company’s gross margins have averaged a
higher exports to aid margin expansion
healthy 39.0% during FY2000-10 with EBITDA margin at 16.6%. However after
FY2010, the gross margins along with operating margins came under pressure.
During FY2011-14, the gross margins and operating margins averaged around
34.4% and 6.0%, respectively. While the company is backward integrated and
uses almost
65% of its raw material manufactured indigenously, capacity
constraints internally along with rising input costs and raw material supply
constraints have impacted its gross margins. Along with this, the erratic and
irregular power supply from the electricity board, manpower shortage issues etc.
continue to be causes of concerns for the company. However, the major drain on
the operating margins has been the lower capacity utilization of the Srikakulam
plant due to fire at Block 5. Block 5 is one of the largest blocks in the plant; the
block accounted for around 40% of the total capacity of the plant (FY2013). Thus,
both external and internal factors have constrained the overall profitability of the
company, with the company posting EBITDA margins of a meager 0.7% in
FY2014.
With the company now having resolved its problem at the Srikakulam plant, the
operating margins of the company have moved up to 5.2% in 1HFY2015 V/s 2.1%
in 1HFY2014. The gross margins have stabilized at around 30.6% in 1HFY2015
V/s 25.9% in 1HFY2014.
December 22, 2014
3
Nagarjuna Agrichem | Initiating Coverage
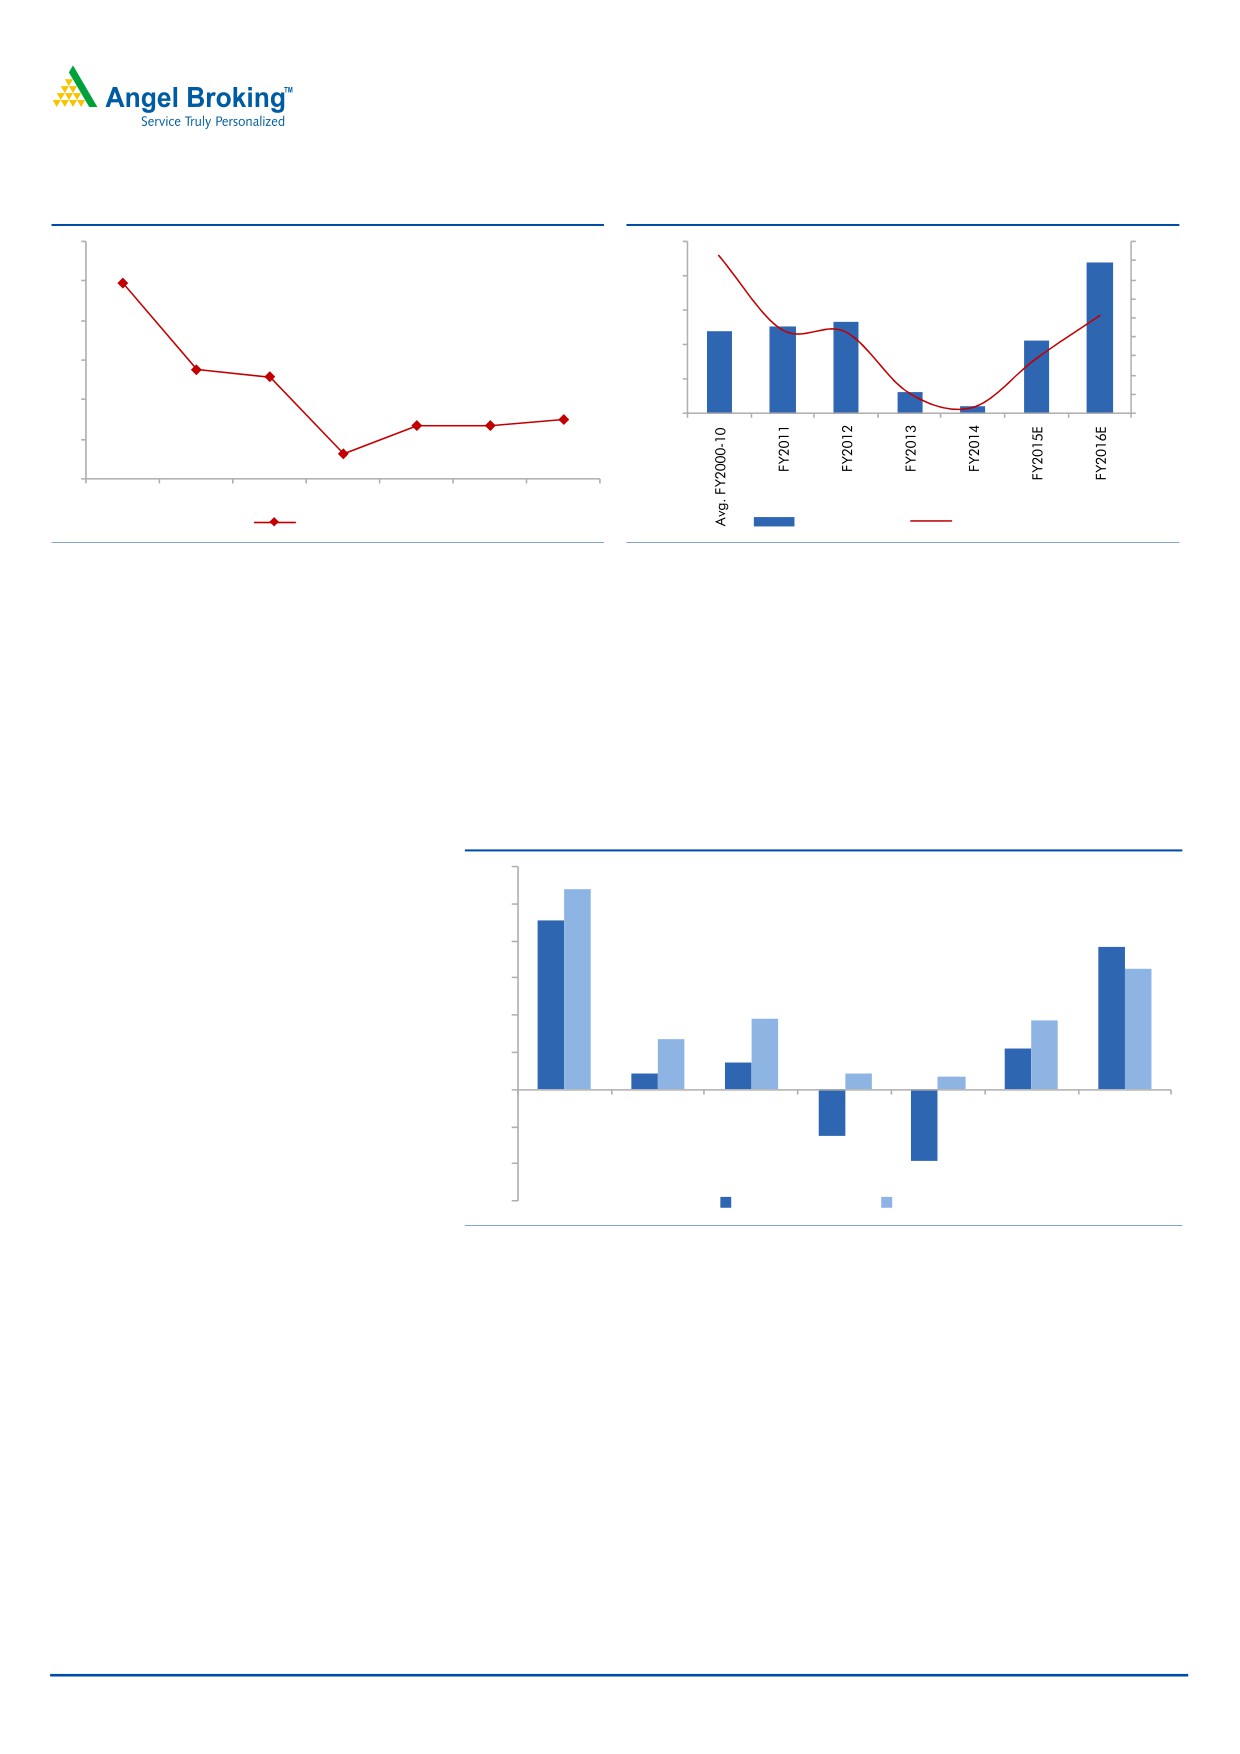
Exhibit 3: Gross Margins to stabilise
Exhibit 4: EBIDTA margins to inch higher
42
100.0
16.6
18.0
39.9
16.0
40
80.0
14.0
10.3
12.0
60.0
8.8
8.6
38
10.0
5.8
8.0
40.0
35.5
6.0
35.2
36
2.1
4.0
20.0
0.7
2.0
34
33.0
32.7
32.7
0.0
0.0
32
31.3
30
Avg.
FY2011
FY2012
FY2013
FY2014
FY2015E FY2016E
FY2000-10
Gross Margins(%)
EBDITA( ` Cr)
EBDITA Margins(%)
Source: Company, Angel Research
Source: Company, Angel Research
Return ratios to improve
With the company having resolved its problem at the Srikakulam capacity, the
overall capacity utilization levels are expected to improve. This will lead to higher
sales, resulting in improved operational profitability and higher ROCE and ROE.
The ROCE is expected to turn positive to 16.2% in FY2016E, while the ROE is
expected to be 19.3% in FY2016E, broadly in line with the industry averages.
Exhibit 5: Return ratios to see recovery
30
26.9
22.8
25
19.3
20
16.2
15
9.3
9.6
10
6.8
5.4
3.6
5
2.2
2.1
1.8
0
Avg.
FY2011
FY2012
FY2013
FY2014
FY2015E FY2016E
(5)
FY2000-10
(6.3)
(10)
(9.6)
(15)
ROE(%)
ROCE(%)
Source: Company, Angel Research
Industry Outlook
Agrochemical Industry- Drivers for growth in place
Domestic Market— Under-penetration to drive growth
The Indian agrochemical sector, with a market size of around ~`13,200cr
(FY2014), has been growing by
~8-10% annually, in comparison to the
3-4% growth rate globally. India is one of the largest consumers of agrochemicals.
The usage of pesticides in India is less than 2% of the global consumption and is
confined to one-fourth of the total arable land of about 180mn hectares. Overall,
India’s consumption of pesticides at around 0.6Kg/ha is lower compared to US
(7Kg/ha) and Japan (12Kg/ha), thus leaving a huge scope for the organized
players to grow.
December 22, 2014
4
Nagarjuna Agrichem | Initiating Coverage
The crop protection market in India is largely dominated by insecticides which
account for 65% of the total crop protection chemicals market. Herbicides are the
largest growing segment and currently account for 16% of the total and rest is
attributed to fungicides. Paddy and cotton are the major consumers of crop
protection chemicals, accounting for
28% and 20% of overall consumption
respectively. In terms of states, the top three - Andhra Pradesh, Maharashtra and
Punjab - account for ~50% of the total pesticide consumption in India.
Challenges in the domestic market include seasonality and higher dependence on
monsoon. As much as 60% to 70% of demand is in the Kharif (June to November)
season and companies have to stock inventories well before. The business is long
on credit and agrochemicals are the last thing farmers buy, well after seeds and
fertilizers and offtake depends on a lot of things, including the weather going right.
Also around 64% of Indian cultivated land is monsoon dependent. In terms of
competition, the industry is highly fragmented at both levels, with around
125 technical producers and more than 800 formulators, serving millions of
farmers through thousands of dealers
/ distributors. The top five players
cumulatively capture only 57% of the total market and no single player among
these has over 20% share.
These factors would continue to keep the profitability, especially of the medium
and small players, in check. Hence, companies with large market shares and the
ones being backward integrated will be able to make most of the opportunity.
Overall, the growing populations, shrinking farmland and scarcity of water would
continue to increase pressure on improving farm productivity. In this respect,
pesticides play an important role in trying to minimise the loss due to insects,
weeds and diseases, given that about 35% to 45% of crop production is lost on this
account. This will continue to drive growth of the Indian agrochemical industry. The
apex industry body Assocham said that the agrochemicals sector in India is likely to
cross the `17,600cr mark by 2017, with it currently growing at a CAGR of about
12%.
Exports- Generic along with Contract Manufacturing lucrative
Exports on the other hand, standing at `16,800cr (FY2014), are expected to post a
CAGR of 10% over the next three years, mainly driven by generics. The global
agrichem industry, valued at ~US$53bn (CY2014E), is dominated by the top six
innovators, viz Bayer, Syngenta, Monsanto, BASF, DuPont and Dow, which enjoy a
large market share of the patented (28%) and off-patent (32%) market. The top six
innovators enjoy a large share of the off-patent market due to high entry barriers
for pure generic players. Thus, one-third of the total pie worth ~US$18bn, which is
controlled by the top six innovators through proprietary off-patent products,
provides a high-growth opportunity for larger integrated generic players.
The market share of generic players increased from 32% levels in 1998 to 40%
levels by 2006-end. The industry registered a CAGR of 3% over 1998-2014, while
generic players outpaced the industry, posting a CAGR of 6%. Going ahead, given
the opportunities and a drop in the rate of new molecule introduction by
innovators, we expect generic players to continue to outpace the industry’s growth
and increase their market share in the overall pie. Historically, global agrichem
players have been logging in-line growth with global GDP. Going ahead, over
December 22, 2014
5
Nagarjuna Agrichem | Initiating Coverage
CY2014-15, the global economy is expected to grow by 3-4%. Assuming this trend
plays out in terms of growth for the agrichem industry and given that the same rate
of genericisation occurs, the agrichemical generic industry could log in 6-8% yoy
growth during the period and garner a market share of 50--55%.
Apart from this, toll manufacturing is also an important segment, mainly in
technicals. Many leading MNCs are getting their technicals manufactured in
countries like India on toll basis in view of the cost advantage that it offers. Tolling
as a business is expected to grow as products come out of the patent protection
periods. India, which is the fourth largest producer of agro-chemicals in the world
after the United States, Japan and China can easily make its mark in the
international generic markets, given its low cost of production.
Financials
Top-line to grow at a CAGR of 16.1% over FY2014-16E
We expect the company’s net sales to grow at a CAGR of
16.1% over
FY2014-16E, from `630cr to `849cr, mainly driven by a bounce back in exports.
The company’s net domestic sale is expected to increase from `477cr in FY2014 to
`609cr by FY2016E, while its exports are expected to increase from `92cr to
`240cr, during the same period. The company’s exports growth during the period
would be driven by the full operation of its Srikakulam plant. Growth in the
domestic markets however would be restricted owing to capacity constraints.
EBIDTA and EBIDTA margins to improve
The EBIDTA and the EBIDTA margins of the company have been under pressure on
back of high input costs and closure of one of the main blocks of its Srikakulam
plant, which constitutes around 40% of its capacity. With the block resuming its
production, the EBDITA margins have bounced back to ~5% levels in 1HFY2015.
With stable raw material cost and capacity utilization improving, the company’s
EBIDTA is expected to grow at a CAGR of 359.1% to `87cr by FY2016E. As a
result, EBIDTA margins are expected to improve from 0.7% in FY2014 to 10.3% in
FY2016E.
PAT to witness a significant improvement over FY2014-16E
With improvement in EBIDTA margins specifically in FY2016E, the PAT is expected
to come in at `39cr in FY2016E from a loss of `18cr in FY2014. As a result, the
PAT margins are expected to improve from 0.8% in FY2011 to 4.5% in FY2016E.
December 22, 2014
6
Nagarjuna Agrichem | Initiating Coverage
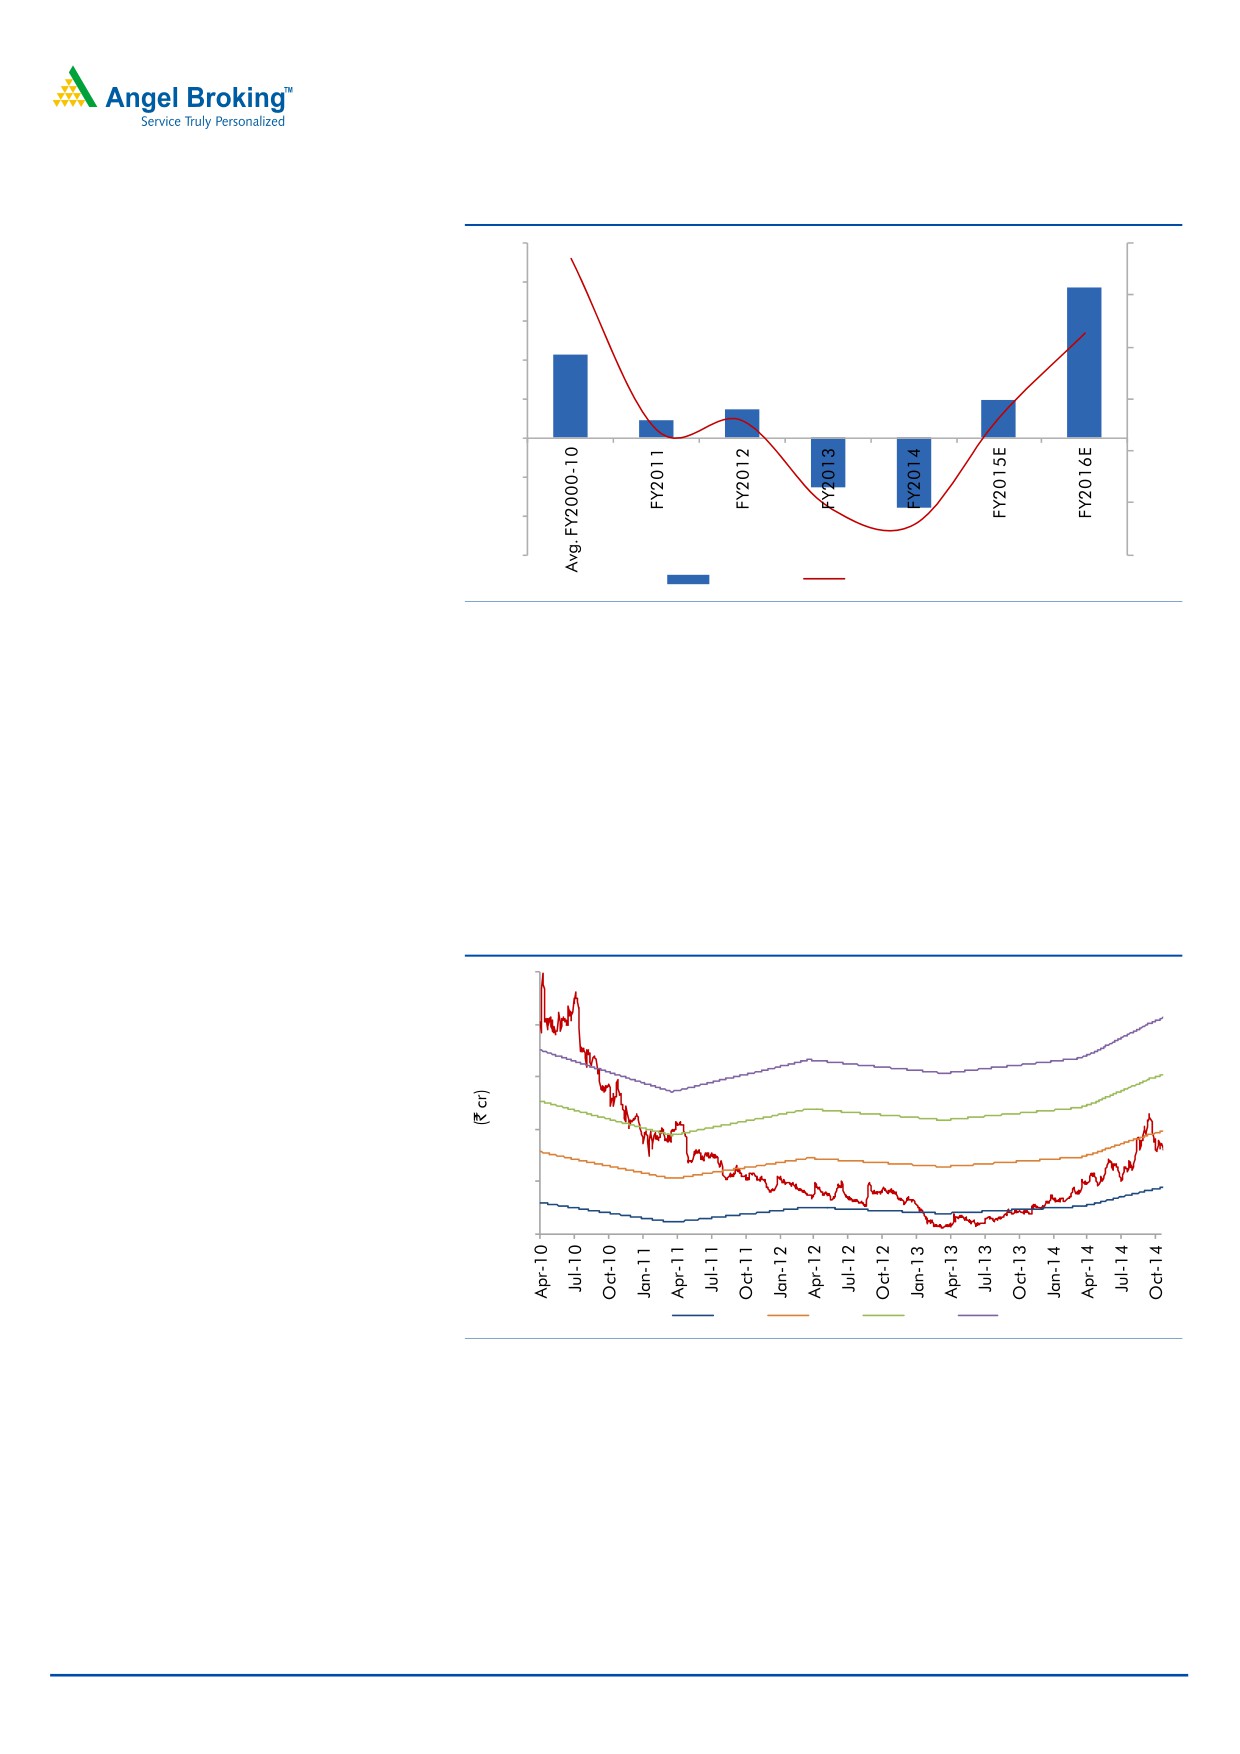
Exhibit 6: PAT and PAT margins to improve
50.0
8.0
7.4
4.5
40.0
6.0
30.0
4.0
20.0
1.2
1.3
10.0
0.8
2.0
0.0
0.0
(10.0)
(2.0)
(20.0)
(2.1)
(2.8)
(30.0)
(4.0)
PAT (` cr)
PAT Margins(%)
Source: Company, Angel Research
Outlook and valuation
We expect net sales and EBIDTA to register a CAGR of 16.1% and 359.1% to
`849cr and `87cr, respectively, over FY2014-16E. As a result, the net profit is
expected to come in at `39cr in FY2014-16E. At the current market price the stock
is trading at a P/E of 5.0x its FY2016E earnings. On account of expected revival in
profitability of the company, we initiate coverage on the stock with a Buy rating
and target price of `18, valuing the stock at ~7x its FY2016E earnings.
Exhibit 7: EV/Sales band
700
600
500
400
300
200
0.4x
0.6x
0.7x
0.9x
Source: Company, Angel Research
Relative valuation
The leading players in the industry are United Phosphorus, Rallis India, and
Insecticides. NACL is trading at cheap valuations of 5.0x P/E and 0.9x P/BV on
FY2016E as compared to its peers which are trading at relatively higher
valuations.
December 22, 2014
7
Nagarjuna Agrichem | Initiating Coverage
Exhibit 8: Comparative analysis
EV/
EV/
Company
Year end
Mcap
Sales
OPM
PAT
EPS
RoE
P/E
P/BV
Sales
EBIDTA
Nagarajuna Agri.
FY2015E
187
739
5.8
10
0.6
5.4
20.0
1.1
0.6
10.3
FY2016E
187
849
10.3
39
2.5
19.3
5.0
0.9
0.6
5.5
UPL
FY2015E
13,788
11,850
17.3
1,282
29.9
22.2
10.8
2.0
1.3
7.4
FY2016E
13,788
13,627
17.3
1,515
35.3
21.7
9.1
1.7
1.1
6.1
Rallis
FY2015E
4,062
2,020
13.9
176
9.0
22.6
23.3
4.9
2.0
14.7
FY2016E
4,062
2,365
13.9
204
10.5
22.3
19.9
4.1
1.7
12.4
Source: Company, Angel Research,
Key concerns
Growth challenge in exports: In FY2010, NACL derived 35% of its revenues
from exports, which came down to 27% in FY2011, also on back of the lower
demand from its toll manufacturing business. These exports primarily constitute the
contract manufacturing job that the company does for the MNC players. Hence
any drop in demand of final products of these MNCs will negatively impact the
company’s performance.
Vagaries of monsoon: Most of the agricultural production in India is rain fed
and hence highly dependent on monsoons. Hence, vagaries in monsoon could
affect the demand for agrichemicals and in turn impact the company.
Company Background
NACL is one of the largest pesticide agrichemical companies in the country with a
market share of ~4% and belongs to the Nagarjuna Group of Hyderabad. The
company also has a credible presence in the international market. NACL
manufactures a comprehensive range of pesticide technicals, formulations and
custom manufactured fine chemicals. Pesticides account for 95% of the company's
total revenues. Historically, the domestic business has been contributing around
70% of the company’s overall revenues, while exports accounted for the balance.
However, in the recent past, decline in exports has lead to its contribution coming
down to 20% in FY2014. NACL has three plants situated at Srikakulam, Ethakota
and Shadnagar in Andhra Pradesh.
December 22, 2014
8
Nagarjuna Agrichem | Initiating Coverage
Profit and Loss
Y/E March (` Cr)
FY11
FY12
FY13
FY14E
FY15E
FY16E
Net Sales
554
626
596
630
739
849
Other operating income
16
17
22
25
25
25
Total operating income
570
643
617
655
764
874
% chg
(11.9)
12.8
(4.0)
6.1
16.7
14.4
Total Expenditure
517
572
583
625
696
762
Net Raw Materials
368
406
409
424
497
569
Other Mfg costs
45
52
53
57
61
51
Personnel
40
35
40
43
35
40
Other
64
80
80
101
103
102
EBITDA
38
54
13
4
43
87
% chg
(68.8)
43.2
(76.2)
(67.6)
931.8
104.2
(% of Net Sales)
6.8
8.6
2.1
0.7
5.8
10.3
Depreciation& Amortisation
23
27
25
22
26
30
EBIT
30
44
9
8
42
83
% chg
(70.0)
45.0
(79.1)
(17.3)
451.8
98.7
(% of Net Sales)
5.3
6.8
1.5
1.2
5.5
9.5
Interest & other Charges
26
33
31
28
31
36
Other Income
5
4
2
1
1
1
(% of PBT)
56
27
(8)
(3)
5
1
Recurring PBT
9
14
(20)
(20)
11
47
% chg
(90.0)
51.5
-
-
-
324.5
Extraordinary (Expense )/Inc.
(3)
(0)
(0)
(3)
-
-
PBT (reported)
6
14
(20)
(23)
11
47
Tax
3
7
-
-
2
9
(% of PBT)
52.1
48.7
36.5
9.3
20.0
20.0
PAT (reported)
3
7
(13)
(21)
9
38
Add: Share of earnings of asso.
-
-
-
1
1
1
Less: Minority interest (MI)
-
-
-
-
-
-
Prior period items
-
-
-
-
-
-
PAT after MI (reported)
3
7
(13)
(21)
10
39
ADJ. PAT
5
7
(13)
(18)
10
39
% chg
(92.0)
61.5
298.3
(% of Net Sales)
0.8
1.2
(2.1)
(2.8)
1.3
4.5
Basic EPS (`)
0.3
0.5
(0.8)
(1.1)
0.6
2.5
Fully Diluted EPS (`)
0.3
0.5
(0.8)
(1.1)
0.6
2.5
% chg
(92.0)
61.5
298.3
December 22, 2014
9
Nagarjuna Agrichem | Initiating Coverage
Balance Sheet
Y/E March (` Cr)
FY11
FY12
FY13
FY14E FY15E FY16E
SOURCES OF FUNDS
Equity Share Capital
15
15
15
16
16
16
Preference Capital
-
-
-
-
-
-
Reserves& Surplus
188
192
180
159
166
202
Shareholders Funds
203
207
195
174
182
218
Minority Interest
-
-
-
-
-
-
Total Loans
204
220
177
219
260
300
Other Long term liabilities
11
11
10
12
12
12
Long Term Provisions
0
1
1
1
1
1
Deferred Tax Liability
25
29
22
19
19
19
Total Liabilities
443
467
405
426
474
550
APPLICATION OF FUNDS
Gross Block
324
334
325
353
403
453
Less: Acc. Depreciation
117
144
154
172
198
228
Net Block
207
190
171
181
205
225
Capital Work-in-Progress
7
16
11
18
18
18
Goodwill / Intangilbles
1
1
1
1
1
1
Investments
0
4
4
9
9
9
Long Term Loan & Adv.
12
17
14
12
17
19
Current Assets
325
403
400
399
452
540
Cash
23
25
22
17
4
6
Loans & Advances
19
19
41
46
54
80
Other
283
359
337
336
395
454
Current liabilities
109
164
195
195
229
263
Net Current Assets
216
239
204
204
224
277
Others
-
-
-
-
-
-
Total Assets
443
467
405
426
474
550
December 22, 2014
10
Nagarjuna Agrichem | Initiating Coverage
Cash flow statement
Y/E March (` Cr)
FY11
FY12
FY13
FY14E
FY15E
FY16E
Profit before tax
6
14
(20)
(23)
11
47
Depreciation
23
27
25
22
26
30
Change in Working Capital
20
(26)
35
(4)
(37)
(54)
Less: Other income
(5)
(4)
(2)
(1)
(1)
(1)
Direct taxes paid
(3)
(7)
7
2
(2)
(9)
Cash Flow from Operations
41
4
46
(4)
(2)
13
(Inc.)/ Dec. in Fixed Assets
(54)
11
15
(35)
(50)
(50)
(Inc.)/ Dec. in Investments
-
(4)
-
-
-
-
Inc./ (Dec.) in loans and adv.
-
-
-
-
-
-
Other income
(5)
(4)
(2)
(1)
(1)
(1)
Cash Flow from Investing
(49)
12
16
(34)
(49)
(49)
Issue of Equity
-
-
-
1
-
-
Inc./(Dec.) in loans
30
24
43
(44)
(41)
(40)
Dividend Paid (Incl. Tax)
(7)
(2)
-
-
(2)
(2)
Others
(14)
(26)
(106)
76
82
81
Cash Flow from Financing
9
(4)
(63)
33
39
39
Inc./(Dec.) in Cash
1
12
(3)
(5)
(13)
2
Opening Cash balances
22
13
25
22
17
4
Closing Cash balances
23
25
22
17
4
6
December 22, 2014
11
Nagarjuna Agrichem | Initiating Coverage
Key Ratios
Y/E March
FY11
FY12
FY13
FY14E
FY15E
FY16E
Valuation Ratio (x)
P/E (on FDEPS)
40.6
25.1
-
-
20.0
5.0
P/CEPS
3.6
3.0
4.9
7.4
3.1
2.0
P/BV
0.9
0.9
0.9
1.1
1.1
0.9
Dividend yield (%)
3.6
1.1
-
-
1.2
1.2
EV/Sales
0.7
0.6
0.6
0.6
0.6
0.6
EV/EBITDA
9.9
7.1
26.9
92.9
10.3
5.5
EV / Total Assets
0.8
0.8
0.8
0.9
0.9
0.9
Per Share Data (`)
EPS (Basic)
0.3
0.5
(0.8)
(1.1)
0.6
2.5
EPS (fully diluted)
0.3
0.5
(0.8)
(1.1)
0.6
2.5
Cash EPS
3.4
4.1
2.5
1.7
4.0
6.3
DPS
0.4
0.1
-
-
0.1
0.1
Book Value
13.6
13.9
13.1
11.2
11.7
14.0
Dupont Analysis
EBIT margin
5.3
6.8
1.5
1.2
5.5
9.5
Tax retention ratio
47.9
51.3
63.5
90.7
80.0
80.0
Asset turnover (x)
0.3
1.4
1.5
1.6
1.7
1.7
ROIC (Post-tax)
0.8
5.0
1.4
1.7
7.5
12.9
Cost of Debt (Post Tax)
0.9
8.1
9.8
12.8
10.4
10.4
Leverage (x)
0.9
0.9
0.9
1.0
1.3
1.4
Operating ROE
0.7
2.2
(6.0)
(9.2)
3.8
16.4
Returns (%)
ROCE (Pre-tax)
6.8
9.6
2.1
1.8
9.3
16.2
Angel ROIC (Pre-tax)
7.2
10.2
2.2
1.9
9.7
16.6
ROE
2.2
3.6
(6.3)
(9.6)
5.4
19.3
Turnover ratios (x)
Asset Turnover (Gross Block)
1.8
2.0
1.9
1.9
2.0
2.0
Inventory / Sales (days)
93
88
100
97
90
91
Receivables (days)
88
94
106
90
83
85
Payables (days)
76
86
98
89
86
92
WC cycle (ex-cash) (days)
127
125
121
107
100
105
Solvency ratios (x)
Net debt to equity
0.9
0.9
0.9
1.0
1.3
1.4
Net debt to EBITDA
4.8
4.2
7.9
30.4
27.4
4.7
Interest Coverage (EBIT / Int.)
1.2
1.3
0.3
0.3
1.3
2.3
December 22, 2014
12
Nagarjuna Agrichem | Initiating Coverage
Research Team Tel: 022 - 39357800
DISCLAIMER
This document is solely for the personal information of the recipient, and must not be singularly used as the basis of any investment
decision. Nothing in this document should be construed as investment or financial advice. Each recipient of this document should make
such investigations as they deem necessary to arrive at an independent evaluation of an investment in the securities of the companies
referred to in this document (including the merits and risks involved), and should consult their own advisors to determine the merits and
risks of such an investment.
Angel Broking Limited, its affiliates, directors, its proprietary trading and investment businesses may, from time to time, make
investment decisions that are inconsistent with or contradictory to the recommendations expressed herein. The views contained in this
document are those of the analyst, and the company may or may not subscribe to all the views expressed within.
Reports based on technical and derivative analysis center on studying charts of a stock's price movement, outstanding positions and
trading volume, as opposed to focusing on a company's fundamentals and, as such, may not match with a report on a company's
fundamentals.
The information in this document has been printed on the basis of publicly available information, internal data and other reliable
sources believed to be true, but we do not represent that it is accurate or complete and it should not be relied on as such, as this
document is for general guidance only. Angel Broking Limited or any of its affiliates/ group companies shall not be in any way
responsible for any loss or damage that may arise to any person from any inadvertent error in the information contained in this report.
Angel Broking Limited has not independently verified all the information contained within this document. Accordingly, we cannot testify,
nor make any representation or warranty, express or implied, to the accuracy, contents or data contained within this document. While
Angel Broking Limited endeavours to update on a reasonable basis the information discussed in this material, there may be regulatory,
compliance, or other reasons that prevent us from doing so.
This document is being supplied to you solely for your information, and its contents, information or data may not be reproduced,
redistributed or passed on, directly or indirectly.
Angel Broking Limited and its affiliates may seek to provide or have engaged in providing corporate finance, investment banking or
other advisory services in a merger or specific transaction to the companies referred to in this report, as on the date of this report or in
the past.
Neither Angel Broking Limited, nor its directors, employees or affiliates shall be liable for any loss or damage that may arise from or in
connection with the use of this information.
Note: Please refer to the important 'Stock Holding Disclosure' report on the Angel website (Research Section). Also, please
refer to the latest update on respective stocks for the disclosure status in respect of those stocks. Angel Broking Limited and
its affiliates may have investment positions in the stocks recommended in this report.
Disclosure of Interest Statement
Nagarjuna Agrichem
1. Analyst ownership of the stock
No
2. Angel and its Group companies ownership of the stock
No
3. Angel and its Group companies' Directors ownership of the stock
No
4. Broking relationship with company covered
No
Note: We have not considered any Exposure below ` 1 lakh for Angel, its Group companies and Directors.
Ratings (Returns):
Buy (> 15%)
Accumulate (5% to 15%)
Neutral (-5 to 5%)
Reduce (-5% to 15%)
Sell (< -15%)
December 22, 2014
13
Nagarjuna Agrichem | Initiating Coverage
6th Floor, Ackruti Star, Central Road, MIDC, Andheri (E), Mumbai- 400 093. Tel: (022) 39357800
Research Team
Fundamental:
Sarabjit Kour Nangra
VP-Research, Pharmaceutical
Vaibhav Agrawal
VP-Research (Banking)
Amarjeet Maurya
Analyst (FMCG, Media, Mid-Cap)
Bharat Gianani
Analyst (Automobile)
Shrenik Gujrathi
Analyst (Cap Goods, Cement)
Umesh Matkar
Analyst (Banking)
Twinkle Gosar
Analyst (Mid-Cap)
Tejas Vahalia
Research Editor
Technicals and Derivatives:
Siddarth Bhamre
Head - Technical & Derivatives
Sameet Chavan
Technical Analyst
Sneha Seth
Associate (Derivatives)
Institutional Sales Team:
Mayuresh Joshi
VP - Institutional Sales
Meenakshi Chavan
Dealer
Gaurang Tisani
Assistant Manager
Production Team:
Dilip Patel
Production Incharge
CSO & Registered Office: G-1, Ackruti Trade Centre, Road No. 7, MIDC, Andheri (E), Mumbai - 93. Tel: (022) 3083 7700. Angel Broking Pvt. Ltd: BSE Cash: INB010996539 / BSE F&O: INF010996539, CDSL Regn. No.: IN - DP - CDSL - 234 - 2004, PMS Regn. Code: PM/INP000001546, NSE Cash: INB231279838 /
NSE F&O: INF231279838 / NSE Currency: INE231279838, MCX Stock Exchange Ltd: INE261279838 / Member ID: 10500. Angel Commodities Broking (P) Ltd.: MCX Member ID: 12685 / FMC Regn. No.: MCX / TCM / CORP / 0037 NCDEX: Member ID 00220 / FMC Regn. No.: NCDEX / TCM / CORP / 0302.
December 22, 2014
14