1QFY2012 Result Update | Education
July 22, 2011
NIIT
BUY
CMP
`56
Performance Highlights
Target Price
`69
(` cr)
1QFY12 4QFY10
% chg (qoq) 1QFY11
% chg (yoy)
Investment Period
12 Months
Net revenue
321.2
323.8
(0.8)
278.0
15.5
EBITDA
30.7
40.4
(23.9)
28.7
7.1
Stock Info
EBITDA margin (%)
9.6
12.5
(290)bp
10.3
(75)bp
Sector
Education
PAT
13.1
37.7
(65.1)
13.0
1.1
Market Cap (` cr)
922
Source: Company, Angel Research
Beta
0.8
52 Week High / Low
75/43
For 1QFY2012, NIIT reported a decent performance, which was in-line with our
expectations. Revenue growth was driven by all businesses, but operational
Avg. Daily Volume
147606
performance was dented due to the SLS business, which posted a 472bp yoy dip
Face Value (`)
2
in EBITDA margin. We have valued NIIT on an SOTP basis, arriving at a target
BSE Sensex
18,722
EV/EBITDA of 4.3x on FY2013E consolidated EBITDA of `214.4cr, and have
Nifty
5,634
added the company’s stake in NIIT Technologies (with a holding discount of
Reuters Code
NIIT.BO
25%). We maintain Buy on the stock.
Bloomberg Code
NIIT@IN
Quarterly highlights: Consolidated revenue came in at `321cr, up 15.5% yoy.
Revenue from ILS, SLS and CLS businesses increased by 15.7%, 5.0% and 18.4%
Shareholding Pattern (%)
yoy to `177.8cr, `40.3cr and `163.0cr, respectively. Blended EBITDA margin
Promoters
34.0
declined by 75bp yoy to 10.3% due to a 162bp and 472bp yoy margin decline in
MF / Banks / Indian Fls
10.4
ILS and SLS businesses to 9.6% and 12.2%, respectively. However, the CLS
FII / NRIs / OCBs
28.4
segment posted a 102bp yoy increase in its EBITDA margin to 8.9%.
Indian Public / Others
27.3
Outlook and valuation: The hiring environment in the Indian IT sector is
strengthening, as indicated by Indian IT players such as Infosys and TCS aiming
to collectively hire ~1,05,000 people in FY2012. Thus, we expect ILS to record
Abs. (%)
3m 1yr 3yr
strong growth of
16% yoy in FY2012, with strengthening of the hiring
Sensex
(4.5)
3.4
32.7
environment expected to result in demand for vocational courses. With developed
NIIT Ltd.
(1.6)
(18.3)
(39.5)
economies such as the US returning to growth, we expect discretionary spend
related to training outsourcing, learning products and managed training services
to turn robust and expect 7% yoy growth in the CLS business. At the CMP, the
stock is trading at EV/EBITDA of 4.0x FY2013E EBITDA, but the stake in NIIT
Technologies provides for a strong upside. Hence, we maintain Buy on the stock
with a target price of `69.
Key financials (Consolidated)
Y/E March (` cr)
FY2009 FY2010
FY2011
FY2012E
FY2013E
Net sales
1149
1199
1248
1415
1556
% chg
14.1
4.4
4.1
13.3
10.0
Net profit
70
70
92
92
114
% chg
(7.7)
0.6
31.2
0.0
23.7
EBITDA margin (%)
10.3
13.1
12.8
13.1
13.8
EPS (`)
4.2
4.3
5.6
5.6
6.9
Srishti Anand
P/E (x)
13.2
13.1
10.0
10.0
8.1
022-3935 7800 Ext: 6820
P/BV (x)
1.9
1.8
1.7
1.5
1.3
RoE (%)
14.6
13.9
16.5
15.0
16.6
RoCE (%)
6.5
9.0
8.0
10.1
12.4
Ankita Somani
EV/Sales (x)
0.9
0.9
0.9
0.7
0.6
022-3935 7800 Ext: 6819
EV/EBITDA (x)
9.1
7.2
6.7
5.5
4.0
Source: Company, Angel Research
Please refer to important disclosures at the end of this report
1
NIIT | 1QFY2012 Result Update
Exhibit 1: 1QFY2012 performance
(` cr)
1QFY12
4QFY11
% chg (qoq) 1QFY11
% chg (yoy) FY2011 FY2010
% chg (yoy)
Net revenue
321.2
323.8
(0.8)
278.0
15.5
1,248.2
1,199.3
4.1
Operating expenses
290.4
283.4
2.5
249.3
16.5
1,089.0
1,042.6
4.5
EBITDA
30.7
40.4
(23.9)
28.7
7.1
159.2
156.7
1.6
Depreciation
22.7
21.4
6.1
20.3
11.8
85.5
75.1
13.8
EBIT
8.0
19.0
(57.7)
8.4
(4.3)
73.7
81.6
(9.7)
Other income
(6.4)
7.5
(7.4)
(18.1)
(32.9)
PBT
1.6
26.5
(93.8)
1.0
64.0
55.6
48.7
14.2
Income tax
(1.3)
2.6
(150.0)
(1.5)
(13.3)
8.9
10.8
(17.6)
PAT
2.9
23.9
(87.7)
2.5
17.6
46.7
37.9
23.2
Share of associates' net profit
10.2
13.8
10.5
45.3
32.2
Adj. PAT
13.1
37.7
(65.1)
13.0
1.1
92.0
70.1
31.2
EPS (`)
0.8
2.3
(65.1)
0.8
1.1
5.6
4.3
31.2
EBITDA margin (%)
9.6
12.5
(290)bp
10.3
(75)bp
12.8
13.1
(31)bp
EBIT margin (%)
2.5
5.9
(336)bp
3.0
(52)bp
5.9
6.8
(90)bp
PAT margin (%)
4.2
11.4
(720)bp
4.8
(63)bp
7.5
6.0
147bp
Source: Company, Angel Research
Modest revenue growth but margin declines
For 1QFY2012, NIIT reported revenue of `321.2cr (vs. our expectation of `305cr),
up 15.5% yoy. Corporate learning solutions (CLS) business emerged as the
primary growth driver for the company and reported 18.4% yoy growth in revenue,
which led to a 130bp yoy increase in its revenue share in NIIT’s overall revenue to
50.8%. Revenue from individual learning solution (ILS) and school learning
solutions (SLS) businesses grew by 15.7% and 5.0% yoy, respectively.
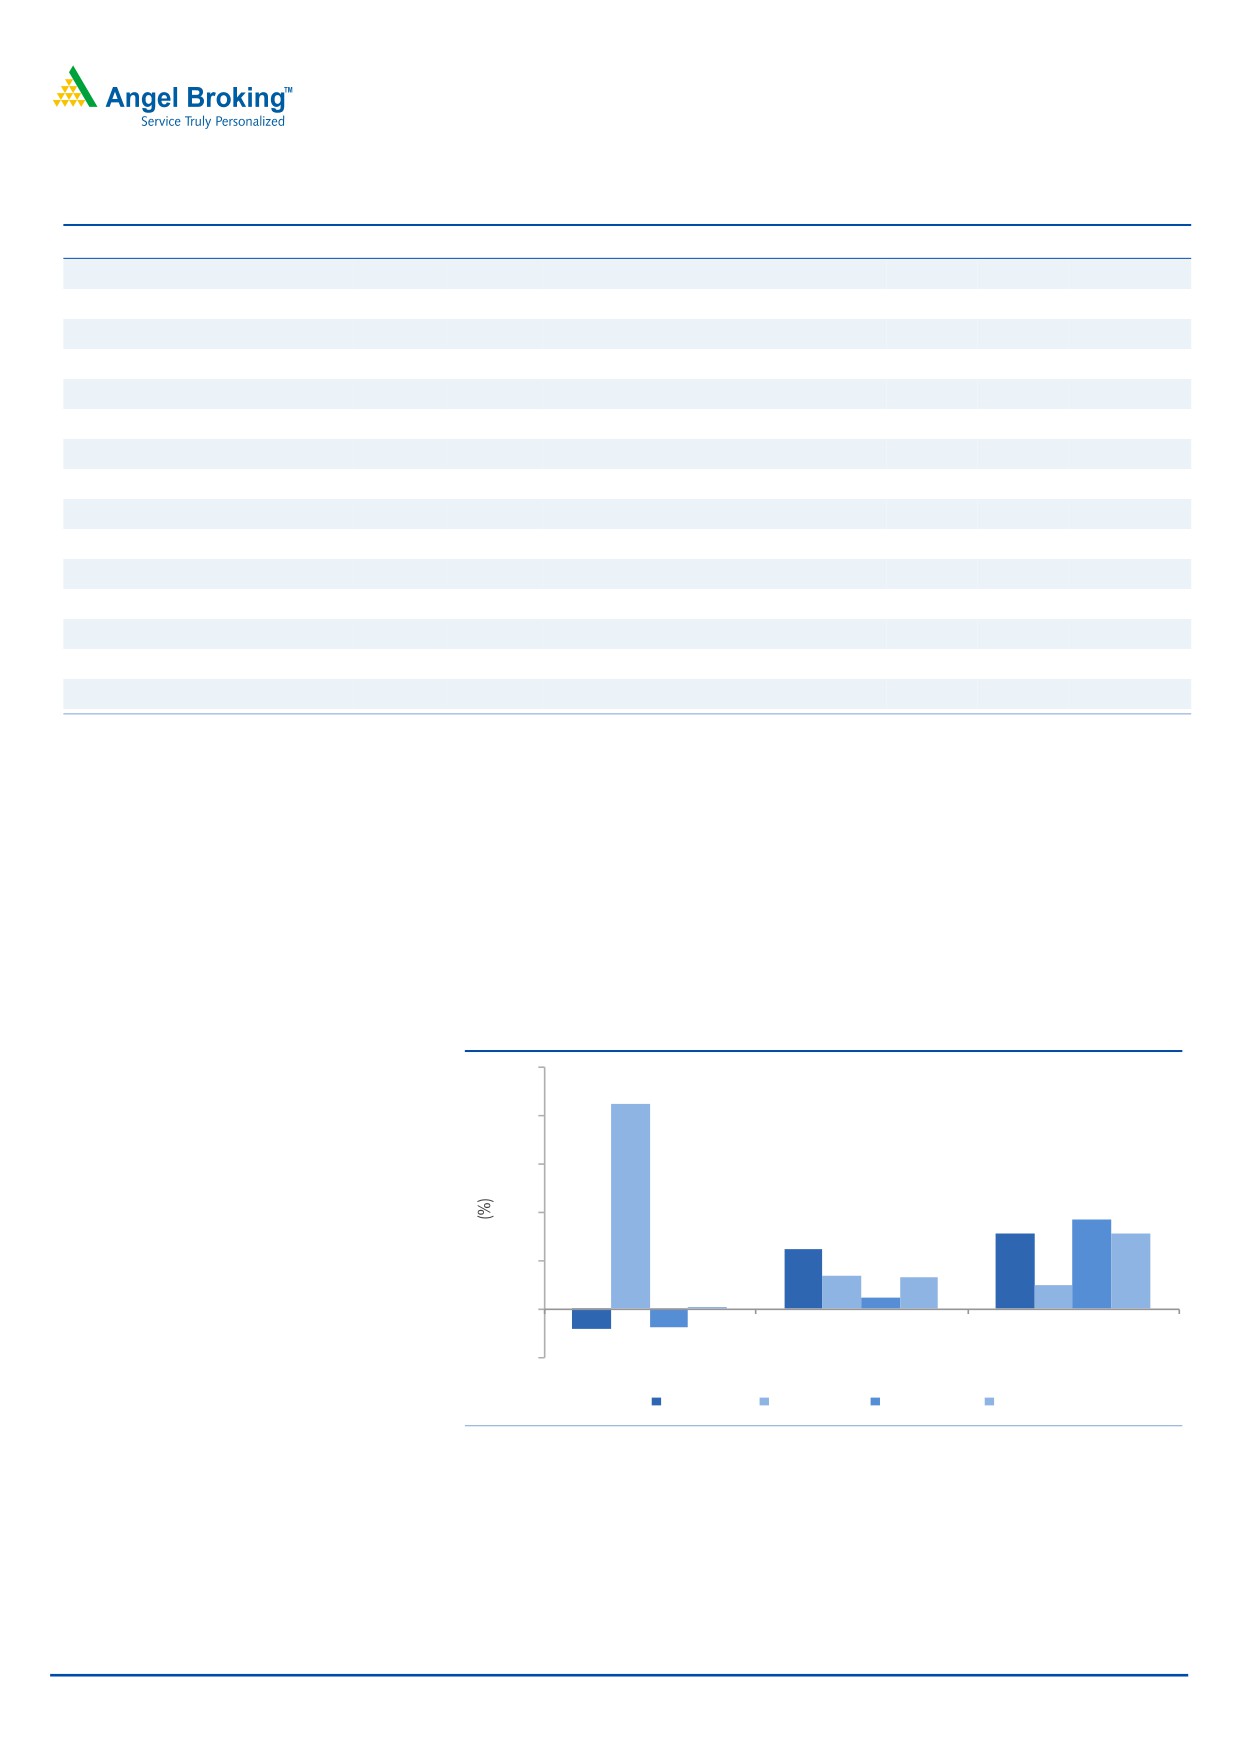
Exhibit 2: Revenue growth (Segment wise, yoy)
50
42.5
40
30
18.4
20
15.5
15.7
12.4
10
7.0
6.5
5.0
2.4
0.5
0
(4.0)
(3.9)
(10)
AMJ09
AMJ10
AMJ11
ILS
SLS
CLS
Consolidated
Source: Company, Angel Research
July 22, 2011
2
NIIT | 1QFY2012 Result Update
Exhibit 3: Revenue mix (Segment wise)
120
100
80
51.5
49.5
50.8
60
13.8
12.6
40
13.8
20
34.7
36.6
36.7
0
AMJ09
AMJ10
AMJ11
ILS
SLS
CLS
Source: Company, Angel Research
Exhibit 4: Revenue performance (Segment wise)
(` cr)
AMJ 11 AMJ 10 JFM 11
% chg (yoy)
% chg (qoq)
ILS
117.8
101.8
133.8
15.7
(11.9)
SLS
40.3
38.4
37.4
5.0
7.8
CLS
163.0
137.7
152.6
18.4
6.8
Source: Company, Angel Research
ILS: For 1QFY2012, revenue of the ILS business grew by 15.7% yoy to `177.8cr,
with global enrollments growing by 11% yoy to 1,40,455; career IT enrollments
increasing by 19% yoy; and strong surge witnessed in banking enrollments.
Also, placements continued to be robust, especially for the IT and banking sectors,
posting combined growth of 28% yoy. The pending order book of this segment
currently stands at
`138.4cr, with
70% of it being executable in the next
12 months. Also, cloud campus (new initiative by NIIT) was implemented in over
50 centres. EBITDA margin of the segment declined by 162bp yoy to 9.6% during
the quarter.
July 22, 2011
3
NIIT | 1QFY2012 Result Update
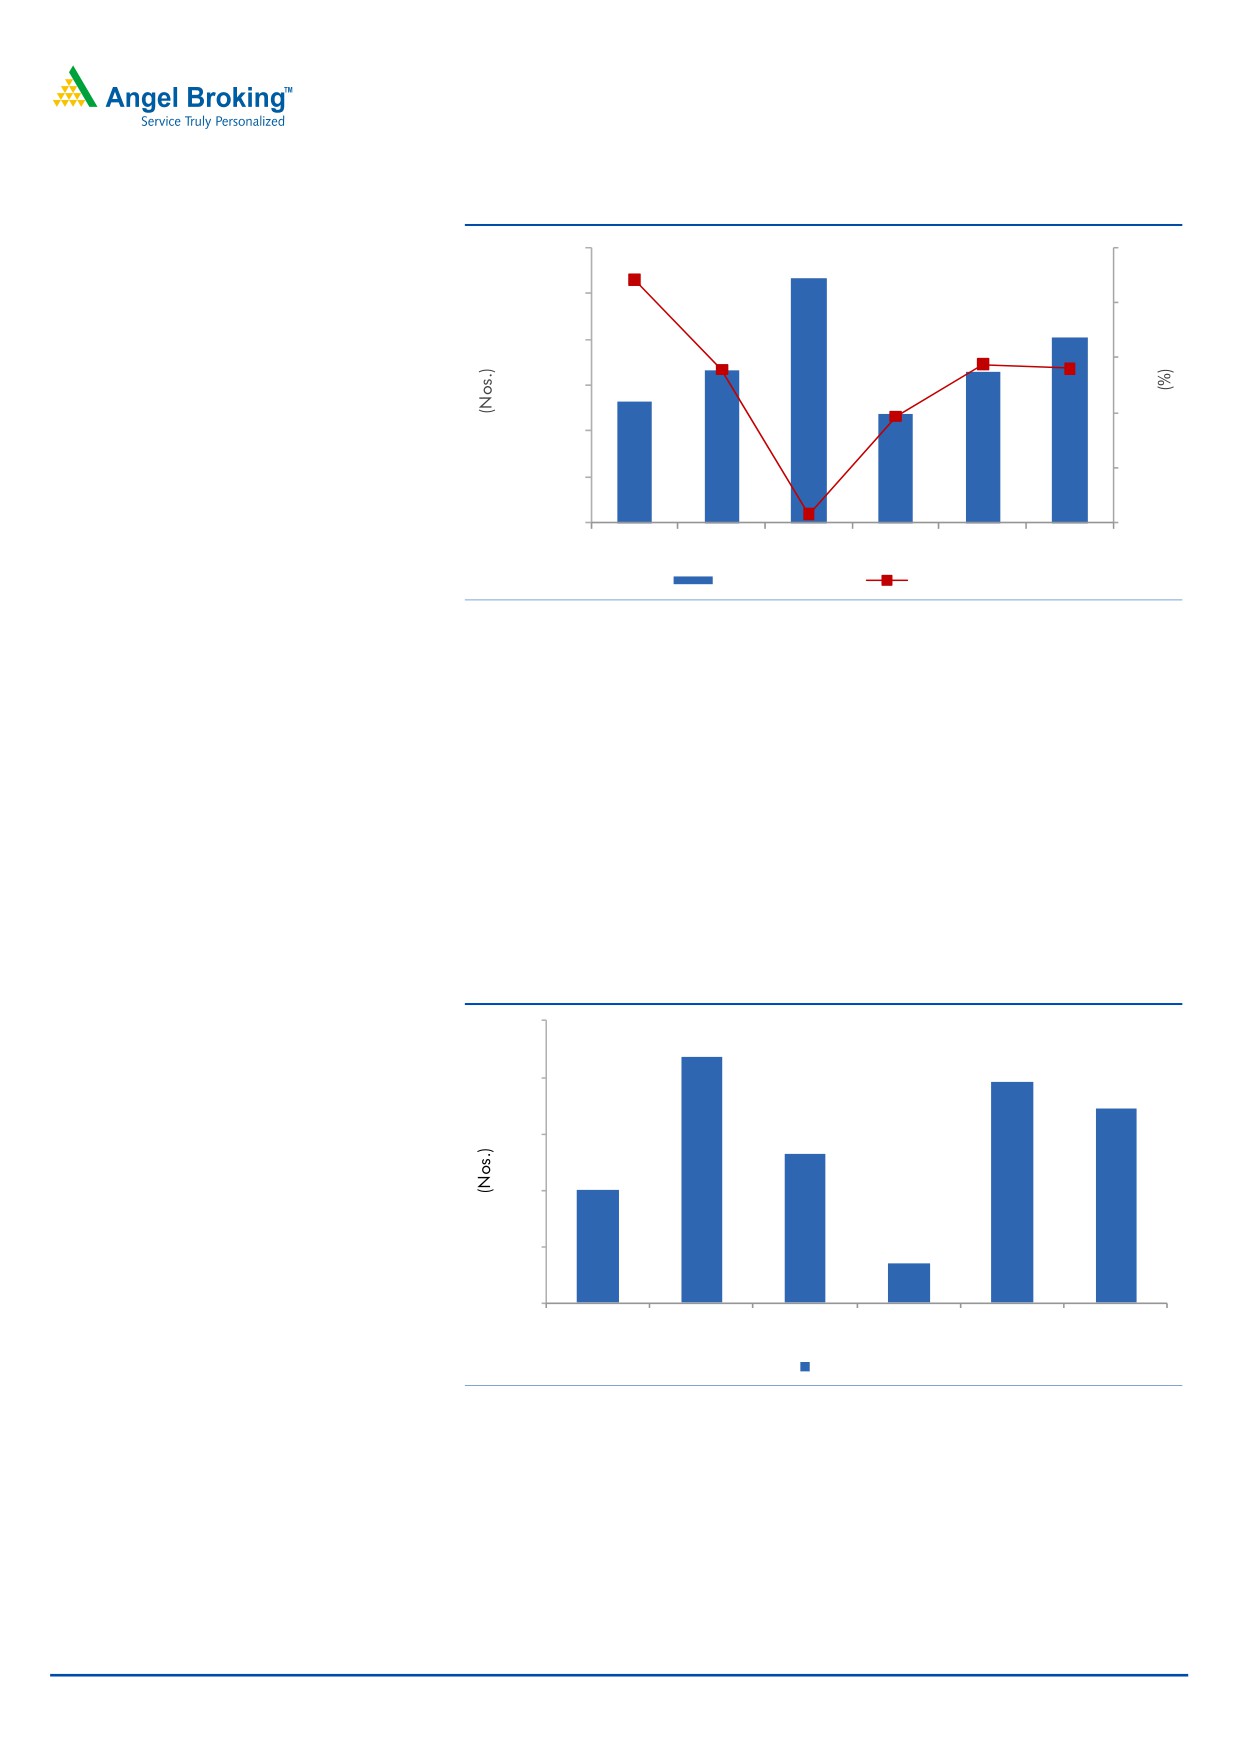
Exhibit 5: ILS - Enrolment growth
180,000
20
17.7
160,000
16
140,000
11.5
11.2
12
11.1
120,000
7.7
8
100,000
4
80,000
0.6
60,000
0
JFM10
AMJ10
JAS 10
OND 10
JFM 11
AMJ11
Enrollment
yoy growth (%)
Source: Company, Angel Research
SLS: Revenue of the SLS business grew by 5.0% yoy to `40.3 in 1QFY2012. During
the quarter, the company added 173 private schools with order intake of `97.6cr.
Revenue from non-government schools grew by 24% yoy and now contribute 41%
to the total SLS revenue. The pending order book of this segment stands at
`497.5cr, with 30% being executable in the next 12 months.
For 1QFY2012, EBITDA margin of the business declined ferociously by 472bp yoy
to 12.2% due to reorganisation going on in this segment as well as the company
gearing up for strategies adopted earlier. Management has indicated that the
margin of this business will witness an uptick in the coming quarters.
Exhibit 6: Trend in private school addition in the SLS segment
250
218
196
200
173
150
132
101
100
50
35
0
JFM10
AMJ10
JAS 10
OND 10
JFM 11
AMJ 11
Private schools
Source: Company, Angel Research
CLS: Revenue of the CLS business grew by 18.4% yoy to `163.0cr on the back of
robust volume growth of 21.0% yoy, driven by growth in managed training
services (56% yoy) and online learning products (22% yoy). Order intake for the
quarter stood at US$25.4mn, with the pending order book standing at
US$87.0mn, of which 61% is executable over the next 12 months.
July 22, 2011
4
NIIT | 1QFY2012 Result Update
EBITDA margin of this segment increased by 102bp yoy to 8.9% on account of
strong traction from managed services contacts.
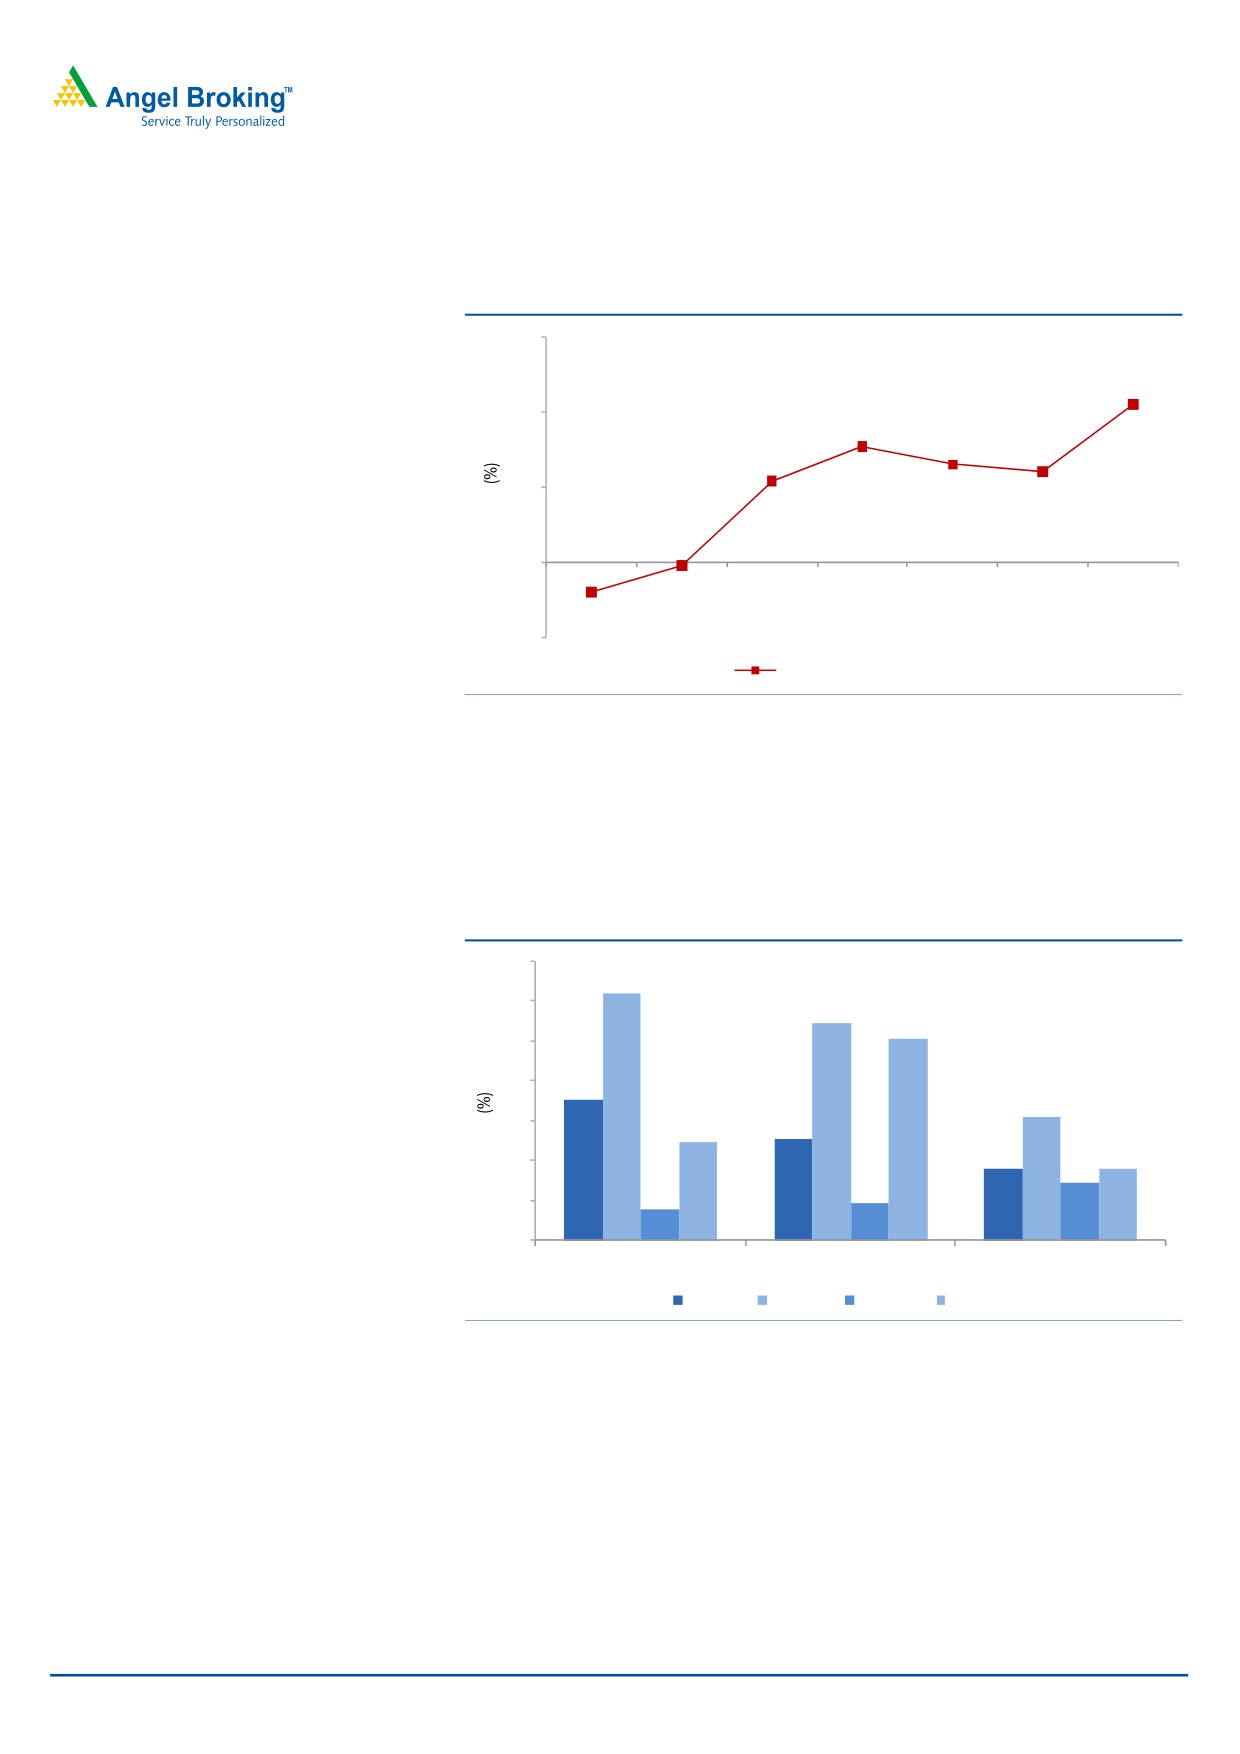
Exhibit 7: Volume growth trend in CLS
30
21.0
20
15.3
13.0
12.0
10.8
10
(4.0)
(0.5)
0
OND09
JFM10
AMJ10
JAS 10
OND 10
JFM 11
AMJ 11
(10)
Volume growth (%)
Source: Company, Angel Research
Consolidated margin declines: Blended EBITDA margin declined by 75bp yoy to
10.3% (vs. our expectation of 9.8%) due to margin decline in ILS and SLS
businesses as well as increased business development expenses, as the company
expanded its sales force from 873 in 4QFY2011 to 985 in 1QFY2012.
Exhibit 8: EBITDA margin (Segment wise)
20
18.4
18
16.9
16.1
16
14
13.0
12.2
12
11.0
11.1
9.6
9.6
10
8.9
7.8
7.6
8
6
AMJ09
AMJ10
AMJ11
ILS
SLS
CLS
Consolidated
Source: Company, Angel Research
July 22, 2011
5
NIIT | 1QFY2012 Result Update
Outlook and valuation
The ILS and CLS businesses are emerging to be the company’s growth drivers.
We expect enrollment growth for ILS-IT to be stronger in FY2012, with strong
recruitment plans announced by Indian IT majors (including Infosys and TCS) and
initial gross hiring targets of
45,000 and
60,000 in FY2012, respectively.
We expect ILS to return to its strong growth momentum of 16% yoy in FY2012, with
strengthening of the hiring environment by the Indian IT players resulting in
demand for vocational courses. CLS, which was heavily impacted by the downturn,
has rebounded with respect to growth and has managed to bag a strong order
book. Demand for discretionary services, including training outsourcing, learning
products and managed training services, is gaining traction. Also, demand for new
business courses such as IFBI, Imperia and Uniqua is expected to strengthen with
the hiring environment turning positive in the management, commercial banking
and BPO space. In the SLS business, the company is witnessing strong traction
from non-GSA schools and has added 754 schools since 1QFY2011. Hence,
we expect the company to post a revenue CAGR of 11.6% over FY2011-13E,
whereas EBITDA growth is expected to outpace the same, reporting a 16.0% CAGR
due to improving business mix in CLS as well as growth in ILS enrollments.
NIIT is strategically moving towards turning asset-light by targeting more
annuity-based revenue. Management aims to do so by being selective in
government SLS contracts, which are highly capital-intensive and have long debtor
cycles (thus impacting returns), targeting more private schools in the SLS business.
Also, annuity contracts bagged in CLS (related to learning products and MTS) are
expected to accelerate revenue growth and improve margins. With the realignment
of its focus, management expects to improve the company’s profitability, reduce
debtor cycle and repay debt by `80cr-90cr in FY2012 itself.
July 22, 2011
6
NIIT | 1QFY2012 Result Update
Exhibit 9: Segmental expectations
(` cr)
FY2009
FY2010
FY2011
FY2012E
FY2013E
ILS
Revenue
432
457
517
601
675
yoy growth (%)
22.9
7.4
9.5
16.3
12.3
EBITDA
79
83
95
113
139
EBITDA margin (%)
18.3
18.2
18.4
18.8
20.6
SLS
Revenue
138
200
148
172
197
yoy growth (%)
36.7
44.6
(26.0)
16.4
14.0
EBITDA
21
30
17
17
18
EBITDA margin (%)
15.5
14.8
11.4
10.1
9.3
CLS
Revenue
579
542
584
641
684
yoy growth (%)
5.0
(6.3)
7.6
9.9
6.7
EBITDA
18
44
47
55
57
EBITDA margin (%)
3.2
8.1
8.1
8.5
8.3
Consolidated
Revenue
1,149
1,199
1,248
1,415
1,556
yoy growth (%)
14.1
4.4
4.1
13.3
10.0
EBITDA
119
157
159
185
214
EBITDA margin (%)
10.3
13.1
12.8
13.1
13.8
Source: Company, Angel Research
Exhibit 10: Change in estimates
FY2012E
FY2013E
Parameter
Earlier
Revised
Variation
Earlier
Revised
Variation
(` cr)
estimates estimates
(%)
estimates
estimates
(%)
Net revenue
1,401
1,415
1.0
1,545
1,556
0.7
EBITDA
185
185
(0.1)
213
214
0.4
Other income
(25)
(24)
(3.3)
(14)
(13)
(1.9)
PBT
66
67
0.5
96
97
0.4
Tax
20
18
(8.3)
30
30
(0.7)
PAT
91
92
1.3
113
114
0.5
Source: Company, Angel Research
July 22, 2011
7
NIIT | 1QFY2012 Result Update
Exhibit 11: One-year forward EV/EBITDA
3,500
3,000
2,500
2,000
1,500
1,000
500
0
EV
16
13
9
6
3
Source: Company, Angel Research
Also, the company’s subsidiary, NIIT Technologies is witnessing a strong growth
momentum. At the CMP, the stock is trading at EV/EBITDA of 4.0x FY2013E
EBITDA, but the stake in NIIT Technologies provides for a strong upside. Hence,
we have valued NIIT on an SOTP basis, arriving at a target EV/EBITDA of 4.3x on
FY2013E consolidated EBITDA of `214.4cr, and have added the company’s stake
in NIIT Technologies (with a holding discount of 25%), arriving at a target price of
`69. We maintain Buy on the stock.
Exhibit 12: Valuation metric for NIIT (Based on FY2013E)
FY2013E (` cr)
EBITDA
Target EV/EBITDA (X)
Target EV
ILS
139.2
5.0
696.2
SLS
18.3
3.0
55.0
CLS
56.8
3.0
170.3
Target EV for NIIT
921.5
Debt
201.0
Cash & Cash equivalent
183.6
Target Mcap for NIIT
904.1
Value per share for NIIT (`)
55.0
Value due to NIIT Technologies
Current price (`)
222.4
Holding discount
25.0
No. of shares held by NIIT (cr)
1.5
Value of held equity
225.7
Value per share of held equity
13.7
Target price for NIIT Ltd.
68.7
Source: Company, Angel Research
July 22, 2011
8
NIIT | 1QFY2012 Result Update
Exhibit 13: Recommendation summary
Company
Reco.
CMP Tgt. price Upside Target
FY2013 FY2013E
FY2011-13E FY2013E FY2013E
(`)
(`)
(%) P/E (x)
EBITDA (%)
P/E (x)
EPS CAGR (%) RoCE (%)
RoE (%)
3iInfotech
Neutral
43
-
-
-
21.5
3.6
(4.3)
12.0
15.1
Educomp
Buy
376
522
39.0
10
46.7
7.3
17.7
16.4
17.0
Everonn
Neutral
555
-
-
-
33.5
13.1
27.7
15.5
16.7
HCL Tech
Buy
504
591
17.2
14
18.5
11.9
30.8
18.9
26.9
Infosys
Accumulate
2,825
3,200
13.3
20
30.6
17.7
15.7
24.7
22.7
Infotech Entp.
Neutral
137
-
-
-
16.1
8.4
13.9
15.2
13.4
KPIT Cummins
Accumulate
192
206
7.3
12
16.1
11.4
21.8
20.6
17.7
MindTree
Accumulate
400
445
11.4
11
13.3
9.9
27.5
16.9
15.4
Mphasis
Accumulate
444
499
12.3
11
17.2
10.0
9.2
16.8
16.8
NIIT^
Buy
56
69
23.5
-
13.8
8.1
11.2
12.4
16.6
Persistent
Buy
367
424
15.6
11
19.5
9.5
5.1
16.6
15.4
TCS
Buy
1,133
1,368
20.8
22
28.9
18.2
18.4
30.2
31.3
Tech Mahindra
Accumulate
748
790
5.6
9*
18.3
13.3
6.8
14.9
15.6
Wipro
Neutral
406
-
-
-
18.7
15.5
9.9
13.8
19.8
Source: Company, Angel Research; Note:*Standalone basis (excluding Mahindra Satyam, ^ Valued on SOTP basis
July 22, 2011
9
NIIT | 1QFY2012 Result Update
Profit and loss statement (consolidated)
Y/E March (` cr)
FY2009 FY2010 FY2011 FY2012E FY2013E
Net sales
1,149
1,199
1,248
1,415
1,556
Operating expenses
1,030
1,043
1,089
1,230
1,341
EBITDA
119
157
159
185
214
% of net sales
10.3
13.1
12.8
13.1
13.8
Dep. and amortization
65
75
86
94
104
% of net sales
5.6
6.3
6.8
6.7
6.7
EBIT
54
82
74
91
110
% of net sales
4.7
6.8
5.9
6.4
7.1
Other income
(5)
(33)
(18)
(24)
(13)
Profit before tax
49
49
56
67
97
Provision for tax
10
11
9
18
30
% of PBT
21.1
22.2
16.0
26.9
30.8
PAT
39
38
47
49
67
Share in profit of associates
31
32
45
43
47
Profit after minority interest
70
70
92
92
114
EPS (`)
4.2
4.3
5.6
5.6
6.9
July 22, 2011
10
NIIT | 1QFY2012 Result Update
Balance sheet (consolidated)
Y/E March (` cr)
FY2009
FY2010
FY2011
FY2012E
FY2013E
Capital employed
Equity capital
33
33
33
33
33
ESOP outstanding
0
-
-
-
-
Reserves and surplus
416
463
517
573
643
Currency translation reserve
28
8
7
8
8
Net worth
477
504
557
614
684
Secured loans
252
254
265
285
201
Unsecured loans
96
151
101
-
-
Total debt
348
405
366
285
201
Minority interest
1
2
3
3
3
Total capital employed
826
911
925
902
888
Capital deployed
Gross block
784
814
877
937
997
Accumulated depreciation
273
322
397
491
596
Net block
511
492
480
446
401
Capital WIP
62
45
62
40
40
Total fixed assets
573
536
542
486
441
Investments
107
127
164
80
75
Inventories
10
13
15
10
10
Sundry debtors
290
340
390
399
413
Cash at bank
75
62
53
109
184
Loans and advances
150
154
135
170
199
Other current assets
44
70
117
70
66
Sundry creditors
241
211
234
236
257
Other liabilities
171
168
243
177
206
Provisions
45
42
45
42
54
Net deferred tax assets
35
30
31
34
17
Miscellaneous expense
-
-
-
-
-
Total capital deployed
826
911
925
902
888
July 22, 2011
11
NIIT | 1QFY2012 Result Update
Cash flow statement (consolidated)
Y/E March (` cr)
FY2009
FY2010
FY2011
FY2012E
FY2013E
Pre tax profit from oper.
29
45
39
57
76
Depreciation
65
75
86
94
104
Pre tax cash from oper.
94
120
125
151
180
Other inc./prior period ad
20
4
2
10
21
Net cash from operations
114
124
126
161
201
Tax
10
11
9
18
30
Share of profit from ass.
31
32
45
43
47
Cash profits
135
145
163
186
218
(Inc)/dec in sundry debtors
(86)
(50)
(49)
(9)
(14)
(Inc)/dec in current assets
(14)
(26)
(48)
48
3
(Inc)/dec in inventories
3
(3)
(3)
5
-
(Inc)/dec in loans and adv.
(20)
(4)
19
(34)
(29)
Inc/(dec) in sundry creditors
56
(31)
24
1
21
Inc/(dec) in other current liab.
40
(5)
78
(68)
41
Net trade working capital
(20)
(118)
20
(58)
22
Cash flow from oper. actv.
114
27
183
128
240
(Inc)/dec in fixed assets
(240)
(38)
(91)
(38)
(60)
(Inc)/dec in investments
(17)
(21)
(37)
84
5
(Inc)/dec in deferred tax asset
(10)
5
(1)
(3)
17
Cash flow from investing actv.
(267)
(55)
(129)
43
(38)
Inc/(dec) in debt
142
56
(39)
(81)
(84)
Inc/(dec) in equity/premium
31
(16)
5
2
-
Inc/(dec) in minority interest
(1)
2
1
-
-
Dividends
25
27
30
35
44
Cash flow from fin. activities
147
15
(63)
(115)
(128)
Cash generated/(utilised)
(5)
(13)
(9)
57
74
Cash at start of the year
80
75
62
53
109
Cash at end of the year
75
62
53
109
184
July 22, 2011
12
NIIT | 1QFY2012 Result Update
Key ratios
Y/E March
FY2009
FY2010
FY2011
FY2012E
FY2013E
Valuation ratio (x)
P/E (on FDEPS)
13.2
13.1
10.0
10.0
8.1
P/CEPS
6.8
6.3
5.2
4.9
4.2
P/BVPS
1.9
1.8
1.7
1.5
1.3
Dividend yield (%)
2.3
2.5
2.8
3.3
4.1
EV/Sales
0.9
0.9
0.9
0.7
0.6
EV/EBITDA
9.1
7.2
6.7
5.5
4.0
EV/Total assets
1.3
1.2
1.2
1.1
1.0
Per share data (`)
EPS
4.2
4.3
5.6
5.6
6.9
Cash EPS
8.2
8.8
10.8
11.3
13.3
Dividend
1.3
1.4
1.6
1.8
2.3
Book value
29.0
30.6
33.8
37.3
41.6
Dupont analysis
Tax retention ratio (PAT/PBT)
0.8
0.8
0.8
0.7
0.7
Cost of debt (PBT/EBIT)
0.9
0.6
0.8
0.7
0.9
EBIT margin (EBIT/sales)
0.0
0.1
0.1
0.1
0.1
Asset turnover ratio (sales/assets)
1.4
1.3
1.3
1.6
1.8
Leverage ratio (assets/equity)
1.7
1.8
1.7
1.5
1.3
Operating ROE
8.1
7.5
8.4
7.9
9.8
Return ratios (%)
RoCE (pre-tax)
6.5
9.0
8.0
10.1
12.4
Angel RoIC
9.2
12.1
11.4
13.5
18.6
RoE
14.6
13.9
16.5
15.0
16.6
Turnover ratios(x)
Asset turnover (fixed assets)
2.0
2.2
2.3
2.9
3.5
Receivables days
79
96
107
103
97
Payable days
76
79
75
70
70
July 22, 2011
13
NIIT | 1QFY2012 Result Update
Research Team Tel: 022 - 3935 7800
DISCLAIMER
This document is solely for the personal information of the recipient, and must not be singularly used as the basis of any investment
decision. Nothing in this document should be construed as investment or financial advice. Each recipient of this document should make
such investigations as they deem necessary to arrive at an independent evaluation of an investment in the securities of the companies
referred to in this document (including the merits and risks involved), and should consult their own advisors to determine the merits and
risks of such an investment.
Angel Broking Limited, its affiliates, directors, its proprietary trading and investment businesses may, from time to time, make
investment decisions that are inconsistent with or contradictory to the recommendations expressed herein. The views contained in this
document are those of the analyst, and the company may or may not subscribe to all the views expressed within.
Reports based on technical and derivative analysis center on studying charts of a stock's price movement, outstanding positions and
trading volume, as opposed to focusing on a company's fundamentals and, as such, may not match with a report on a company's
fundamentals.
The information in this document has been printed on the basis of publicly available information, internal data and other reliable
sources believed to be true, but we do not represent that it is accurate or complete and it should not be relied on as such, as this
document is for general guidance only. Angel Broking Limited or any of its affiliates/ group companies shall not be in any way
responsible for any loss or damage that may arise to any person from any inadvertent error in the information contained in this report.
Angel Broking Limited has not independently verified all the information contained within this document. Accordingly, we cannot testify,
nor make any representation or warranty, express or implied, to the accuracy, contents or data contained within this document. While
Angel Broking Limited endeavours to update on a reasonable basis the information discussed in this material, there may be regulatory,
compliance, or other reasons that prevent us from doing so.
This document is being supplied to you solely for your information, and its contents, information or data may not be reproduced,
redistributed or passed on, directly or indirectly.
Angel Broking Limited and its affiliates may seek to provide or have engaged in providing corporate finance, investment banking or
other advisory services in a merger or specific transaction to the companies referred to in this report, as on the date of this report or in
the past.
Neither Angel Broking Limited, nor its directors, employees or affiliates shall be liable for any loss or damage that may arise from or in
connection with the use of this information.
Note: Please refer to the important `Stock Holding Disclosure' report on the Angel website (Research Section). Also, please
refer to the latest update on respective stocks for the disclosure status in respect of those stocks. Angel Broking Limited and
its affiliates may have investment positions in the stocks recommended in this report.
Disclosure of Interest Statement
NIIT Ltd
1. Analyst ownership of the stock
No
2. Angel and its Group companies ownership of the stock
No
3. Angel and its Group companies' Directors ownership of the stock
No
4. Broking relationship with company covered
No
Note: We have not considered any Exposure below `lakh for Angel, its Group companies and Directors
Ratings (Returns):
Buy (> 15%)
Accumulate (5% to 15%)
Neutral (-5 to 5%)
Reduce (-5% to 15%)
Sell (< -15%)
July 22, 2011
14