Market Outlook
March 30, 2016
Market Cues
Domestic Indices
Chg (%)
(Pts)
(Close)
Indian market is expected to open in the green tracking the SGX Nifty and positive
BSE Sensex
(0.3)
(66)
24,900
global cues.
Nifty
(0.2)
(18)
7,597
US indices ended positive led by dovish comments from the Fed chair Janet Yellen.
Mid Cap
(0.2)
(22)
10,360
The speech helped assuage fears that the Fed will raise interest rates at its next
Small Cap
(0.3)
(28)
10,301
meeting in April.
Bankex
0.4
70
17,832
European markets ended on a mixed note after the long Easter holiday weekend.
Weakness in oil prices and caution ahead of the Fed speech resulted in some
Global Indices
Chg (%)
(Pts)
(Close)
downward pressure on the markets.
Dow Jones
0.6
98
17,633
Indian shares erased early gains to end slightly lower as investors waited to hear
Nasdaq
1.7
80
4,847
from Federal Reserve Chair Janet Yellen on U.S. interest rate outlook. Caution also
FTSE
(0.0)
(1)
6,106
prevailed ahead of the F&O expiry and monetary policy due on April 5.
Nikkei
(0.2)
(31)
17,104
News & Result Analysis
Hang Seng
0.1
21
20,366
Lupin- Mandideep facility gets USFDA 483’s
Shanghai Com
(1.3)
(38)
2,920
Detailed analysis on Pg2
Investor’s Ready Reckoner
Advances / Declines
BSE
NSE
Advances
938
623
Key Domestic & Global Indicators
Declines
1,720
942
Stock Watch: Latest investment recommendations on 150+ stocks
Unchanged
163
71
Refer Pg4 onwards
Top Picks
Volumes (` Cr)
CMP
Target
Upside
Company
Sector
Rating
(`)
(`)
(%)
BSE
3,596
Amara Raja Batteries Auto & Auto Ancillary
Buy
884
1,040
17.6
NSE
18,061
HCL Tech
IT
Buy
811
1,038
28.1
LIC Housing Finance Financials
Buy
477
592
24.1
Net Inflows (` Cr)
Net
Mtd
Ytd
Bharat Electronics
Capital Goods
Buy
1,180
1,414
19.8
FII
2,249
20,687
(17,481)
Navkar Corporation Others
Buy
178
265
49.2
MFs
(592)
(5,784)
69,034
More Top Picks on Pg3
Key Upcoming Events
Top Gainers
Price (`)
Chg (%)
Previous
Consensus
Date
Region
Event Description
Reading
Expectations
Prestige
164
6.4
Mar 31 USA
Initial Jobless claims (‘000)
265.0
265.0
Mrpl
65
4.7
Apr 5 India
RBI Repo Rate%
6.75
6.50
Indhotel
100
4.7
Apr 8 India
Imports YoY%
(5.00)
---
Mcleodruss
188
4.3
Apr 8 India
Exports YoY%
(5.66)
---
Cub
91
4.2
More Events on Pg5
Top Losers
Price (`)
Chg (%)
Jindalstel
56
(7.2)
Lupin
1,401
(6.3)
Glenmark
782
(4.6)
Jubilant
393
(4.5)
Aplltd
593
(4.3)
As on March 29, 2016
Market Outlook
March 30, 2016
Lupin- Mandideep facility gets USFDA 483’s
Lupin had an audit at its Mandideep location from 2nd Feb, 2016 to 19th Feb,
2016. There were total 3 observations. As the site has both dosage form facility
and API facility, 2 separate form 483s were issued with 2 observations each. 1 of
the observations was repeated in both the forms as it is relevant to both
operations. The company believes that these observations are minor in nature and
the company has already addressed these observations. The company believes
that the outcome of the audit will be Voluntary Action Indicated only and there will
be no remediation required.
Also, one of the observations which were erroneously quoted relates to use of non-
conforming intermediate for making API prior to 2015. This was done based on
laboratory trials and scientific rationales that further processing steps were capable
of producing desired quality API. All API batches and drug product batches
manufactured using such APIs complied with the specifications and hence was
released to market. Appropriate corrective and preventative actions were already
implemented in 2015 and were verified by the FDA investigator. As an abundant
precaution, the company has since recalled batches manufactured from this
period. There is no material financial impact of the recall. The company doesn’t
expect any disruption to product supply from its Mandideep location. Also, there
are no pending applications from the facility. We maintain Accumulate with a price
target of `1560.
Economic and Political News
Govt allows 100% FDI in e-commerce marketplaces
Three PSU banks to get `2,375cr capital infusion from government
Gas consumption up 19% in February on falling LNG prices
Corporate News
Tata Steel to sell entire UK operation: BBC
GSK Pharma to launch more combination vaccines
Zydus gets FDA nod for anti-viral Acyclovir capsules
Adani Ports raises `500cr via debentures
HGS eyes more acquisitions in healthcare space
Market Outlook
March 30, 2016
Top Picks HHHHH
Large Cap
Market Cap
CMP
Target
Upside
Company
Rationale
(` Cr)
(`)
(`)
(%)
To outpace battery industry growth due to better technological
Amara Raja Batteries
15,102
884
1,040
17.6
products leading to market share gains in both the automotive
OEM and replacement segments.
Uptick in defense capex by government when coupled with
Bharat Electronics
28,322
1,180
1,414
19.8
BELs strong market positioning, indicate that good times are
ahead for BEL.
The stock is trading at attractive valuations and is factoring all
HCL Tech
1,14,297
811
1,038
28.1
the bad news.
Strong visibility for a robust 20% earnings trajectory, coupled
HDFC Bank
2,66,220
1,053
1,262
19.8
with high quality of earnings on account of high quality retail
business and strategic focus on highly rated corporates.
Back on the growth trend, expect a long term growth of 14%
Infosys
2,76,291
1,199
1,347
12.3
to be a US$20bn in FY2020.
LICHF continues to grow its retail loan book at a healthy pace
with improvement in asset quality. We expect the company to
LIC Housing Finance
24,062
477
592
24.1
post a healthy loan book which is likely to reflect in a strong
earnings growth.
Huge bid pipeline of re-development works at Delhi and other
NBCC
11,429
952
1,089
14.3
State Governments and opportunity from Smart City, positions
NBCC to report strong growth, going forward.
Source: Company, Angel Research
Mid Cap
Market Cap
CMP
Target
Upside
Company
Rationale
(` Cr)
(`)
(`)
(%)
Favorable outlook for the AC industry to augur well for
Cooling products business which is out pacing the market
Blue Star
3,350
372
439
17.9
growth. EMPPAC division's profitability to improve once
operating environment turns around.
Commencement of new projects, downtrend in the interest rate
IL&FS Transport
2,258
69
93
35.5
cycle, to lead to stock re-rating
Economic recovery to have favourable impact on advertising &
circulation revenue growth. Further, the acquisition of a radio
Jagran Prakashan
5,100
156
189
21.2
business (Radio City) would also boost the company's revenue
growth.
Speedier execution and speedier sales, strong revenue visibilty
Mahindra Lifespace
1,748
426
554
30.1
in short-to-long run, attractive valuations
Massive capacity expansion along with rail advantage at ICD
Navkar Corporation
2,533
178
265
49.2
as well CFS augurs well for the company
Earnings boost on back of stable material prices and
Radico Khaitan
1,246
94
156
66.6
favourable pricing environment. Valuation discount to peers
provides additional comfort
Strong brands and distribution network would boost growth
Siyaram Silk Mills
885
944
1,354
43.4
going ahead. Stock currently trades at an inexpensive
valuation.
Source: Company, Angel Research
Market Outlook
March 30, 2016
Key Upcoming Events
Global economic events release calendar
Date
Time
Country
Event Description
Unit
Period
Bloomberg Data
Last Reported Estimated
Mar 30, 2016 2:30PM
Euro Zone
Euro-Zone Consumer Confidence
Value
Mar F
(9.70)
(9.70)
Mar 31, 2016 6:00PM
US
Initial Jobless claims
Thousands
Mar 26
265.00
265.00
1:25PM
Germany
Unemployment change (000's)
Thousands
Mar
(10.00)
(6.00)
2:00PM
UK
GDP (YoY)
% Change
4Q F
1.90
1.90
Apr 1, 2016
1:25PM
Germany
PMI Manufacturing
Value
Mar F
50.40
50.40
2:00PM
UK
PMI Manufacturing
Value
Mar
50.80
51.20
6:30AM
China
PMI Manufacturing
Value
Mar
49.00
49.40
6:00PM
US
Change in Nonfarm payrolls
Thousands
Mar
242.00
205.00
6:00PM
US
Unnemployment rate
%
Mar
4.90
4.90
Apr 5, 2016
1:25PM
Germany
PMI Services
Value
Mar F
55.50
--
11:00AM
India
RBI Reverse Repo rate
%
Apr 5
5.75
5.50
11:00AM
India
RBI Repo rate
%
Apr 5
6.75
6.50
11:00AM
India
RBI Cash Reserve ratio
%
Apr 5
4.00
4.00
Apr 8, 2016
India
Imports YoY%
% Change
Mar
(5.00)
--
India
Exports YoY%
% Change
Mar
(5.66)
--
2:00PM
UK
Industrial Production (YoY)
% Change
Feb
0.20
--
Apr 11, 2016
7:00AM
China
Consumer Price Index (YoY)
% Change
Mar
2.30
--
Apr 12, 2016
2:00PM
UK
CPI (YoY)
% Change
Mar
0.30
--
5:30PM
India
Industrial Production YoY
% Change
Feb
(1.50)
--
Apr 13, 2016
US
Producer Price Index (mom)
% Change
Mar
(0.60)
--
China
Exports YoY%
% Change
Mar
(25.40)
--
Apr 14, 2016
12:00PM
India
Monthly Wholesale Prices YoY%
% Change
Mar
(0.91)
--
6:00PM
US
Consumer price index (mom)
% Change
Mar
(0.20)
--
2:30PM
Euro Zone
Euro-Zone CPI (YoY)
%
Mar F
(0.20)
--
4:30PM
UK
BOE Announces rates
% Ratio
Apr 14
0.50
0.50
Apr 15, 2016
6:45PM
US
Industrial Production
%
Mar
(0.49)
--
7:30AM
China
Industrial Production (YoY)
% Change
Mar
5.90
--
7:30AM
China
Real GDP (YoY)
% Change
1Q
6.80
--
Source: Bloomberg, Angel Research
Market Outlook
March 30, 2016
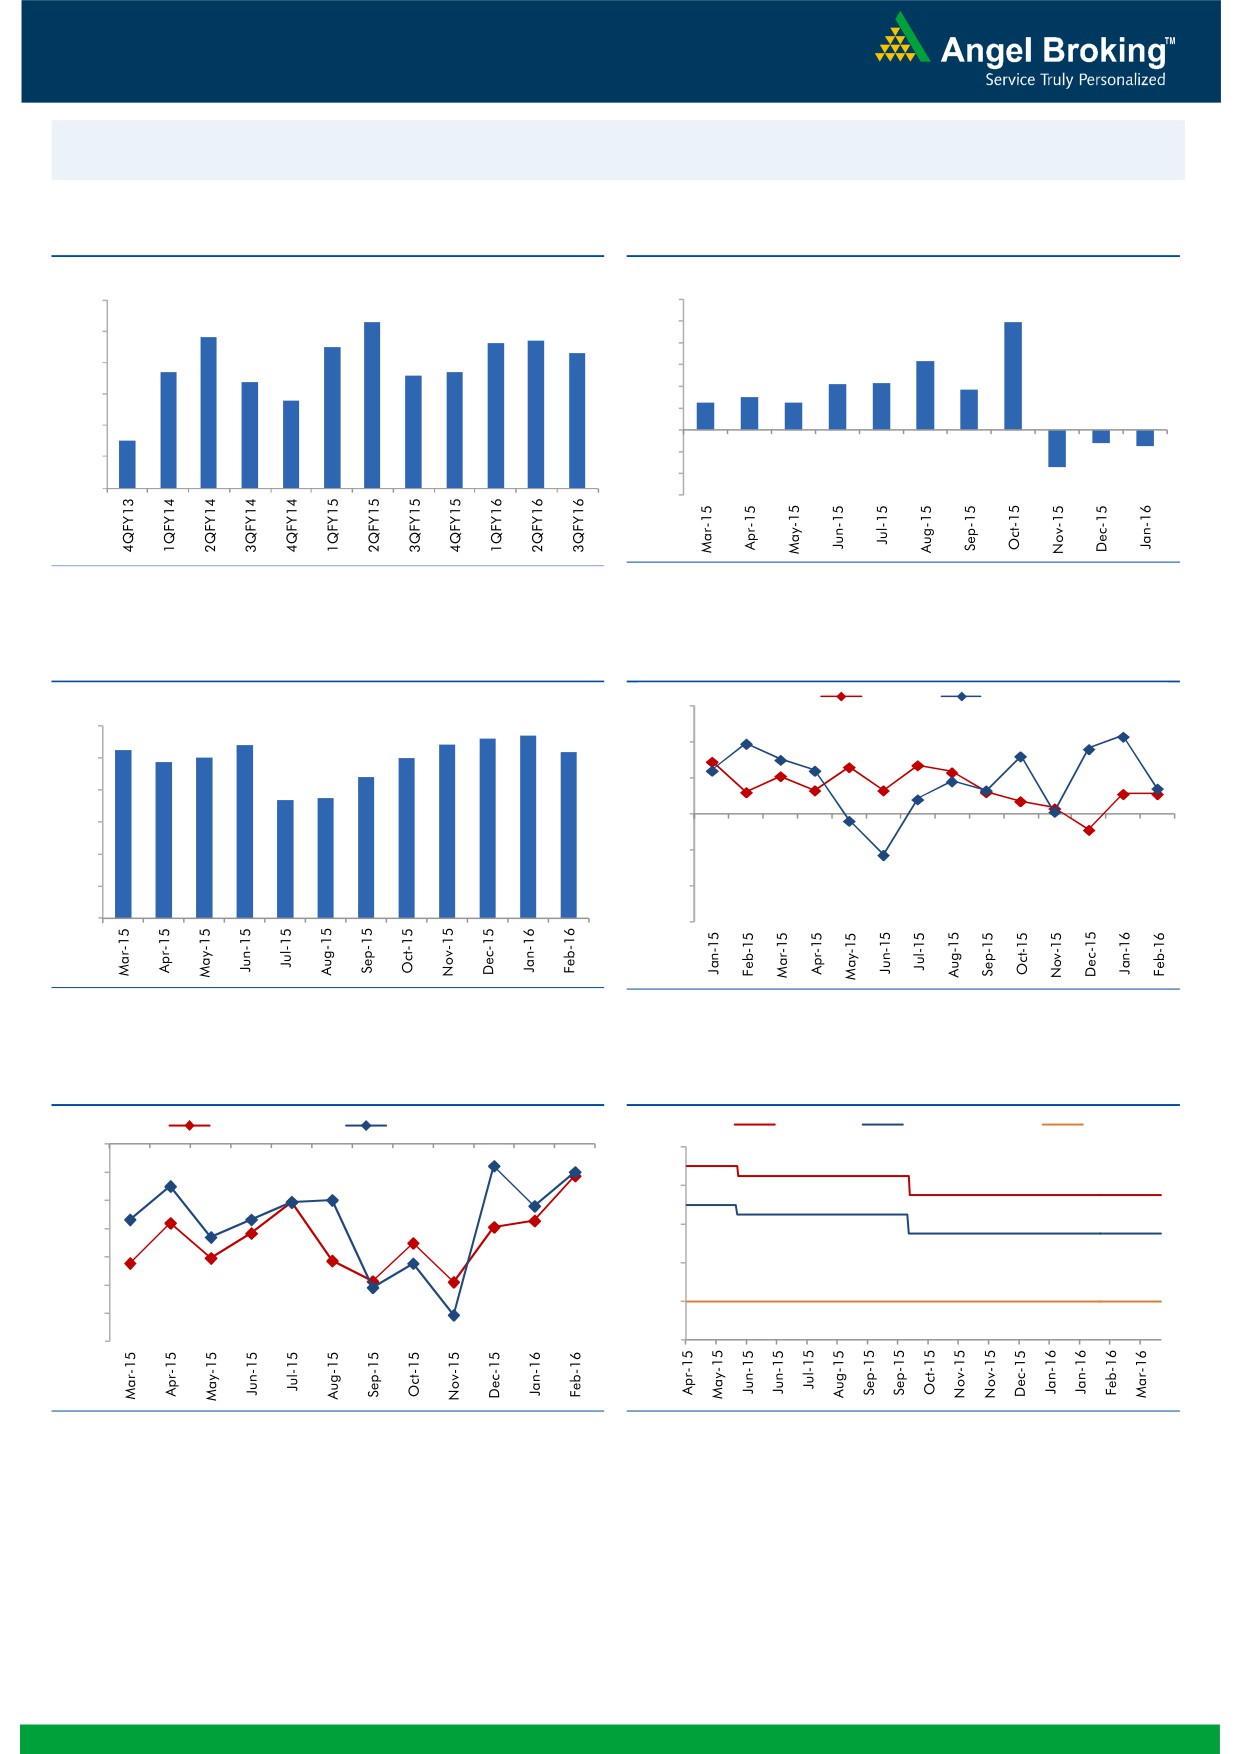
Macro watch
Exhibit 1: Quarterly GDP trends
Exhibit 2: IIP trends
(%)
(%)
9.0
8.3
12.0
9.9
7.8
7.7
10.0
8.0
7.5
7.6
7.3
8.0
6.3
6.7
6.6
6.7
7.0
6.4
6.0
4.2
4.3
3.7
5.8
4.0
2.5
3.0
2.5
6.0
2.0
5.0
4.5
-
4.0
(2.0)
(1.2)
(1.5)
(4.0)
3.0
(3.4)
(6.0)
Source: CSO, Angel Research
Source: MOSPI, Angel Research
Exhibit 3: Monthly CPI inflation trends
Exhibit 4: Manufacturing and services PMI
Mfg. PMI
Services PMI
(%)
56.0
5.6
5.7
6.0
5.4
5.4
5.3
5.2
4.9
5.0
5.0
54.0
5.0
4.4
3.7
3.7
52.0
4.0
50.0
3.0
2.0
48.0
1.0
46.0
-
44.0
Source: MOSPI, Angel Research
Source: Market, Angel Research; Note: Level above 50 indicates expansion
Exhibit 5: Exports and imports growth trends
Exhibit 6: Key policy rates
(%)
Exports yoy growth
Imports yoy growth
(%)
Repo rate
Reverse Repo rate
CRR
0.0
8.00
(5.0)
7.00
(10.0)
(15.0)
6.00
(20.0)
5.00
(25.0)
4.00
(30.0)
(35.0)
3.00
Source: Bloomberg, Angel Research
Source: RBI, Angel Research
Market Outlook
March 30, 2016
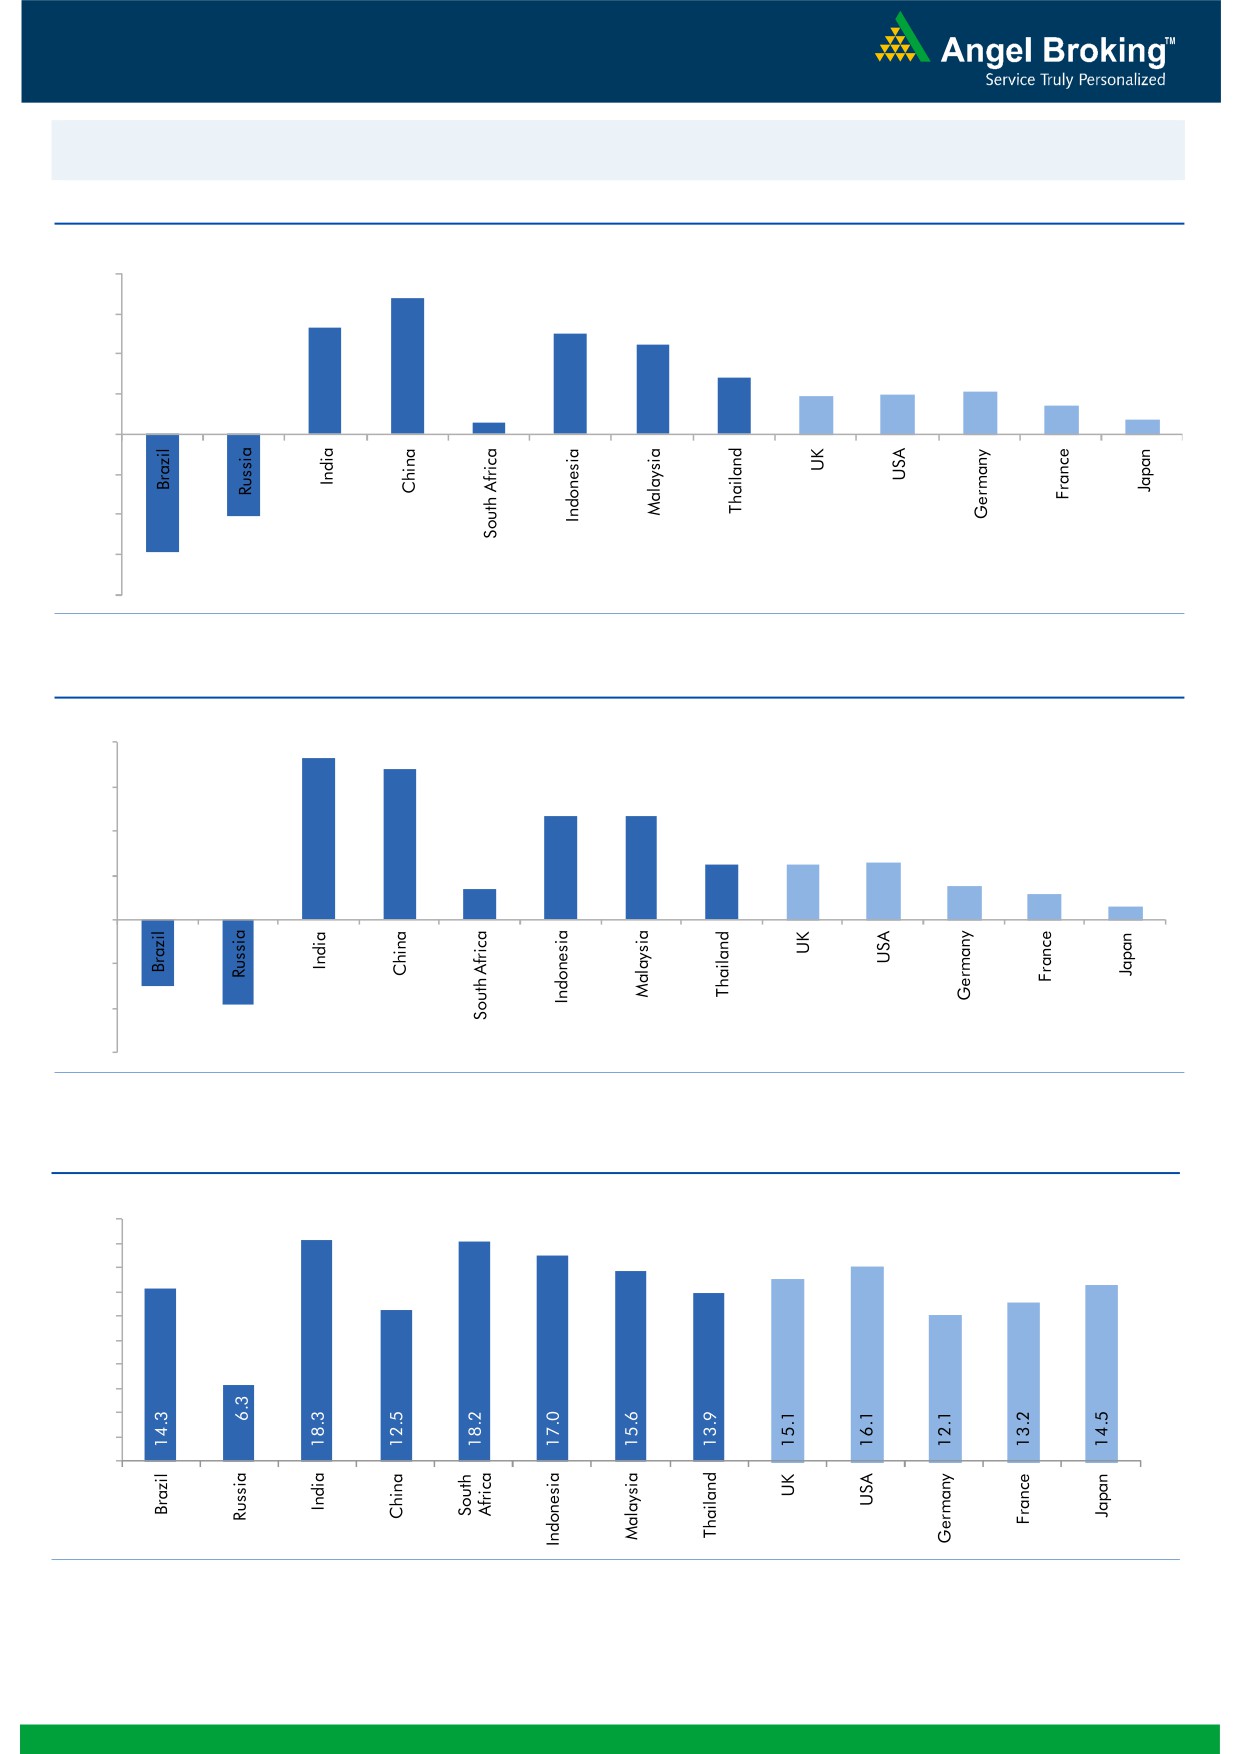
Global watch
Exhibit 1: Latest quarterly GDP Growth (%, yoy) across select developing and developed countries
(%)
8.0
6.8
6.0
5.3
5.0
4.5
4.0
2.8
1.9
2.0
2.1
1.4
2.0
0.6
0.7
-
(2.0)
(4.0)
(4.1)
(6.0)
(5.9)
(8.0)
Source: Bloomberg, Angel Research
Exhibit 2: 2015 GDP Growth projection by IMF (%, yoy) across select developing and developed countries
(%)
8.0
7.3
6.8
6.0
4.7
4.7
4.0
2.5
2.5
2.6
1.4
1.5
2.0
1.2
0.6
-
(2.0)
(3.0)
(4.0)
(3.8)
(6.0)
Source: IMF, Angel Research
Exhibit 3: One year forward P-E ratio across select developing and developed countries
(x)
20.0
18.0
16.0
14.0
12.0
10.0
8.0
6.0
4.0
2.0
-
Source: IMF, Angel Research
Market Outlook
March 30, 2016
Exhibit 4: Relative performance of indices across globe
Returns (%)
Country
Name of index
Closing price
1M
3M
1YR
Brazil
Bovespa
51,155
22.1
16.5
0.4
Russia
Micex
1,845
2.3
7.1
17.4
India
Nifty
7,597
6.9
(3.4)
(11.2)
China
Shanghai Composite
2,920
9.7
(18.9)
(20.0)
South Africa
Top 40
45,819
6.7
(0.1)
(0.8)
Mexico
Mexbol
45,898
6.2
5.9
6.2
Indonesia
LQ45
829
2.3
6.9
(12.2)
Malaysia
KLCI
1,715
3.1
5.3
(4.5)
Thailand
SET 50
895
4.1
9.8
(11.6)
USA
Dow Jones
17,633
5.6
0.2
(1.9)
UK
FTSE
6,106
4.1
(2.2)
(11.4)
Japan
Nikkei
17,104
6.0
(9.4)
(12.2)
Germany
DAX
9,888
7.9
(5.7)
(18.2)
France
CAC
4,367
5.1
(6.4)
(13.9)
Source: Bloomberg, Angel Research
Stock Watch
March 30, 2016
Company Name
Reco
CMP
Target
Mkt Cap
Sales ( Čcr )
OPM(%)
EPS (Č)
PER(x)
P/BV(x)
RoE(%)
EV/Sales(x)
(Č)
Price ( Č)
( Č cr )
FY16E FY17E
FY16E
FY17E
FY16E
FY17E
FY16E
FY17E
FY16E
FY17E
FY16E
FY17E
FY16E
FY17E
Agri / Agri Chemical
Rallis
Neutral
170
-
3,302
2,097
2,415
14.4
14.4
9.5
11.0
17.9
15.4
3.6
3.1
21.1
21.3
1.6
1.4
United Phosphorus
Accumulate
451
480
19,332
12,500
14,375
18.3
18.3
29.8
35.9
15.1
12.6
2.8
2.3
20.0
20.3
1.6
1.4
Auto & Auto Ancillary
Ashok Leyland
Neutral
107
-
30,351
17,995
21,544
11.4
11.6
3.4
4.7
31.4
22.7
5.5
5.1
17.7
22.2
1.6
1.3
Bajaj Auto
Accumulate
2,347
2,585
67,923
22,709
25,860
20.9
20.1
129.0
143.6
18.2
16.4
5.6
4.8
30.7
29.4
2.5
2.2
Bharat Forge
Neutral
891
-
20,749
7,351
8,318
19.9
19.7
31.2
36.5
28.6
24.4
5.1
4.3
19.3
19.2
3.0
2.6
Eicher Motors
Accumulate
18,633
20,044
50,611
15,556
16,747
15.5
17.3
464.8
597.5
40.1
31.2
14.6
10.8
36.2
34.3
3.2
2.9
Gabriel India
Accumulate
90
101
1,286
1,415
1,544
8.7
9.0
4.6
5.4
19.5
16.6
3.5
3.1
18.1
18.9
0.9
0.8
Hero Motocorp
Neutral
2,851
-
56,938
28,244
30,532
15.5
15.9
156.7
168.5
18.2
16.9
7.3
6.2
39.9
36.4
1.9
1.7
Jamna Auto Industries Buy
137
160
1,092
1,281
1,473
11.2
11.5
7.6
9.2
18.0
14.9
4.5
3.7
25.4
25.2
0.9
0.8
L G Balakrishnan & Bros Neutral
437
-
686
1,254
1,394
11.6
11.8
35.9
41.7
12.2
10.5
1.7
1.5
13.5
13.8
0.7
0.6
Mahindra and Mahindra Accumulate
1,232
1,364
76,534
38,416
42,904
13.7
13.9
54.8
63.4
22.5
19.4
3.5
3.1
15.4
15.8
1.6
1.4
Maruti
Neutral
3,731
-
112,702
57,865
68,104
16.4
16.7
176.3
225.5
21.2
16.5
4.1
3.5
19.4
21.2
1.7
1.4
Minda Industries
Accumulate
930
1,047
1,476
2,523
2,890
8.7
9.0
55.0
65.4
16.9
14.2
3.3
2.7
19.3
18.7
0.7
0.6
Motherson Sumi
Buy
246
313
32,513
39,343
45,100
8.8
9.1
10.1
12.5
24.3
19.7
7.7
6.0
35.3
34.4
0.9
0.8
Rane Brake Lining
Buy
370
465
293
454
511
11.5
12.0
25.2
31.0
14.7
11.9
2.2
2.0
14.9
16.6
0.8
0.7
Setco Automotive
Neutral
30
-
399
594
741
12.7
13.7
1.7
3.2
17.6
9.3
1.9
1.6
10.4
16.9
1.1
0.9
Tata Motors
Neutral
373
-
107,635
259,686
273,957
13.0
13.4
25.9
29.5
14.4
12.6
1.9
1.7
8.0
9.0
0.6
0.6
TVS Motor
Neutral
315
-
14,977
11,263
13,122
6.9
8.5
9.2
15.0
34.3
21.0
7.8
6.2
22.7
29.6
1.3
1.1
Amara Raja Batteries
Buy
884
1,040
15,102
4,892
5,871
17.4
17.6
28.8
37.1
30.7
23.8
7.2
5.7
23.4
24.1
3.0
2.5
Exide Industries
Buy
135
162
11,484
6,950
7,784
14.4
14.8
6.6
7.3
20.5
18.5
2.6
2.4
12.6
12.8
1.4
1.2
Apollo Tyres
Accumulate
171
183
8,681
12,056
12,714
17.2
16.4
23.0
20.3
7.4
8.4
1.3
1.1
17.7
13.6
0.8
0.8
Ceat
Accumulate
1,043
1,119
4,220
6,041
6,597
14.1
13.7
99.5
111.9
10.5
9.3
2.1
1.7
19.6
18.5
0.9
0.7
JK Tyres
Neutral
83
-
1,879
7,446
7,669
15.2
14.0
19.6
18.4
4.2
4.5
1.1
0.9
25.2
19.5
0.6
0.6
Swaraj Engines
Accumulate
844
919
1,048
552
630
14.2
14.7
44.6
54.1
18.9
15.6
4.4
4.0
23.2
25.6
1.8
1.5
Subros
Neutral
87
-
521
1,293
1,527
11.8
11.9
4.2
6.7
20.7
13.0
1.6
1.4
7.7
11.5
0.7
0.6
Indag Rubber
Neutral
166
-
437
283
329
17.0
17.2
13.0
15.4
12.8
10.8
2.8
2.3
21.8
21.6
1.3
1.0
Capital Goods
ACE
Neutral
37
-
362
660
839
4.7
8.2
1.0
3.9
36.6
9.4
1.1
1.0
3.2
11.3
0.7
0.6
BEML
Accumulate
1,031
1,157
4,295
3,277
4,006
6.0
8.9
36.2
64.3
28.5
16.0
2.0
1.8
5.7
11.7
1.4
1.1
Bharat Electronics
Buy
1,180
1,414
28,322
7,737
8,634
16.8
17.2
54.0
61.5
21.9
19.2
3.1
2.8
39.3
45.6
2.8
2.4
Stock Watch
March 30, 2016
Company Name
Reco
CMP
Target
Mkt Cap
Sales ( Čcr )
OPM(%)
EPS (Č)
PER(x)
P/BV(x)
RoE(%)
EV/Sales(x)
(Č)
Price ( Č)
( Č cr )
FY16E
FY17E
FY16E
FY17E
FY16E
FY17E
FY16E
FY17E
FY16E
FY17E
FY16E
FY17E
FY16E
FY17E
Capital Goods
Voltas
Buy
267
353
8,845
5,363
5,963
8.0
9.1
11.0
13.8
24.3
19.4
3.7
3.3
16.2
17.9
1.6
1.4
BGR Energy
Neutral
105
-
755
3,615
3,181
9.5
9.4
16.7
12.4
6.3
8.4
0.6
0.6
10.0
7.0
0.6
0.8
BHEL
Neutral
111
-
27,193
33,722
35,272
10.8
11.7
10.5
14.2
10.6
7.8
0.8
0.7
7.0
9.0
0.9
0.8
Blue Star
Buy
372
439
3,350
3,548
3,977
6.3
6.9
13.7
17.2
27.2
21.7
6.8
4.4
26.1
25.4
1.0
0.9
Crompton Greaves
Neutral
48
-
3,002
13,484
14,687
4.9
6.2
4.5
7.1
10.6
6.8
0.8
0.7
7.2
10.8
0.4
0.3
Greaves Cotton
Neutral
121
-
2,948
1,655
1,755
16.6
16.8
7.4
7.8
16.3
15.5
3.3
3.1
21.1
20.6
1.7
1.6
Inox Wind
Buy
252
458
5,585
4,980
5,943
17.0
17.5
26.6
31.6
9.5
8.0
2.8
2.1
35.0
30.0
1.3
1.0
KEC International
Neutral
117
-
3,009
8,791
9,716
6.1
6.8
5.4
8.2
21.7
14.3
2.2
2.0
10.0
14.0
0.6
0.5
Thermax
Neutral
721
-
8,594
6,413
7,525
7.4
8.5
30.5
39.3
23.7
18.4
3.6
3.2
15.0
17.0
1.3
1.1
VATech Wabag
Neutral
527
-
2,871
2,722
3,336
7.9
8.1
19.5
24.6
27.0
21.4
2.8
2.5
11.1
12.4
1.1
0.9
Cement
ACC
Neutral
1,368
-
25,675
13,151
14,757
16.4
18.3
63.9
83.4
21.4
16.4
2.8
2.5
13.3
16.1
1.8
1.5
Ambuja Cements
Neutral
230
-
35,748
11,564
12,556
19.4
20.7
8.9
10.1
25.9
22.8
3.2
3.1
12.8
13.8
2.7
2.5
HeidelbergCement
Neutral
78
-
1,761
1,772
1,926
13.3
15.4
1.0
3.0
77.7
25.9
2.0
1.8
2.6
7.9
1.6
1.4
India Cements
Neutral
84
-
2,580
4,216
4,840
18.0
19.5
4.0
9.9
21.0
8.5
0.8
0.8
4.0
9.5
0.9
0.8
JK Cement
Neutral
642
-
4,488
3,661
4,742
10.1
15.8
7.5
28.5
85.6
22.5
2.6
2.3
7.5
22.9
1.7
1.3
J K Lakshmi Cement
Neutral
327
-
3,846
2,947
3,616
16.7
19.9
11.5
27.2
28.4
12.0
2.7
2.3
9.8
20.8
1.7
1.4
Mangalam Cements
Neutral
220
-
586
1,053
1,347
10.5
13.3
8.4
26.0
26.1
8.4
1.1
1.0
4.3
12.5
0.9
0.7
Orient Cement
Neutral
145
-
2,976
1,854
2,524
21.2
22.2
7.7
11.1
18.9
13.1
2.7
2.3
13.3
15.7
2.3
1.6
Ramco Cements
Neutral
399
-
9,500
4,036
4,545
20.8
21.3
15.1
18.8
26.4
21.2
3.2
2.9
12.9
14.3
2.9
2.5
Shree Cement^
Neutral
12,068
-
42,041
7,150
8,742
26.7
28.6
228.0
345.5
52.9
34.9
7.8
6.5
15.7
20.3
5.6
4.5
UltraTech Cement
Neutral
3,137
-
86,092
24,669
29,265
18.2
20.6
82.0
120.0
38.3
26.1
4.1
3.6
11.3
14.7
3.6
3.0
Construction
ITNL
Buy
69
93
2,258
7,360
8,825
34.0
35.9
7.0
9.0
9.8
7.6
0.3
0.3
3.2
3.7
3.7
3.6
KNR Constructions
Buy
508
603
1,428
937
1,470
14.3
14.0
44.2
38.6
11.5
13.2
2.3
2.0
15.4
15.4
1.6
1.0
Larsen & Toubro
Accumulate
1,193
1,310
111,144
58,870
65,708
8.3
10.3
42.0
53.0
28.4
22.5
2.0
1.8
8.8
11.2
2.1
1.9
Gujarat Pipavav Port
Neutral
172
-
8,327
629
684
51.0
52.2
6.4
5.9
26.9
29.2
3.5
3.3
15.9
12.7
12.9
11.7
MBL Infrastructures
Buy
153
285
633
2,313
2,797
12.2
14.6
19.0
20.0
8.0
7.6
0.8
0.8
11.3
10.6
1.0
0.9
Nagarjuna Const.
Neutral
73
-
4,050
7,892
8,842
8.8
9.1
3.0
5.3
24.3
13.8
1.2
1.1
5.0
8.5
0.8
0.6
PNC Infratech
Accumulate
493
558
2,532
1,873
2,288
13.2
13.5
24.0
32.0
20.6
15.4
2.0
1.8
12.1
12.3
1.5
1.2
Simplex Infra
Neutral
248
-
1,227
5,955
6,829
10.3
10.5
16.0
31.0
15.5
8.0
0.8
0.8
5.3
9.9
0.7
0.6
Stock Watch
March 30, 2016
Company Name
Reco
CMP
Target
Mkt Cap
Sales ( Čcr )
OPM(%)
EPS (Č)
PER(x)
P/BV(x)
RoE(%)
EV/Sales(x)
(Č)
Price ( Č)
( Č cr )
FY16E
FY17E
FY16E
FY17E
FY16E
FY17E
FY16E
FY17E
FY16E
FY17E
FY16E
FY17E
FY16E
FY17E
Construction
Power Mech Projects
Neutral
554
-
815
1,539
1,801
12.8
12.7
59.0
72.1
9.4
7.7
1.4
1.2
18.6
16.8
0.5
0.5
Sadbhav Engineering
Neutral
286
-
4,902
3,481
4,219
10.7
10.8
8.2
11.7
34.9
24.4
3.3
2.9
10.3
13.5
1.7
1.4
NBCC
Accumulate
952
1,089
11,429
5,816
7,382
6.9
7.7
29.6
39.8
32.2
23.9
5.8
4.6
24.1
26.7
1.7
1.3
MEP Infra
Neutral
36
-
591
1,956
1,876
28.1
30.5
1.3
3.0
28.0
12.1
5.9
4.0
21.2
32.8
1.7
1.7
SIPL
Neutral
93
-
3,269
675
1,042
62.4
64.7
-
-
3.5
4.0
-
-
16.5
11.1
Engineers India
Neutral
162
-
5,460
1,667
1,725
13.5
16.0
9.7
11.4
16.7
14.2
2.0
1.9
11.7
13.4
2.1
2.1
Financials
Allahabad Bank
Neutral
52
-
3,144
8,569
9,392
2.8
2.9
16.3
27.5
3.2
1.9
0.3
0.2
7.6
11.9
-
-
Axis Bank
Buy
429
494
102,274
26,473
31,527
3.5
3.6
35.7
43.5
12.0
9.9
2.0
1.7
17.9
18.9
-
-
Bank of Baroda
Neutral
141
-
32,373
18,485
21,025
1.9
2.0
13.5
21.1
10.4
6.7
0.8
0.7
7.3
10.6
-
-
Bank of India
Neutral
94
-
7,652
15,972
17,271
1.9
2.0
15.3
33.4
6.2
2.8
0.3
0.2
3.6
7.6
-
-
Canara Bank
Neutral
181
-
9,815
15,441
16,945
2.0
2.1
46.6
70.4
3.9
2.6
0.3
0.3
8.0
11.2
-
-
Dena Bank
Neutral
28
-
1,829
3,440
3,840
2.1
2.3
7.3
10.0
3.9
2.8
0.3
0.2
6.1
7.9
-
-
Federal Bank
Neutral
47
-
8,065
3,477
3,999
3.0
3.0
5.0
6.2
9.4
7.5
0.9
0.9
10.6
11.9
-
-
HDFC
Neutral
1,128
-
178,159
10,358
11,852
3.3
3.3
41.1
47.0
27.5
24.0
5.2
4.8
24.7
24.9
-
-
HDFC Bank
Buy
1,053
1,262
266,220
38,309
47,302
4.3
4.3
49.3
61.1
21.4
17.3
3.7
3.2
18.5
19.7
-
-
ICICI Bank
Accumulate
223
254
129,861
34,279
39,262
3.3
3.3
21.0
24.4
10.6
9.2
1.8
1.5
14.4
14.7
-
-
IDBI Bank
Neutral
68
-
12,958
9,625
10,455
1.8
1.8
8.5
14.2
8.0
4.8
0.5
0.5
5.9
9.3
-
-
Indian Bank
Neutral
102
-
4,875
6,160
6,858
2.5
2.5
24.5
29.8
4.2
3.4
0.3
0.3
7.7
8.6
-
-
LIC Housing Finance
Buy
477
592
24,062
3,101
3,745
2.5
2.5
33.0
40.2
14.5
11.9
2.7
2.3
19.7
20.5
-
-
Oriental Bank
Neutral
86
-
2,565
7,643
8,373
2.4
2.4
37.2
45.4
2.3
1.9
0.2
0.2
8.2
9.4
-
-
Punjab Natl.Bank
Neutral
82
-
16,092
23,638
26,557
2.8
2.8
17.9
27.2
4.6
3.0
0.5
0.4
8.5
12.0
-
-
South Ind.Bank
Neutral
17
-
2,316
1,965
2,185
2.5
2.5
2.5
3.3
6.9
5.2
0.7
0.6
9.5
11.7
-
-
St Bk of India
Neutral
190
-
147,105
79,958
86,061
2.6
2.6
13.4
20.7
14.2
9.2
1.2
1.1
11.5
12.8
-
-
Union Bank
Neutral
125
-
8,566
12,646
14,129
2.3
2.4
31.0
39.1
4.0
3.2
0.4
0.4
9.8
11.4
-
-
Vijaya Bank
Neutral
31
-
2,650
3,536
3,827
1.9
1.9
5.5
6.7
5.6
4.6
0.5
0.4
7.8
8.8
-
-
Yes Bank
Neutral
847
-
35,597
7,190
9,011
3.2
3.3
58.2
69.7
14.5
12.2
2.6
2.2
19.2
19.6
-
-
FMCG
Asian Paints
Neutral
854
-
81,920
16,553
19,160
16.0
16.2
17.7
21.5
48.3
39.7
12.8
11.5
29.4
31.2
4.8
4.1
Britannia
Neutral
2,583
-
30,985
8,481
9,795
14.0
14.1
65.5
78.3
39.4
33.0
18.7
15.3
38.3
41.2
3.5
3.0
Colgate
Neutral
828
-
22,523
4,836
5,490
19.5
19.7
48.5
53.2
17.1
15.6
12.5
10.9
99.8
97.5
4.5
4.0
Stock Watch
March 30, 2016
Company Name
Reco
CMP
Target
Mkt Cap
Sales ( Čcr )
OPM(%)
EPS (Č)
PER(x)
P/BV(x)
RoE(%)
EV/Sales(x)
(Č)
Price ( Č)
( Č cr )
FY16E FY17E
FY16E
FY17E
FY16E
FY17E
FY16E
FY17E
FY16E
FY17E
FY16E
FY17E
FY16E
FY17E
FMCG
Dabur India
Accumulate
245
267
43,029
9,370
10,265
17.1
17.2
7.3
8.1
33.4
30.2
10.1
8.2
33.7
30.6
4.5
4.1
GlaxoSmith Con*
Neutral
6,031
-
25,362
4,919
5,742
17.2
17.4
168.3
191.2
35.8
31.5
10.2
8.7
28.8
28.9
4.7
4.0
Godrej Consumer
Neutral
1,329
-
45,252
10,168
12,886
16.1
16.1
32.1
38.4
41.4
34.6
8.4
7.8
19.7
21.0
4.6
3.6
HUL
Neutral
862
-
186,417
34,940
38,957
17.5
17.7
20.8
24.7
41.4
34.9
46.1
36.8
110.5
114.2
5.1
4.6
ITC
Accumulate
320
359
257,672
36,804
38,776
37.9
37.9
12.2
12.9
26.3
24.8
7.3
6.4
27.7
25.8
6.6
6.2
Marico
Neutral
240
-
30,964
6,551
7,766
15.7
16.0
10.4
12.5
23.1
19.2
6.7
5.6
33.2
32.4
4.7
3.9
Nestle*
Buy
5,326
6,646
51,352
11,291
12,847
22.2
22.3
158.9
184.6
33.5
28.9
17.5
15.8
55.0
57.3
4.4
3.8
Tata Global
Buy
119
144
7,529
8,635
9,072
9.8
9.9
6.5
7.6
18.4
15.7
1.8
1.8
6.8
7.4
0.8
0.8
IT
HCL Tech^
Buy
811
1,038
114,297
42,038
47,503
21.2
21.5
51.5
57.7
15.7
14.1
3.4
2.6
21.5
18.8
2.3
1.9
Infosys
Accumulate
1,199
1,347
276,291
61,850
69,981
27.5
27.5
59.4
65.7
20.2
18.3
4.3
3.7
21.2
20.1
3.7
3.2
TCS
Buy
2,468
2,854
486,272
108,487
122,590
28.3
28.5
122.8
138.4
20.1
17.8
7.6
6.9
38.0
38.9
4.1
3.6
Tech Mahindra
Accumulate
468
530
45,259
26,524
29,177
16.2
17.0
28.8
33.6
16.2
13.9
3.1
2.7
19.3
19.1
1.5
1.3
Wipro
Buy
553
680
136,578
50,808
56,189
23.7
23.8
37.3
40.7
14.8
13.6
2.8
2.6
19.2
17.7
2.2
1.8
Media
D B Corp
Buy
305
356
5,608
2,241
2,495
27.8
27.9
21.8
25.6
14.0
11.9
3.7
3.2
26.7
28.5
2.4
2.2
HT Media
Neutral
77
-
1,781
2,495
2,603
11.2
11.2
7.3
8.6
10.5
8.9
0.8
0.8
7.4
8.1
0.2
0.2
Jagran Prakashan
Buy
156
189
5,100
2,170
2,355
27.2
26.2
8.9
9.9
17.5
15.8
3.7
3.2
20.9
20.5
2.2
2.1
Sun TV Network
Neutral
368
-
14,483
2,779
3,196
70.2
70.5
22.8
27.3
16.1
13.5
4.0
3.6
26.7
28.3
5.0
4.3
Hindustan Media
Neutral
248
-
1,818
920
1,031
20.0
20.0
19.2
20.9
12.9
11.9
2.1
1.8
16.4
15.3
1.5
1.3
Ventures
Metals & Mining
Coal India
Buy
295
380
186,143
76,167
84,130
19.9
22.3
22.4
25.8
13.1
11.4
4.7
4.6
35.5
41.0
1.8
1.6
Hind. Zinc
Neutral
170
-
71,746
14,641
14,026
50.4
50.4
17.7
16.0
9.6
10.6
1.5
1.3
16.2
13.2
2.5
2.4
Hindalco
Neutral
84
-
17,428
104,356
111,186
8.7
9.5
6.7
11.1
12.6
7.6
0.5
0.4
3.5
5.9
0.7
0.6
JSW Steel
Neutral
1,233
-
29,808
42,308
45,147
16.4
20.7
(10.3)
49.5
24.9
1.4
1.3
(1.0)
5.6
1.8
1.6
NMDC
Neutral
99
-
39,330
8,237
10,893
46.6
44.5
10.0
11.7
10.0
8.5
1.1
1.0
12.5
13.0
4.6
3.5
SAIL
Neutral
42
-
17,305
45,915
53,954
7.2
10.5
1.5
4.4
27.8
9.6
0.4
0.4
2.3
4.1
1.0
0.9
Vedanta
Neutral
88
-
26,000
71,445
81,910
26.2
26.3
12.9
19.2
6.8
4.6
0.5
0.4
7.2
8.9
0.8
0.6
Tata Steel
Neutral
304
-
29,515
126,760
137,307
8.9
11.3
6.4
23.1
47.8
13.2
1.0
0.9
2.0
7.1
0.8
0.8
Oil & Gas
Cairn India
Neutral
155
-
28,967
11,323
12,490
49.4
51.0
20.7
20.7
7.5
7.5
0.5
0.5
6.4
6.1
1.6
1.0
GAIL
Neutral
347
-
44,054
64,856
70,933
9.1
9.6
24.0
28.9
14.5
12.0
1.2
1.2
8.8
9.6
0.9
0.8
ONGC
Neutral
213
-
182,018
154,564
167,321
36.8
37.4
28.6
32.5
7.4
6.6
1.0
0.9
12.7
13.5
1.4
1.3
Stock Watch
March 30, 2016
Company Name
Reco
CMP
Target
Mkt Cap
Sales ( Čcr )
OPM(%)
EPS (Č)
PER(x)
P/BV(x)
RoE(%)
EV/Sales(x)
(Č)
Price ( Č)
( Č cr )
FY16E FY17E
FY16E
FY17E
FY16E
FY17E
FY16E
FY17E
FY16E
FY17E
FY16E
FY17E
FY16E
FY17E
Oil & Gas
Petronet LNG
Neutral
245
-
18,383
29,691
31,188
5.8
6.2
12.8
13.4
19.2
18.3
2.9
2.6
15.8
14.8
0.7
0.7
Indian Oil Corp
Buy
394
455
95,722
359,607
402,760
5.9
6.1
42.5
48.7
9.3
8.1
1.2
1.1
14.1
14.4
0.4
0.3
Reliance Industries
Accumulate
1,035
1,150
335,481
304,775
344,392
12.6
13.4
91.3
102.6
11.4
10.1
1.3
1.2
11.8
12.0
1.0
0.9
Pharmaceuticals
Alembic Pharma
Neutral
593
-
11,176
3,274
3,802
26.9
19.4
35.0
28.7
16.9
20.7
7.5
5.7
55.6
31.2
3.4
2.8
Aurobindo Pharma
Buy
735
856
43,033
14,923
17,162
22.0
23.0
35.7
42.8
20.6
17.2
6.1
4.6
34.0
30.2
3.3
2.8
Aventis*
Accumulate
3,963
4,242
9,128
2,082
2,371
17.4
20.8
118.2
151.5
33.5
26.2
4.9
3.9
19.9
25.5
4.1
3.4
Cadila Healthcare
Accumulate
315
352
32,233
10,224
11,840
21.0
22.0
14.6
17.6
21.6
17.9
5.9
4.6
30.8
29.0
3.2
2.7
Cipla
Buy
504
605
40,519
13,979
16,447
20.2
18.6
25.7
27.5
19.6
18.3
3.2
2.8
17.6
16.1
2.9
2.4
Dr Reddy's
Buy
2,945
3,933
50,225
16,838
19,575
25.0
23.1
167.5
178.8
17.6
16.5
3.7
3.1
23.1
20.4
2.9
2.5
Dishman Pharma
Neutral
338
-
2,729
1,733
1,906
21.5
21.5
17.0
19.9
19.9
17.0
2.0
1.8
10.5
11.2
2.1
1.8
GSK Pharma*
Neutral
3,660
-
31,005
2,870
3,158
20.0
22.1
59.5
68.3
61.5
53.6
18.2
18.7
28.5
34.3
10.3
9.4
Indoco Remedies
Neutral
280
-
2,578
1,033
1,199
15.9
18.2
9.4
13.6
29.8
20.6
4.4
3.8
15.7
19.7
2.6
2.2
Ipca labs
Buy
588
900
7,419
3,363
3,909
12.9
18.6
13.4
28.0
43.9
21.0
3.1
2.8
7.4
14.0
2.5
2.1
Lupin
Accumulate
1,401
1,560
63,147
13,092
16,561
25.0
27.0
50.4
68.3
27.8
20.5
5.7
4.5
22.8
24.7
4.5
3.5
Sun Pharma
Buy
794
950
191,102
28,163
32,610
25.8
30.7
17.4
26.9
45.6
29.5
4.3
3.8
13.0
16.6
6.3
5.2
Power
Tata Power
Neutral
61
-
16,606
35,923
37,402
22.6
22.8
4.1
5.2
15.1
11.9
1.2
1.1
7.5
9.3
1.4
1.3
NTPC
Accumulate
127
146
104,965
87,271
99,297
23.5
23.5
11.8
13.3
10.8
9.6
1.2
1.1
11.5
12.2
2.2
2.0
Power Grid
Buy
138
170
72,353
20,702
23,361
86.7
86.4
12.1
13.2
11.5
10.5
1.7
1.5
15.6
15.1
8.4
7.8
Real Estate
MLIFE
Buy
426
554
1,748
697
1,011
14.9
19.3
13.8
20.1
30.9
21.2
1.2
1.1
3.8
5.3
3.8
2.6
Telecom
Bharti Airtel
Neutral
355
-
141,748
101,748
109,191
32.1
31.7
12.0
12.5
29.6
28.4
2.0
1.9
6.9
6.7
2.0
1.8
Idea Cellular
Neutral
107
-
38,561
34,282
36,941
32.0
31.5
5.9
6.2
18.2
17.3
1.7
1.5
9.9
9.3
1.7
1.6
zOthers
Abbott India
Neutral
4,617
-
9,810
2,715
3,153
14.5
14.1
134.3
152.2
34.4
30.3
8.6
7.1
27.4
25.6
3.3
2.8
Bajaj Electricals
Buy
191
237
1,928
4,719
5,287
5.2
5.8
8.6
12.7
22.3
15.1
2.6
2.2
11.4
14.8
0.4
0.4
Finolex Cables
Neutral
264
-
4,044
2,520
2,883
12.2
12.0
12.7
14.2
20.9
18.6
2.8
2.5
13.6
13.5
1.4
1.1
Goodyear India*
Buy
477
582
1,099
1,800
1,600
11.7
11.5
58.7
52.9
8.1
9.0
1.8
1.6
24.6
18.7
0.4
0.4
Hitachi
Neutral
1,125
-
3,060
1,779
2,081
7.8
8.8
21.8
33.4
51.6
33.7
8.3
6.7
17.4
22.1
1.8
1.5
Jyothy Laboratories
Neutral
280
-
5,064
1,620
1,847
11.5
11.5
7.3
8.5
38.4
33.0
5.0
4.6
13.3
14.4
3.0
2.5
MRF
Buy
36,798
45,575
15,607
20,316
14,488
21.4
21.1
5,488.0
3,798.0
6.7
9.7
2.3
1.9
41.1
21.2
0.7
1.0
Page Industries
Neutral
11,008
-
12,278
1,929
2,450
19.8
20.1
229.9
299.0
47.9
36.8
21.1
14.7
52.1
47.1
6.4
5.0
Stock Watch
March 30, 2016
Company Name
Reco
CMP
Target
Mkt Cap
Sales ( Čcr )
OPM(%)
EPS (Č)
PER(x)
P/BV(x)
RoE(%)
EV/Sales(x)
(Č)
Price ( Č)
( Č cr )
FY16E
FY17E
FY16E
FY17E
FY16E
FY17E
FY16E
FY17E
FY16E
FY17E
FY16E
FY17E
FY16E
FY17E
zOthers
Relaxo Footwears
Neutral
368
-
4,411
1,767
2,152
12.3
12.5
19.3
25.1
19.1
14.7
4.7
3.6
27.7
27.8
2.6
2.1
Siyaram Silk Mills
Buy
944
1,354
885
1,636
1,815
11.5
11.5
89.9
104.1
10.5
9.1
1.7
1.5
17.9
17.8
0.7
0.6
Styrolution ABS India* Neutral
573
-
1,008
1,271
1,440
8.6
9.2
32.0
41.1
17.9
14.0
1.8
1.6
10.7
12.4
0.8
0.7
TVS Srichakra
Buy
2,302
3,217
1,763
2,035
2,252
15.9
15.3
248.6
268.1
9.3
8.6
4.0
2.9
43.6
33.9
0.9
0.8
HSIL
Accumulate
272
302
1,969
2,123
2,384
16.1
16.5
15.0
18.9
18.1
14.4
1.4
1.3
8.0
9.4
1.3
1.1
Kirloskar Engines India
Neutral
207
-
2,994
2,403
2,554
8.6
9.9
9.2
10.5
22.5
19.7
2.2
2.1
9.7
10.7
0.9
0.8
Ltd
M M Forgings
Buy
435
614
525
511
615
21.7
21.6
43.1
55.8
10.1
7.8
1.8
1.5
19.9
21.2
1.2
0.9
Banco Products (India) Neutral
112
-
801
1,208
1,353
11.0
12.3
10.8
14.5
10.4
7.7
1.2
1.1
11.9
14.5
0.6
0.5
Competent Automobiles Neutral
134
-
82
1,040
1,137
3.2
3.1
25.7
28.0
5.2
4.8
0.8
0.7
15.0
14.3
0.1
0.1
Nilkamal
Neutral
1,090
-
1,626
1,871
2,031
10.7
10.5
63.2
69.8
17.3
15.6
2.8
2.4
17.6
16.6
0.9
0.8
Visaka Industries
Buy
101
144
161
1,086
1,197
9.9
10.3
21.5
28.8
4.7
3.5
0.5
0.4
9.6
11.6
0.4
0.3
Transport Corporation of
Neutral
277
-
2,105
2,830
3,350
8.8
9.0
14.4
18.3
19.3
15.1
3.0
2.6
15.4
17.1
0.9
0.8
India
Elecon Engineering
Neutral
54
-
583
1,359
1,482
10.3
13.7
0.8
3.9
66.7
13.8
1.1
1.1
1.6
7.8
0.8
0.7
Surya Roshni
Buy
142
201
623
2,992
3,223
8.1
8.4
14.7
18.3
9.7
7.8
0.9
0.8
9.7
11.0
0.5
0.5
MT Educare
Neutral
164
-
652
286
366
18.3
17.7
7.7
9.4
21.2
17.5
4.5
3.9
20.2
21.1
2.2
1.7
Radico Khaitan
Buy
94
156
1,246
1,517
1,635
12.7
13.4
5.8
7.1
16.1
13.2
1.4
1.3
8.6
9.6
1.3
1.2
Garware Wall Ropes
Buy
335
473
733
862
974
11.2
11.2
24.9
29.6
13.5
11.3
2.0
1.7
15.1
15.4
0.9
0.7
Wonderla Holidays
Neutral
376
-
2,127
206
308
44.0
43.6
9.0
12.9
41.8
29.2
5.7
5.2
13.7
17.8
10.2
6.8
Linc Pen & Plastics
Neutral
183
-
270
340
371
8.3
8.9
10.8
13.2
16.9
13.8
2.7
2.4
16.0
17.1
0.8
0.8
The Byke Hospitality
Neutral
155
-
621
222
287
20.5
20.5
5.6
7.6
27.5
20.5
5.2
4.3
18.9
20.8
2.8
2.2
Interglobe Aviation
Neutral
890
-
32,065
17,022
21,122
20.7
14.5
63.9
53.7
13.9
16.6
20.9
17.1
149.9
103.2
1.9
1.5
Coffee Day Enterprises
Neutral
225
-
4,626
2,692
2,964
17.0
18.6
-
4.7
-
47.4
2.8
2.6
0.2
5.5
2.1
2.0
Ltd
Navneet Education
Neutral
82
-
1,943
998
1,062
24.1
24.0
5.8
6.1
14.2
13.4
3.1
2.8
22.0
20.6
2.0
1.9
Navkar Corporation
Buy
178
265
2,533
365
436
38.3
37.5
5.6
5.9
31.5
30.2
2.0
1.9
6.3
6.1
7.8
6.7
Source: Company, Angel Research; Note: *December year end; #September year end; &October year end; Price as on March 29, 2016
Market Outlook
March 30, 2016
Research Team Tel: 022 - 39357800
DISCLAIMER
Angel Broking Private Limited (hereinafter referred to as “Angel”) is a registered Member of National Stock Exchange of India Limited,
Bombay Stock Exchange Limited and Metropolitian Stock Exchange of India Limited. It is also registered as a Depository Participant with
CDSL and Portfolio Manager with SEBI. It also has registration with AMFI as a Mutual Fund Distributor. Angel Broking Private Limited is a
registered entity with SEBI for Research Analyst in terms of SEBI (Research Analyst) Regulations, 2014 vide registration number
INH000000164. Angel or its associates has not been debarred/ suspended by SEBI or any other regulatory authority for accessing
/dealing in securities Market. Angel or its associates including its relatives/analyst do not hold any financial interest/beneficial ownership
of more than 1% in the company covered by Analyst. Angel or its associates/analyst has not received any compensation / managed or co
-managed public offering of securities of the company covered by Analyst during the past twelve months. Angel/analyst has not served as
an officer, director or employee of company covered by Analyst and has not been engaged in market making activity of the company
covered by Analyst.
This document is solely for the personal information of the recipient, and must not be singularly used as the basis of any investment
decision. Nothing in this document should be construed as investment or financial advice. Each recipient of this document should make
such investigations as they deem necessary to arrive at an independent evaluation of an investment in the securities of the companies
referred to in this document (including the merits and risks involved), and should consult their own advisors to determine the merits and
risks of such an investment.
Reports based on technical and derivative analysis center on studying charts of a stock's price movement, outstanding positions and
trading volume, as opposed to focusing on a company's fundamentals and, as such, may not match with a report on a company's
fundamentals.
The information in this document has been printed on the basis of publicly available information, internal data and other reliable sources
believed to be true, but we do not represent that it is accurate or complete and it should not be relied on as such, as this document is for
general guidance only. Angel Broking Pvt. Limited or any of its affiliates/ group companies shall not be in any way responsible for any
loss or damage that may arise to any person from any inadvertent error in the information contained in this report. Angel Broking Pvt.
Limited has not independently verified all the information contained within this document. Accordingly, we cannot testify, nor make any
representation or warranty, express or implied, to the accuracy, contents or data contained within this document. While Angel Broking
Pvt. Limited endeavors to update on a reasonable basis the information discussed in this material, there may be regulatory, compliance,
or other reasons that prevent us from doing so.
This document is being supplied to you solely for your information, and its contents, information or data may not be reproduced,
redistributed or passed on, directly or indirectly.
Neither Angel Broking Pvt. Limited, nor its directors, employees or affiliates shall be liable for any loss or damage that may arise from or
in connection with the use of this information.
Note: Please refer to the important ‘Stock Holding Disclosure' report on the Angel website (Research Section). Also, please refer to the
latest update on respective stocks for the disclosure status in respect of those stocks. Angel Broking Pvt. Limited and its affiliates may have
investment positions in the stocks recommended in this report.