Market Outlook
March 29, 2016
Market Cues
Domestic Indices
Chg (%)
(Pts)
(Close)
Indian market is expected to open on a flat note tracking the SGX Nifty and mixed
BSE Sensex
(1.5)
(371)
24,966
Asian cues.
Nifty
(1.3)
(101)
7,615
US indices ended on a flat note after trading on a choppy note as stocks showed a
Mid Cap
(1.4)
(143)
10,381
lack of direction on the back of uncertainty in the short term ahead of major
Small Cap
(1.7)
(173)
10,328
economic data, including the jobs report. Federal Reserve Chair Janet Yellen is also
Bankex
(1.9)
(349)
17,762
scheduled to deliver a speech to the Economic Club of New York later today,
potentially providing further cues on the outlook for interest rates.
Global Indices
Chg (%)
(Pts)
(Close)
Most European markets remained closed on Monday on the occasion of Easter.
Dow Jones
0.1
13
17,516
Indian benchmark indices fell sharply on the back of hawkish comments by the Fed
Nasdaq
0.1
5
4,774
officials and better than expected US GDP data increasing the likelihood of a rate
FTSE
(1.5)
(93)
6,106
hike. Caution also prevailed ahead of the F&O expiry and monetary policy due on
Nikkei
0.8
132
17,134
April 5.
Hang Seng
(1.3)
(270)
20,346
News & Result Analysis
Shanghai Com
(0.7)
(22)
2,958
ONGC to invest `34,000cr in K-G basin field
Detailed analysis on Pg2
Advances / Declines
BSE
NSE
Investor’s Ready Reckoner
Advances
702
347
Key Domestic & Global Indicators
Declines
2,007
1,254
Unchanged
153
55
Stock Watch: Latest investment recommendations on 150+ stocks
Refer Pg4 onwards
Volumes (` Cr)
Top Picks
BSE
2,741
CMP
Target
Upside
Company
Sector
Rating
(`)
(`)
(%)
NSE
17,407
Amara Raja Batteries Auto & Auto Ancillary
Buy
885
1,040
17.5
HCL Tech
IT
Buy
812
1,038
27.9
Net Inflows (` Cr)
Net
Mtd
Ytd
LIC Housing Finance Financials
Buy
471
592
25.6
FII
1,066
18,437
(20,736)
Bharat Electronics
Capital Goods
Buy
1,168
1,414
21.1
MFs
(592)
(5,784)
69,333
Navkar Corporation Others
Buy
172
265
54.1
More Top Picks on Pg3
Top Gainers
Price (`)
Chg (%)
Key Upcoming Events
Deltacorp
68
7.4
Previous
Consensus
Date
Region
Event Description
Reading
Expectations
Aia eng
999
7.0
Mar 31 USA
Initial Jobless claims (‘000)
265.0
265.0
Gvkpil
7
6.4
Apr 5 India
RBI Repo Rate%
6.75
6.50
Biocon
479
3.3
Apr 8 India
Imports YoY%
(5.00)
---
Abb
1,236
2.7
Apr 8 India
Exports YoY%
(5.66)
---
More Events on Pg5
Top Losers
Price (`)
Chg (%)
Natcopharm
409
(12.6)
Rtnpower
10
(9.9)
Vedl
88
(9.0)
Hindalco
83
(8.7)
Dlf
107
(7.6)
As on March 28, 2016
Market Outlook
March 29, 2016
ONGC to invest `34,000cr in K-G basin field
ONGC has announced it will invest `34,012cr to bring into production the Krishna
-Godavari Oil & Gas field by 2020. The company plans to invest the amount over
four years, which will bring the cluster 2A and 2B into production mode by the
time. The company expects peak production of the field to be 3.5MT by 2023,
contributing around 15% of its total production.
Also, gas production at its peak is expected at five billion cubic metres, or 25% of
total output. ONGC produced 18MT of crude oil in FY15, less than a half of
India’s total crude oil output of 38MT. The company’s upcoming KG-DWN-98/2
block, popularly known as KG-D5, is divided into 3 vertical clusters. The top
cluster, Cluster 1, is embroiled in a controversy with ONGC accusing migration of
gas from the field to the adjoining fields of Reliance Industries.
The company has said it has not taken any investment decision for Cluster 1 where
it apprehends gas migration. The current decision covers the field development
plan for two areas, 2A and 2B, in Cluster 2. The areas will produce 23.5MT of oil
and 50.7 billion cubic metres of gas over the life of the field. Management said
the company is comfortably placed to fund the capital expenditure through internal
resources.
Cluster 2A has in-place reserves of 94.26MT of crude oil and 21.7 billion cubic
metres of gas while Cluster 2B has in-place reserves of 51.9 billion cubic metres of
gas. Peak production from Cluster 2A is estimated at 77,305 barrel per day and
3.81 million standard cubic meters of gas per day through 15 producer wells.
Peak production from Cluster 2B is estimated at 12.75 million standard cubic
metres of gas per day from eight wells.
Cluster 2 covers 10 discoveries in all. ONGC is yet to notify declaration of
commerciality for Cluster 3 with the directorate general of hydrocarbons. The
project includes setting up a gas process platform, a floating production, storage
and offloading unit for evacuation of oil and gas from the cluster apart from a
network of 430 km sub-sea pipelines. The company plans to produce gas from the
field by June 2019 and oil production will commence by March 2020.
At the CMP of `214 the stock is trading at 6.6x its FY17 E EPS of `32.5; we have a
NEUTRAL rating on the stock.
Economic and Political News
New MVNO policy will allow retailing of spectrum, infra
Court convicts Jharkhand Ispat and its two directors in coal scam
No independent regulator for ATF price: OMCs
Corporate News
Ashok Leyland sells stake worth `299cr in IndusInd Bank
LIC ups stake in IDBI Bank to 14% after preferential issues
HDFC Bank to raise up to `5,000cr infra bonds
HCC bags orders worth `623cr for hydro power, tunnel
L&T Infra Finance plans to raise `200cr through bonds
Fairfax buys 33% in B'luru airport from GVK for Rs 2,149cr
Market Outlook
March 29, 2016
Top Picks HHHHH
Large Cap
Market Cap
CMP
Target
Upside
Company
Rationale
(` Cr)
(`)
(`)
(%)
To outpace battery industry growth due to better technological
Amara Raja Batteries
15,122
885
1,040
17.5
products leading to market share gains in both the automotive
OEM and replacement segments.
Uptick in defense capex by government when coupled with
Bharat Electronics
28,024
1,168
1,414
21.1
BELs strong market positioning, indicate that good times are
ahead for BEL.
The stock is trading at attractive valuations and is factoring all
HCL Tech
1,14,446
812
1,038
27.9
the bad news.
Strong visibility for a robust 20% earnings trajectory, coupled
HDFC Bank
2,64,792
1,048
1,262
20.5
with high quality of earnings on account of high quality retail
business and strategic focus on highly rated corporates.
Back on the growth trend, expect a long term growth of 14%
Infosys
2,77,616
1,205
1,347
11.8
to be a US$20bn in FY2020.
LICHF continues to grow its retail loan book at a healthy pace
with improvement in asset quality. We expect the company to
LIC Housing Finance
23,775
471
592
25.6
post a healthy loan book which is likely to reflect in a strong
earnings growth.
Huge bid pipeline of re-development works at Delhi and other
NBCC
11,223
935
1,089
16.4
State Governments and opportunity from Smart City, positions
NBCC to report strong growth, going forward.
Source: Company, Angel Research
Mid Cap
Market Cap
CMP
Target
Upside
Company
Rationale
(` Cr)
(`)
(`)
(%)
Favorable outlook for the AC industry to augur well for
Cooling products business which is out pacing the market
Blue Star
3,414
380
439
15.7
growth. EMPPAC division's profitability to improve once
operating environment turns around.
Commencement of new projects, downtrend in the interest rate
IL&FS Transport
2,293
70
93
33.4
cycle, to lead to stock re-rating
Economic recovery to have favourable impact on advertising &
circulation revenue growth. Further, the acquisition of a radio
Jagran Prakashan
4,959
152
189
24.6
business (Radio City) would also boost the company's revenue
growth.
Speedier execution and speedier sales, strong revenue visibilty
Mahindra Lifespace
1,763
430
554
28.9
in short-to-long run, attractive valuations
Massive capacity expansion along with rail advantage at ICD
Navkar Corporation
2,452
172
265
54.1
as well CFS augurs well for the company
Earnings boost on back of stable material prices and
Radico Khaitan
1,258
95
156
65.0
favourable pricing environment. Valuation discount to peers
provides additional comfort
Strong brands and distribution network would boost growth
Siyaram Silk Mills
907
968
1,354
39.9
going ahead. Stock currently trades at an inexpensive
valuation.
Source: Company, Angel Research
Market Outlook
March 29, 2016
Key Upcoming Events
Global economic events release calendar
Date
Time
Country
Event Description
Unit
Period
Bloomberg Data
Last Reported Estimated
Mar 29, 2016 7:30PM
US
Consumer Confidence
S.A./ 1985=100
Mar
92.20
94.00
Mar 30, 2016 2:30PM
Euro Zone
Euro-Zone Consumer Confidence
Value
Mar F
(9.70)
(9.70)
Mar 31, 2016 6:00PM
US
Initial Jobless claims
Thousands
Mar 26
265.00
265.00
1:25PM
Germany
Unemployment change (000's)
Thousands
Mar
(10.00)
(6.00)
2:00PM
UK
GDP (YoY)
% Change
4Q F
1.90
1.90
Apr 1, 2016
1:25PM
Germany
PMI Manufacturing
Value
Mar F
50.40
50.40
2:00PM
UK
PMI Manufacturing
Value
Mar
50.80
51.20
6:30AM
China
PMI Manufacturing
Value
Mar
49.00
49.30
6:00PM
US
Change in Nonfarm payrolls
Thousands
Mar
242.00
210.00
6:00PM
US
Unnemployment rate
%
Mar
4.90
4.90
Apr 5, 2016
1:25PM
Germany
PMI Services
Value
Mar F
55.50
--
11:00AM
India
RBI Reverse Repo rate
%
Apr 5
5.75
5.50
11:00AM
India
RBI Repo rate
%
Apr 5
6.75
6.50
11:00AM
India
RBI Cash Reserve ratio
%
Apr 5
4.00
4.00
Apr 8, 2016
India
Imports YoY%
% Change
Mar
(5.00)
--
India
Exports YoY%
% Change
Mar
(5.66)
--
2:00PM
UK
Industrial Production (YoY)
% Change
Feb
0.20
--
Apr 11, 2016
7:00AM
China
Consumer Price Index (YoY)
% Change
Mar
2.30
--
Apr 12, 2016
2:00PM
UK
CPI (YoY)
% Change
Mar
0.30
--
5:30PM
India
Industrial Production YoY
% Change
Feb
(1.50)
--
Apr 13, 2016
US
Producer Price Index (mom)
% Change
Mar
(0.60)
--
China
Exports YoY%
% Change
Mar
(25.40)
--
Source: Bloomberg, Angel Research
Market Outlook
March 29, 2016
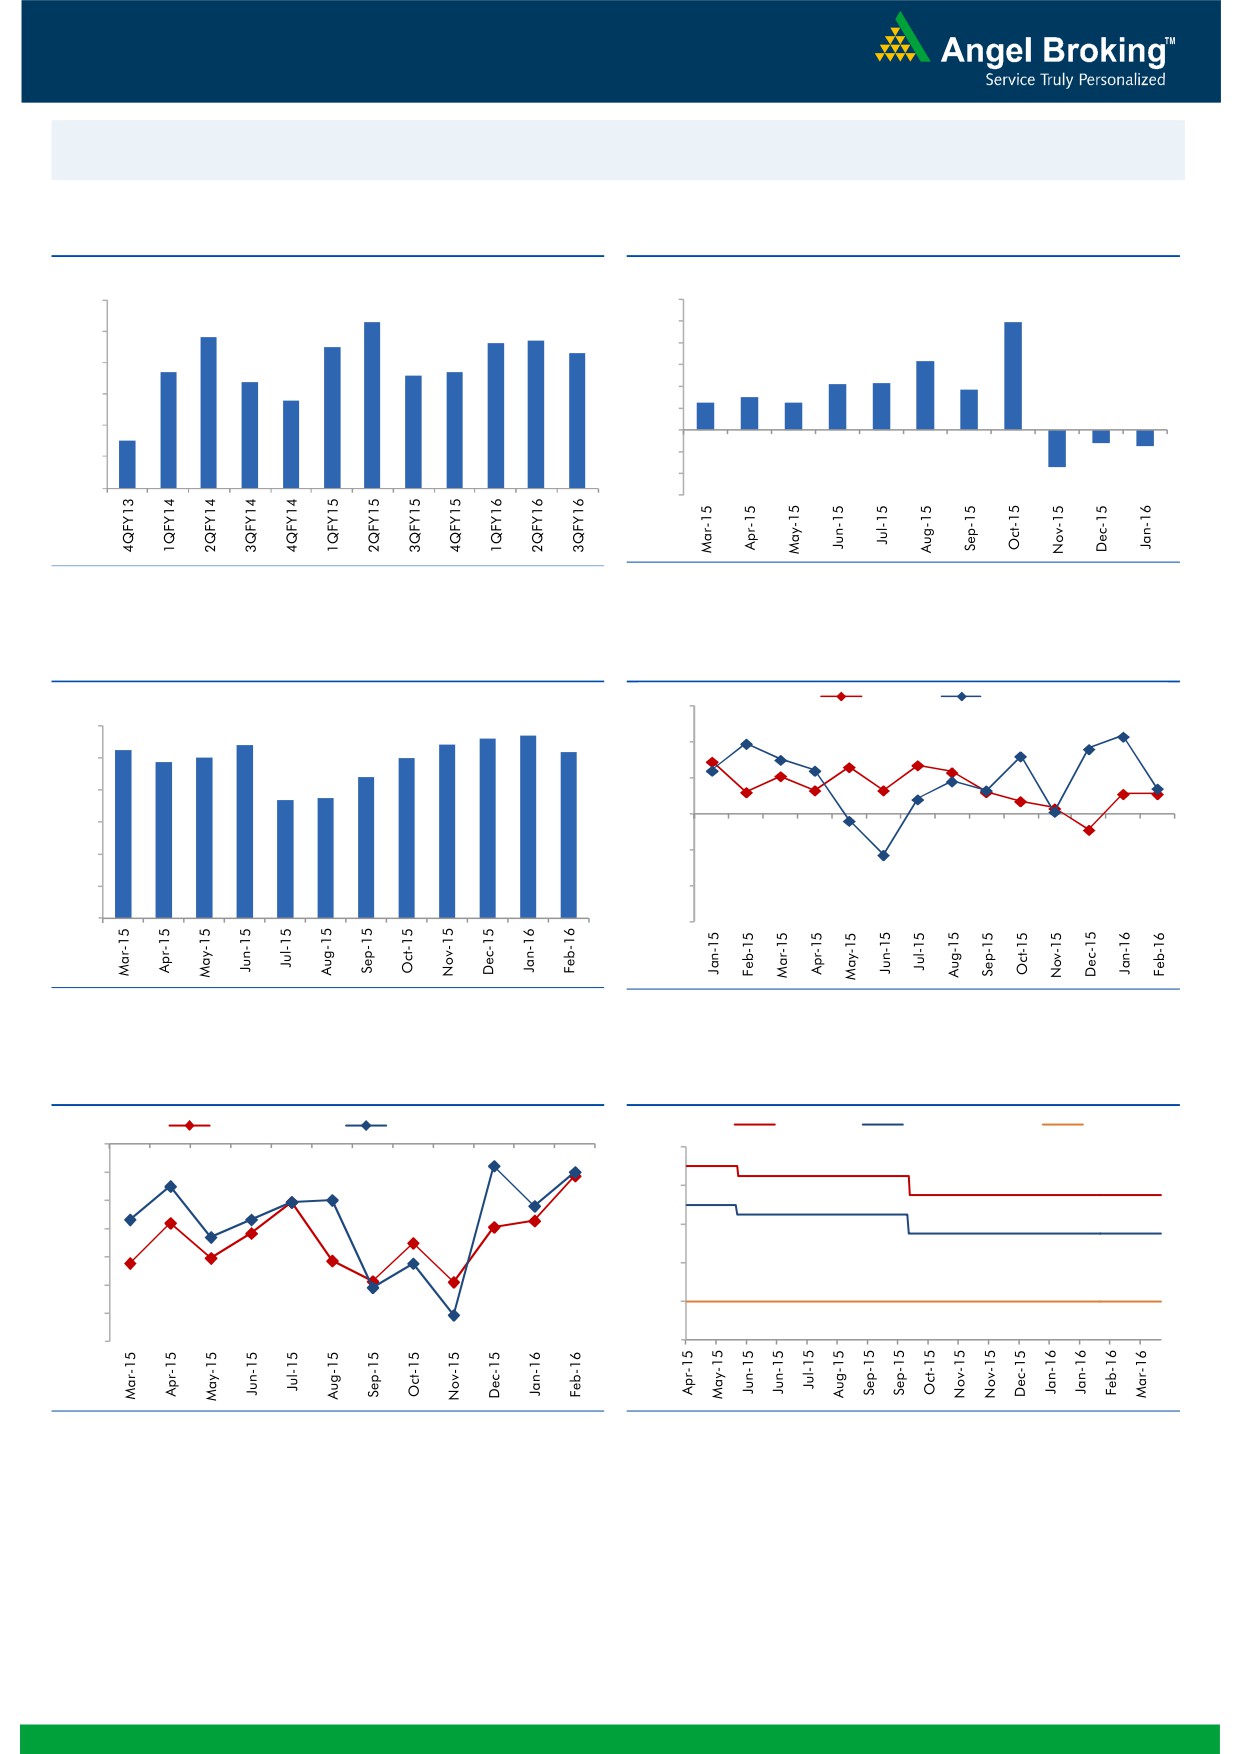
Macro watch
Exhibit 1: Quarterly GDP trends
Exhibit 2: IIP trends
(%)
(%)
9.0
8.3
12.0
9.9
7.8
7.7
10.0
8.0
7.5
7.6
7.3
8.0
6.3
6.7
6.6
6.7
7.0
6.4
6.0
4.2
4.3
3.7
5.8
4.0
2.5
3.0
2.5
6.0
2.0
5.0
4.5
-
4.0
(2.0)
(1.2)
(1.5)
(4.0)
3.0
(3.4)
(6.0)
Source: CSO, Angel Research
Source: MOSPI, Angel Research
Exhibit 3: Monthly CPI inflation trends
Exhibit 4: Manufacturing and services PMI
Mfg. PMI
Services PMI
(%)
56.0
5.6
5.7
6.0
5.4
5.4
5.3
5.2
4.9
5.0
5.0
54.0
5.0
4.4
3.7
3.7
52.0
4.0
50.0
3.0
2.0
48.0
1.0
46.0
-
44.0
Source: MOSPI, Angel Research
Source: Market, Angel Research; Note: Level above 50 indicates expansion
Exhibit 5: Exports and imports growth trends
Exhibit 6: Key policy rates
(%)
Exports yoy growth
Imports yoy growth
(%)
Repo rate
Reverse Repo rate
CRR
0.0
8.00
(5.0)
7.00
(10.0)
(15.0)
6.00
(20.0)
5.00
(25.0)
4.00
(30.0)
(35.0)
3.00
Source: Bloomberg, Angel Research
Source: RBI, Angel Research
Market Outlook
March 29, 2016
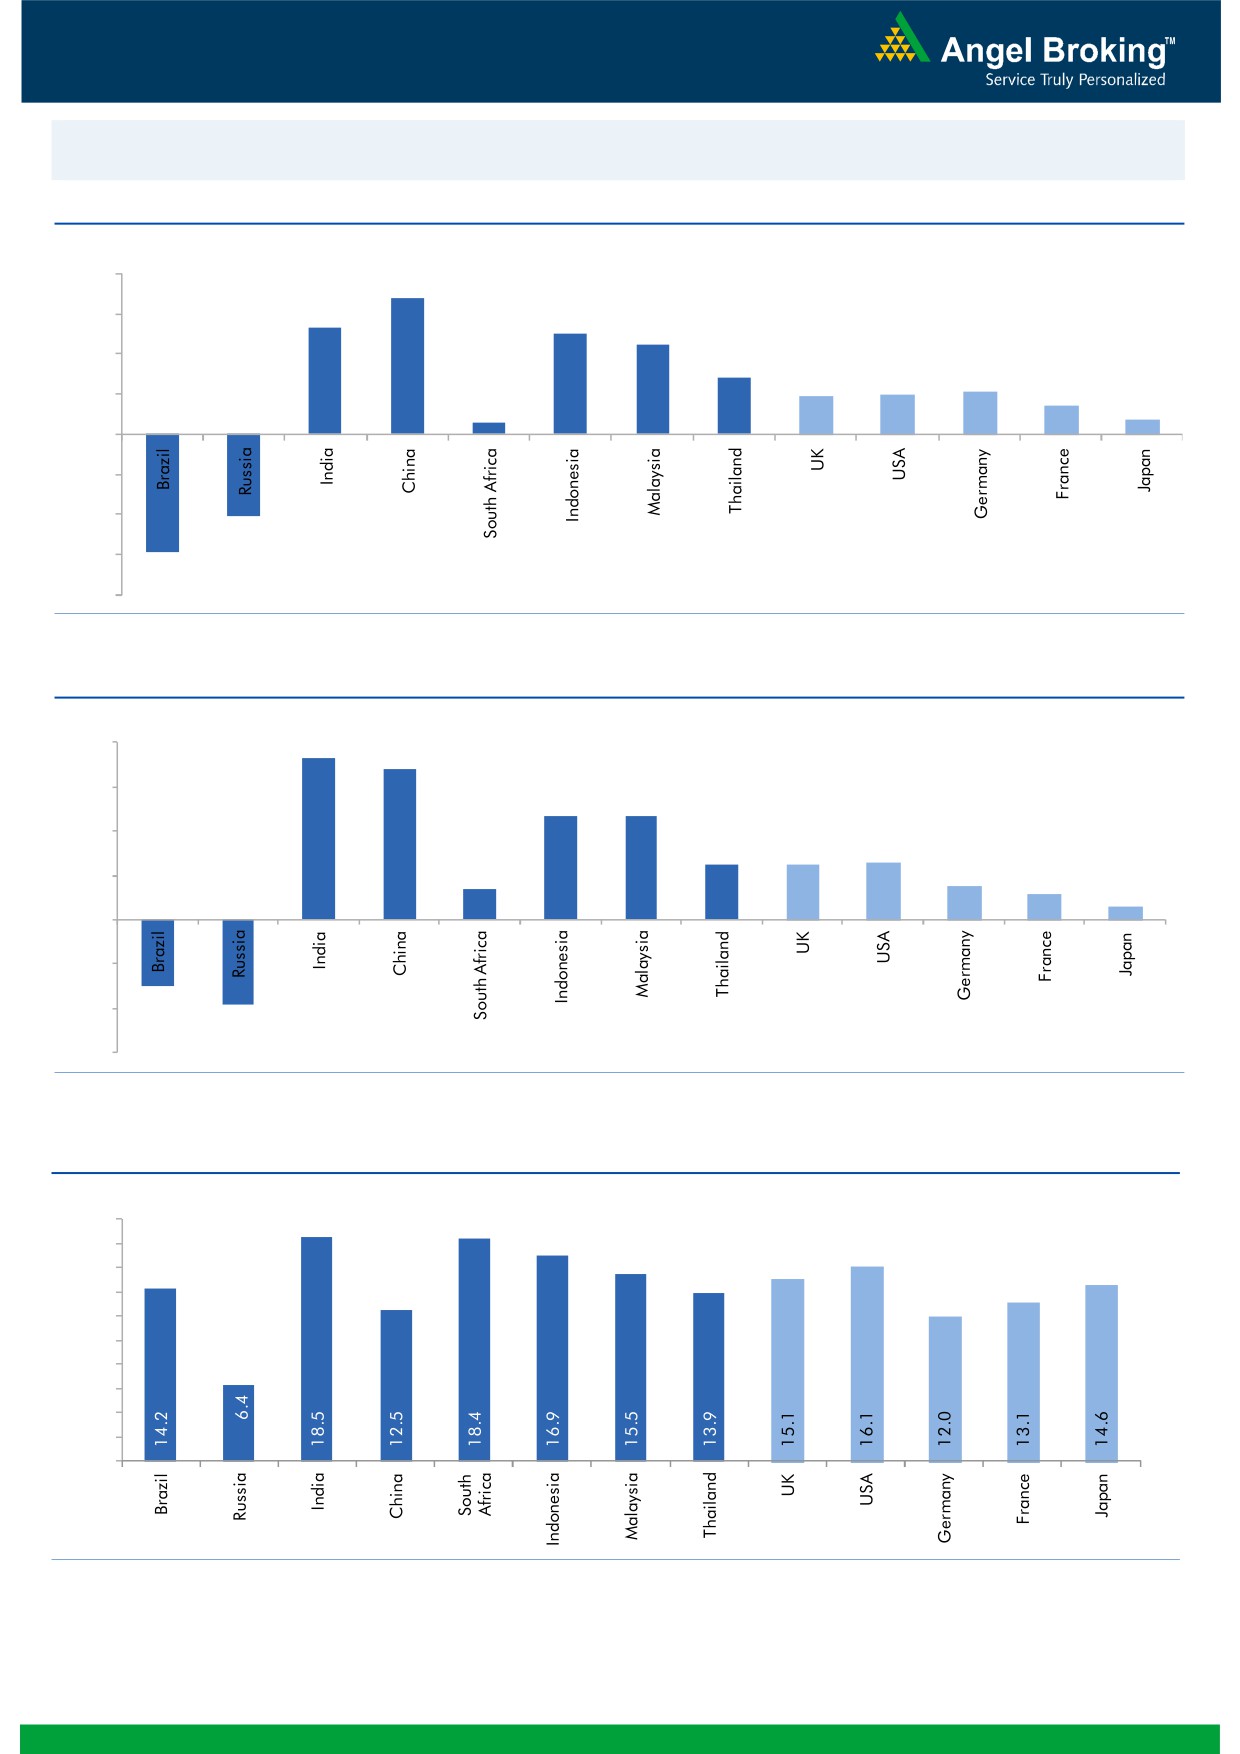
Global watch
Exhibit 1: Latest quarterly GDP Growth (%, yoy) across select developing and developed countries
(%)
8.0
6.8
6.0
5.3
5.0
4.5
4.0
2.8
1.9
2.0
2.1
1.4
2.0
0.6
0.7
-
(2.0)
(4.0)
(4.1)
(6.0)
(5.9)
(8.0)
Source: Bloomberg, Angel Research
Exhibit 2: 2015 GDP Growth projection by IMF (%, yoy) across select developing and developed countries
(%)
8.0
7.3
6.8
6.0
4.7
4.7
4.0
2.5
2.5
2.6
1.4
1.5
2.0
1.2
0.6
-
(2.0)
(3.0)
(4.0)
(3.8)
(6.0)
Source: IMF, Angel Research
Exhibit 3: One year forward P-E ratio across select developing and developed countries
(x)
20.0
18.0
16.0
14.0
12.0
10.0
8.0
6.0
4.0
2.0
-
Source: IMF, Angel Research
Market Outlook
March 29, 2016
Exhibit 4: Relative performance of indices across globe
Returns (%)
Country
Name of index
Closing price
1M
3M
1YR
Brazil
Bovespa
50,838
20.8
12.3
(1.3)
Russia
Micex
1,849
2.9
7.7
16.9
India
Nifty
7,615
5.3
(2.2)
(11.2)
China
Shanghai Composite
2,958
7.9
(18.8)
(17.4)
South Africa
Top 40
46,349
6.1
3.2
(0.8)
Mexico
Mexbol
45,623
4.8
5.7
4.6
Indonesia
LQ45
828
2.1
7.4
(12.5)
Malaysia
KLCI
1,702
2.7
3.6
(5.6)
Thailand
SET 50
893
4.9
9.4
(11.6)
USA
Dow Jones
17,535
6.4
0.7
(1.0)
UK
FTSE
6,106
2.4
0.4
(10.9)
Japan
Nikkei
17,134
7.7
(9.4)
(12.3)
Germany
DAX
9,851
4.6
(6.2)
(17.0)
France
CAC
4,330
2.2
(7.4)
(14.5)
Source: Bloomberg, Angel Research
Stock Watch
March 29, 2016
Company Name
Reco
CMP
Target
Mkt Cap
Sales ( Čcr )
OPM(%)
EPS (Č)
PER(x)
P/BV(x)
RoE(%)
EV/Sales(x)
(Č)
Price ( Č)
( Č cr )
FY16E FY17E
FY16E
FY17E
FY16E
FY17E
FY16E
FY17E
FY16E
FY17E
FY16E
FY17E
FY16E
FY17E
Agri / Agri Chemical
Rallis
Neutral
168
-
3,268
2,097
2,415
14.4
14.4
9.5
11.0
17.7
15.3
3.5
3.0
21.1
21.3
1.6
1.4
United Phosphorus
Accumulate
452
480
19,371
12,500
14,375
18.3
18.3
29.8
35.9
15.2
12.6
2.8
2.4
20.0
20.3
1.6
1.4
Auto & Auto Ancillary
Ashok Leyland
Accumulate
105
111
29,796
17,995
21,544
11.4
11.6
3.4
4.7
30.8
22.3
5.4
5.0
17.7
22.2
1.6
1.3
Bajaj Auto
Accumulate
2,356
2,585
68,160
22,709
25,860
20.9
20.1
129.0
143.6
18.3
16.4
5.6
4.8
30.7
29.4
2.5
2.2
Bharat Forge
Neutral
879
-
20,458
7,351
8,318
19.9
19.7
31.2
36.5
28.2
24.1
5.0
4.3
19.3
19.2
2.9
2.5
Eicher Motors
Accumulate
18,410
20,044
50,005
15,556
16,747
15.5
17.3
464.8
597.5
39.6
30.8
14.5
10.6
36.2
34.3
3.1
2.9
Gabriel India
Accumulate
90
101
1,292
1,415
1,544
8.7
9.0
4.6
5.4
19.6
16.7
3.5
3.2
18.1
18.9
0.9
0.8
Hero Motocorp
Neutral
2,848
-
56,875
28,244
30,532
15.5
15.9
156.7
168.5
18.2
16.9
7.3
6.2
39.9
36.4
1.9
1.7
Jamna Auto Industries Buy
138
160
1,105
1,281
1,473
11.2
11.5
7.6
9.2
18.2
15.0
4.6
3.8
25.4
25.2
0.9
0.8
L G Balakrishnan & Bros Neutral
437
-
686
1,254
1,394
11.6
11.8
35.9
41.7
12.2
10.5
1.7
1.5
13.5
13.8
0.7
0.6
Mahindra and Mahindra Accumulate
1,243
1,364
77,220
38,416
42,904
13.7
13.9
54.8
63.4
22.7
19.6
3.5
3.1
15.4
15.8
1.7
1.4
Maruti
Neutral
3,638
-
109,903
57,865
68,104
16.4
16.7
176.3
225.5
20.6
16.1
4.0
3.4
19.4
21.2
1.7
1.4
Minda Industries
Accumulate
938
1,047
1,489
2,523
2,890
8.7
9.0
55.0
65.4
17.1
14.4
3.3
2.7
19.3
18.7
0.7
0.6
Motherson Sumi
Buy
243
313
32,182
39,343
45,100
8.8
9.1
10.1
12.5
24.1
19.5
7.6
6.0
35.3
34.4
0.9
0.8
Rane Brake Lining
Buy
352
465
279
454
511
11.5
12.0
25.2
31.0
14.0
11.4
2.1
1.9
14.9
16.6
0.7
0.7
Setco Automotive
Neutral
30
-
397
594
741
12.7
13.7
1.7
3.2
17.5
9.3
1.8
1.6
10.4
16.9
1.1
0.9
Tata Motors
Neutral
363
-
104,878
259,686
273,957
13.0
13.4
25.9
29.5
14.0
12.3
1.8
1.6
8.0
9.0
0.6
0.6
TVS Motor
Neutral
314
-
14,932
11,263
13,122
6.9
8.5
9.2
15.0
34.2
21.0
7.8
6.2
22.7
29.6
1.3
1.1
Amara Raja Batteries
Buy
885
1,040
15,122
4,892
5,871
17.4
17.6
28.8
37.1
30.7
23.9
7.2
5.7
23.4
24.1
3.1
2.5
Exide Industries
Buy
136
162
11,581
6,950
7,784
14.4
14.8
6.6
7.3
20.6
18.7
2.6
2.4
12.6
12.8
1.4
1.2
Apollo Tyres
Accumulate
172
183
8,745
12,056
12,714
17.2
16.4
23.0
20.3
7.5
8.5
1.3
1.2
17.7
13.6
0.8
0.8
Ceat
Accumulate
1,052
1,119
4,257
6,041
6,597
14.1
13.7
99.5
111.9
10.6
9.4
2.1
1.7
19.6
18.5
0.9
0.7
JK Tyres
Neutral
83
-
1,888
7,446
7,669
15.2
14.0
19.6
18.4
4.3
4.5
1.1
0.9
25.2
19.5
0.7
0.6
Swaraj Engines
Accumulate
848
919
1,053
552
630
14.2
14.7
44.6
54.1
19.0
15.7
4.4
4.0
23.2
25.6
1.8
1.5
Subros
Neutral
86
-
515
1,293
1,527
11.8
11.9
4.2
6.7
20.4
12.8
1.5
1.4
7.7
11.5
0.7
0.6
Indag Rubber
Neutral
167
-
438
283
329
17.0
17.2
13.0
15.4
12.9
10.8
2.8
2.3
21.8
21.6
1.3
1.0
Capital Goods
ACE
Neutral
38
-
373
660
839
4.7
8.2
1.0
3.9
37.7
9.7
1.2
1.1
3.2
11.3
0.7
0.6
BEML
Accumulate
1,054
1,157
4,391
3,277
4,006
6.0
8.9
36.2
64.3
29.1
16.4
2.0
1.8
5.7
11.7
1.4
1.1
Bharat Electronics
Buy
1,168
1,414
28,024
7,737
8,634
16.8
17.2
54.0
61.5
21.6
19.0
3.1
2.7
39.3
45.6
2.7
2.3
Stock Watch
March 29, 2016
Company Name
Reco
CMP
Target
Mkt Cap
Sales ( Čcr )
OPM(%)
EPS (Č)
PER(x)
P/BV(x)
RoE(%)
EV/Sales(x)
(Č)
Price ( Č)
( Č cr )
FY16E
FY17E
FY16E
FY17E
FY16E
FY17E
FY16E
FY17E
FY16E
FY17E
FY16E
FY17E
FY16E
FY17E
Capital Goods
Voltas
Buy
265
353
8,754
5,363
5,963
8.0
9.1
11.0
13.8
24.1
19.2
3.7
3.2
16.2
17.9
1.6
1.4
BGR Energy
Neutral
102
-
733
3,615
3,181
9.5
9.4
16.7
12.4
6.1
8.2
0.6
0.6
10.0
7.0
0.6
0.8
BHEL
Neutral
113
-
27,695
33,722
35,272
10.8
11.7
10.5
14.2
10.8
8.0
0.8
0.8
7.0
9.0
0.9
0.9
Blue Star
Buy
380
439
3,414
3,548
3,977
6.3
6.9
13.7
17.2
27.7
22.1
7.0
4.5
26.1
25.4
1.1
0.9
Crompton Greaves
Neutral
47
-
2,965
13,484
14,687
4.9
6.2
4.5
7.1
10.5
6.7
0.7
0.7
7.2
10.8
0.3
0.3
Greaves Cotton
Neutral
122
-
2,968
1,655
1,755
16.6
16.8
7.4
7.8
16.4
15.6
3.3
3.1
21.1
20.6
1.7
1.6
Inox Wind
Buy
258
458
5,724
4,980
5,943
17.0
17.5
26.6
31.6
9.7
8.2
2.9
2.1
35.0
30.0
1.3
1.0
KEC International
Neutral
117
-
2,999
8,791
9,716
6.1
6.8
5.4
8.2
21.6
14.2
2.2
2.0
10.0
14.0
0.6
0.5
Thermax
Neutral
743
-
8,847
6,413
7,525
7.4
8.5
30.5
39.3
24.3
18.9
3.8
3.3
15.0
17.0
1.4
1.1
VATech Wabag
Neutral
530
-
2,886
2,722
3,336
7.9
8.1
19.5
24.6
27.2
21.5
2.9
2.5
11.1
12.4
1.1
0.9
Cement
ACC
Neutral
1,378
-
25,869
13,151
14,757
16.4
18.3
63.9
83.4
21.6
16.5
2.8
2.6
13.3
16.1
1.8
1.5
Ambuja Cements
Neutral
230
-
35,624
11,564
12,556
19.4
20.7
8.9
10.1
25.8
22.7
3.2
3.1
12.8
13.8
2.7
2.5
HeidelbergCement
Neutral
79
-
1,795
1,772
1,926
13.3
15.4
1.0
3.0
79.2
26.4
2.0
1.9
2.6
7.9
1.6
1.4
India Cements
Neutral
84
-
2,576
4,216
4,840
18.0
19.5
4.0
9.9
21.0
8.5
0.8
0.8
4.0
9.5
0.9
0.8
JK Cement
Neutral
640
-
4,475
3,661
4,742
10.1
15.8
7.5
28.5
85.3
22.5
2.6
2.3
7.5
22.9
1.7
1.3
J K Lakshmi Cement
Neutral
333
-
3,923
2,947
3,616
16.7
19.9
11.5
27.2
29.0
12.3
2.8
2.4
9.8
20.8
1.7
1.4
Mangalam Cements
Neutral
213
-
568
1,053
1,347
10.5
13.3
8.4
26.0
25.3
8.2
1.1
1.0
4.3
12.5
0.9
0.7
Orient Cement
Neutral
146
-
2,996
1,854
2,524
21.2
22.2
7.7
11.1
19.0
13.2
2.7
2.4
13.3
15.7
2.4
1.6
Ramco Cements
Neutral
402
-
9,578
4,036
4,545
20.8
21.3
15.1
18.8
26.6
21.4
3.3
2.9
12.9
14.3
2.9
2.5
Shree Cement^
Neutral
12,310
-
42,885
7,150
8,742
26.7
28.6
228.0
345.5
54.0
35.6
8.0
6.7
15.7
20.3
5.8
4.6
UltraTech Cement
Neutral
3,179
-
87,239
24,669
29,265
18.2
20.6
82.0
120.0
38.8
26.5
4.2
3.7
11.3
14.7
3.6
3.1
Construction
ITNL
Buy
70
93
2,293
7,360
8,825
34.0
35.9
7.0
9.0
10.0
7.7
0.3
0.3
3.2
3.7
3.7
3.6
KNR Constructions
Accumulate
524
603
1,475
937
1,470
14.3
14.0
44.2
38.6
11.9
13.6
2.4
2.1
15.4
15.4
1.7
1.1
Larsen & Toubro
Accumulate
1,206
1,310
112,327
58,870
65,708
8.3
10.3
42.0
53.0
28.7
22.8
2.0
1.8
8.8
11.2
2.1
1.9
Gujarat Pipavav Port
Neutral
178
-
8,596
629
684
51.0
52.2
6.4
5.9
27.8
30.1
3.7
3.4
15.9
12.7
13.3
12.0
MBL Infrastructures
Buy
154
285
636
2,313
2,797
12.2
14.6
19.0
20.0
8.1
7.7
0.8
0.8
11.3
10.6
1.0
0.9
Nagarjuna Const.
Neutral
73
-
4,069
7,892
8,842
8.8
9.1
3.0
5.3
24.4
13.8
1.2
1.1
5.0
8.5
0.8
0.6
PNC Infratech
Accumulate
494
558
2,535
1,873
2,288
13.2
13.5
24.0
32.0
20.6
15.4
2.0
1.8
12.1
12.3
1.5
1.2
Simplex Infra
Neutral
243
-
1,204
5,955
6,829
10.3
10.5
16.0
31.0
15.2
7.9
0.8
0.7
5.3
9.9
0.7
0.6
Stock Watch
March 29, 2016
Company Name
Reco
CMP
Target
Mkt Cap
Sales ( Čcr )
OPM(%)
EPS (Č)
PER(x)
P/BV(x)
RoE(%)
EV/Sales(x)
(Č)
Price ( Č)
( Č cr )
FY16E
FY17E
FY16E
FY17E
FY16E
FY17E
FY16E
FY17E
FY16E
FY17E
FY16E
FY17E
FY16E
FY17E
Construction
Power Mech Projects
Neutral
567
-
833
1,539
1,801
12.8
12.7
59.0
72.1
9.6
7.9
1.4
1.2
18.6
16.8
0.5
0.5
Sadbhav Engineering
Neutral
279
-
4,781
3,481
4,219
10.7
10.8
8.2
11.7
34.0
23.8
3.2
2.8
10.3
13.5
1.6
1.4
NBCC
Buy
935
1,089
11,223
5,816
7,382
6.9
7.7
29.6
39.8
31.6
23.5
5.7
4.5
24.1
26.7
1.7
1.3
MEP Infra
Neutral
38
-
613
1,956
1,876
28.1
30.5
1.3
3.0
29.0
12.6
6.1
4.1
21.2
32.8
1.7
1.7
SIPL
Neutral
90
-
3,168
675
1,042
62.4
64.7
-
-
3.4
3.8
-
-
16.4
11.0
Engineers India
Neutral
164
-
5,524
1,667
1,725
13.5
16.0
9.7
11.4
16.9
14.4
2.0
1.9
11.7
13.4
2.1
2.1
Financials
Allahabad Bank
Neutral
51
-
3,090
8,569
9,392
2.8
2.9
16.3
27.5
3.2
1.9
0.3
0.2
7.6
11.9
-
-
Axis Bank
Buy
423
494
100,714
26,473
31,527
3.5
3.6
35.7
43.5
11.8
9.7
2.0
1.7
17.9
18.9
-
-
Bank of Baroda
Neutral
139
-
32,062
18,485
21,025
1.9
2.0
13.5
21.1
10.3
6.6
0.8
0.7
7.3
10.6
-
-
Bank of India
Neutral
94
-
7,600
15,972
17,271
1.9
2.0
15.3
33.4
6.1
2.8
0.3
0.2
3.6
7.6
-
-
Canara Bank
Neutral
183
-
9,912
15,441
16,945
2.0
2.1
46.6
70.4
3.9
2.6
0.3
0.3
8.0
11.2
-
-
Dena Bank
Neutral
29
-
1,874
3,440
3,840
2.1
2.3
7.3
10.0
4.0
2.9
0.3
0.3
6.1
7.9
-
-
Federal Bank
Neutral
48
-
8,168
3,477
3,999
3.0
3.0
5.0
6.2
9.5
7.6
1.0
0.9
10.6
11.9
-
-
HDFC
Neutral
1,143
-
180,560
10,358
11,852
3.3
3.3
41.1
47.0
27.8
24.3
5.3
4.8
24.7
24.9
-
-
HDFC Bank
Buy
1,048
1,262
264,792
38,309
47,302
4.3
4.3
49.3
61.1
21.2
17.2
3.7
3.2
18.5
19.7
-
-
ICICI Bank
Accumulate
225
254
130,966
34,279
39,262
3.3
3.3
21.0
24.4
10.7
9.2
1.8
1.5
14.4
14.7
-
-
IDBI Bank
Neutral
68
-
12,968
9,625
10,455
1.8
1.8
8.5
14.2
8.0
4.8
0.5
0.5
5.9
9.3
-
-
Indian Bank
Neutral
103
-
4,930
6,160
6,858
2.5
2.5
24.5
29.8
4.2
3.4
0.3
0.3
7.7
8.6
-
-
LIC Housing Finance
Buy
471
592
23,775
3,101
3,745
2.5
2.5
33.0
40.2
14.3
11.7
2.7
2.3
19.7
20.5
-
-
Oriental Bank
Neutral
88
-
2,643
7,643
8,373
2.4
2.4
37.2
45.4
2.4
1.9
0.2
0.2
8.2
9.4
-
-
Punjab Natl.Bank
Neutral
82
-
16,151
23,638
26,557
2.8
2.8
17.9
27.2
4.6
3.0
0.5
0.4
8.5
12.0
-
-
South Ind.Bank
Neutral
17
-
2,350
1,965
2,185
2.5
2.5
2.5
3.3
7.0
5.3
0.7
0.6
9.5
11.7
-
-
St Bk of India
Neutral
188
-
146,290
79,958
86,061
2.6
2.6
13.4
20.7
14.1
9.1
1.2
1.1
11.5
12.8
-
-
Union Bank
Neutral
125
-
8,562
12,646
14,129
2.3
2.4
31.0
39.1
4.0
3.2
0.4
0.4
9.8
11.4
-
-
Vijaya Bank
Neutral
31
-
2,698
3,536
3,827
1.9
1.9
5.5
6.7
5.7
4.7
0.5
0.4
7.8
8.8
-
-
Yes Bank
Neutral
842
-
35,416
7,190
9,011
3.2
3.3
58.2
69.7
14.5
12.1
2.6
2.2
19.2
19.6
-
-
FMCG
Asian Paints
Neutral
845
-
81,086
16,553
19,160
16.0
16.2
17.7
21.5
47.8
39.3
12.7
11.4
29.4
31.2
4.7
4.1
Britannia
Neutral
2,628
-
31,528
8,481
9,795
14.0
14.1
65.5
78.3
40.1
33.6
19.0
15.6
38.3
41.2
3.6
3.1
Colgate
Neutral
824
-
22,420
4,836
5,490
19.5
19.7
48.5
53.2
17.0
15.5
12.5
10.9
99.8
97.5
4.5
4.0
Stock Watch
March 29, 2016
Company Name
Reco
CMP
Target
Mkt Cap
Sales ( Čcr )
OPM(%)
EPS (Č)
PER(x)
P/BV(x)
RoE(%)
EV/Sales(x)
(Č)
Price ( Č)
( Č cr )
FY16E FY17E
FY16E
FY17E
FY16E
FY17E
FY16E
FY17E
FY16E
FY17E
FY16E
FY17E
FY16E
FY17E
FMCG
Dabur India
Accumulate
243
267
42,782
9,370
10,265
17.1
17.2
7.3
8.1
33.2
30.0
10.0
8.1
33.7
30.6
4.5
4.1
GlaxoSmith Con*
Neutral
6,000
-
25,232
4,919
5,742
17.2
17.4
168.3
191.2
35.7
31.4
10.1
8.6
28.8
28.9
4.7
4.0
Godrej Consumer
Neutral
1,322
-
45,013
10,168
12,886
16.1
16.1
32.1
38.4
41.2
34.4
8.4
7.7
19.7
21.0
4.5
3.6
HUL
Neutral
864
-
187,002
34,940
38,957
17.5
17.7
20.8
24.7
41.5
35.0
46.2
36.9
110.5
114.2
5.2
4.6
ITC
Accumulate
322
359
259,321
36,804
38,776
37.9
37.9
12.2
12.9
26.4
25.0
7.3
6.5
27.7
25.8
6.6
6.3
Marico
Neutral
238
-
30,654
6,551
7,766
15.7
16.0
10.4
12.5
22.9
19.0
6.6
5.5
33.2
32.4
4.6
3.9
Nestle*
Buy
5,353
6,646
51,613
11,291
12,847
22.2
22.3
158.9
184.6
33.7
29.0
17.6
15.8
55.0
57.3
4.4
3.8
Tata Global
Buy
119
144
7,536
8,635
9,072
9.8
9.9
6.5
7.6
18.4
15.7
1.8
1.8
6.8
7.4
0.8
0.8
IT
HCL Tech^
Buy
812
1,038
114,446
42,038
47,503
21.2
21.5
51.5
57.7
15.8
14.1
3.4
2.6
21.5
18.8
2.3
1.9
Infosys
Accumulate
1,205
1,347
277,616
61,850
69,981
27.5
27.5
59.4
65.7
20.3
18.3
4.3
3.7
21.2
20.1
3.8
3.2
TCS
Buy
2,474
2,854
487,395
108,487
122,590
28.3
28.5
122.8
138.4
20.1
17.9
7.7
7.0
38.0
38.9
4.1
3.6
Tech Mahindra
Accumulate
475
530
45,975
26,524
29,177
16.2
17.0
28.8
33.6
16.5
14.1
3.2
2.7
19.3
19.1
1.5
1.3
Wipro
Buy
555
680
137,134
50,808
56,189
23.7
23.8
37.3
40.7
14.9
13.6
2.8
2.6
19.2
17.7
2.2
1.8
Media
D B Corp
Buy
303
356
5,566
2,241
2,495
27.8
27.9
21.8
25.6
13.9
11.8
3.6
3.2
26.7
28.5
2.4
2.2
HT Media
Neutral
77
-
1,783
2,495
2,603
11.2
11.2
7.3
8.6
10.5
8.9
0.8
0.8
7.4
8.1
0.2
0.2
Jagran Prakashan
Buy
152
189
4,959
2,170
2,355
27.2
26.2
8.9
9.9
17.0
15.3
3.6
3.1
20.9
20.5
2.2
2.0
Sun TV Network
Neutral
365
-
14,376
2,779
3,196
70.2
70.5
22.8
27.3
16.0
13.4
3.9
3.6
26.7
28.3
4.9
4.3
Hindustan Media
Neutral
249
-
1,829
920
1,031
20.0
20.0
19.2
20.9
13.0
11.9
2.1
1.8
16.4
15.3
1.5
1.3
Ventures
Metals & Mining
Coal India
Buy
294
380
185,417
76,167
84,130
19.9
22.3
22.4
25.8
13.1
11.4
4.7
4.6
35.5
41.0
1.8
1.6
Hind. Zinc
Neutral
168
-
70,922
14,641
14,026
50.4
50.4
17.7
16.0
9.5
10.5
1.5
1.3
16.2
13.2
2.5
2.3
Hindalco
Neutral
83
-
17,212
104,356
111,186
8.7
9.5
6.7
11.1
12.4
7.5
0.4
0.4
3.5
5.9
0.7
0.6
JSW Steel
Neutral
1,228
-
29,676
42,308
45,147
16.4
20.7
(10.3)
49.5
24.8
1.4
1.3
(1.0)
5.6
1.8
1.6
NMDC
Neutral
98
-
38,993
8,237
10,893
46.6
44.5
10.0
11.7
9.9
8.4
1.1
1.0
12.5
13.0
4.5
3.4
SAIL
Neutral
43
-
17,553
45,915
53,954
7.2
10.5
1.5
4.4
28.2
9.7
0.4
0.4
2.3
4.1
1.0
0.9
Vedanta
Neutral
88
-
26,074
71,445
81,910
26.2
26.3
12.9
19.2
6.8
4.6
0.5
0.4
7.2
8.9
0.8
0.6
Tata Steel
Neutral
300
-
29,141
126,760
137,307
8.9
11.3
6.4
23.1
47.2
13.0
1.0
0.9
2.0
7.1
0.8
0.8
Oil & Gas
Cairn India
Neutral
156
-
29,238
11,323
12,490
49.4
51.0
20.7
20.7
7.5
7.6
0.5
0.5
6.4
6.1
1.7
1.0
GAIL
Neutral
358
-
45,361
64,856
70,933
9.1
9.6
24.0
28.9
14.9
12.4
1.3
1.2
8.8
9.6
0.9
0.8
ONGC
Neutral
214
-
183,130
154,564
167,321
36.8
37.4
28.6
32.5
7.5
6.6
1.0
0.9
12.7
13.5
1.4
1.3
Stock Watch
March 29, 2016
Company Name
Reco
CMP
Target
Mkt Cap
Sales ( Čcr )
OPM(%)
EPS (Č)
PER(x)
P/BV(x)
RoE(%)
EV/Sales(x)
(Č)
Price ( Č)
( Č cr )
FY16E FY17E
FY16E
FY17E
FY16E
FY17E
FY16E
FY17E
FY16E
FY17E
FY16E
FY17E
FY16E
FY17E
Oil & Gas
Petronet LNG
Neutral
248
-
18,608
29,691
31,188
5.8
6.2
12.8
13.4
19.4
18.5
2.9
2.6
15.8
14.8
0.7
0.7
Indian Oil Corp
Buy
392
455
95,176
359,607
402,760
5.9
6.1
42.5
48.7
9.2
8.0
1.2
1.1
14.1
14.4
0.4
0.3
Reliance Industries
Accumulate
1,021
1,150
330,654
304,775
344,392
12.6
13.4
91.3
102.6
11.2
10.0
1.3
1.1
11.8
12.0
1.0
0.8
Pharmaceuticals
Alembic Pharma
Neutral
619
-
11,673
3,274
3,802
26.9
19.4
35.0
28.7
17.7
21.6
7.8
5.9
55.6
31.2
3.5
3.0
Aurobindo Pharma
Accumulate
746
856
43,636
14,923
17,162
22.0
23.0
35.7
42.8
20.9
17.4
6.1
4.6
34.0
30.2
3.3
2.8
Aventis*
Neutral
4,101
-
9,444
2,082
2,371
17.4
20.8
118.2
151.5
34.7
27.1
5.1
4.1
19.9
25.5
4.2
3.5
Cadila Healthcare
Accumulate
319
352
32,647
10,224
11,840
21.0
22.0
14.6
17.6
21.8
18.1
6.0
4.7
30.8
29.0
3.3
2.7
Cipla
Buy
524
605
42,133
13,979
16,447
20.2
18.6
25.7
27.5
20.4
19.1
3.3
2.9
17.6
16.1
3.0
2.5
Dr Reddy's
Buy
3,036
3,933
51,767
16,838
19,575
25.0
23.1
167.5
178.8
18.1
17.0
3.8
3.2
23.1
20.4
3.0
2.5
Dishman Pharma
Neutral
340
-
2,745
1,733
1,906
21.5
21.5
17.0
19.9
20.0
17.1
2.0
1.8
10.5
11.2
2.1
1.8
GSK Pharma*
Neutral
3,688
-
31,241
2,870
3,158
20.0
22.1
59.5
68.3
62.0
54.0
18.3
18.8
28.5
34.3
10.4
9.5
Indoco Remedies
Neutral
289
-
2,660
1,033
1,199
15.9
18.2
9.4
13.6
30.7
21.2
4.6
3.9
15.7
19.7
2.7
2.3
Ipca labs
Buy
606
900
7,649
3,363
3,909
12.9
18.6
13.4
28.0
45.2
21.7
3.2
2.8
7.4
14.0
2.6
2.2
Lupin
Neutral
1,495
-
67,368
13,092
16,561
25.0
27.0
50.4
68.3
29.7
21.9
6.1
4.8
22.8
24.7
4.9
3.7
Sun Pharma
Buy
811
950
195,193
28,163
32,610
25.8
30.7
17.4
26.9
46.6
30.2
4.4
3.8
13.0
16.6
6.4
5.3
Power
Tata Power
Neutral
61
-
16,485
35,923
37,402
22.6
22.8
4.1
5.2
15.0
11.8
1.2
1.1
7.5
9.3
1.4
1.3
NTPC
Accumulate
129
146
106,655
87,271
99,297
23.5
23.5
11.8
13.3
11.0
9.7
1.2
1.2
11.5
12.2
2.2
2.0
Power Grid
Buy
139
170
72,719
20,702
23,361
86.7
86.4
12.1
13.2
11.5
10.5
1.7
1.5
15.6
15.1
8.4
7.8
Real Estate
MLIFE
Buy
430
554
1,763
697
1,011
14.9
19.3
13.8
20.1
31.1
21.4
1.2
1.1
3.8
5.3
3.8
2.6
Telecom
Bharti Airtel
Neutral
350
-
139,969
101,748
109,191
32.1
31.7
12.0
12.5
29.2
28.0
2.0
1.9
6.9
6.7
2.0
1.8
Idea Cellular
Neutral
105
-
37,967
34,282
36,941
32.0
31.5
5.9
6.2
17.9
17.0
1.6
1.5
9.9
9.3
1.7
1.6
zOthers
Abbott India
Neutral
4,622
-
9,822
2,715
3,153
14.5
14.1
134.3
152.2
34.4
30.4
8.6
7.1
27.4
25.6
3.3
2.8
Bajaj Electricals
Buy
193
237
1,947
4,719
5,287
5.2
5.8
8.6
12.7
22.5
15.2
2.6
2.3
11.4
14.8
0.4
0.4
Finolex Cables
Neutral
257
-
3,933
2,520
2,883
12.2
12.0
12.7
14.2
20.3
18.1
2.8
2.5
13.6
13.5
1.3
1.1
Goodyear India*
Buy
475
582
1,096
1,800
1,600
11.7
11.5
58.7
52.9
8.1
9.0
1.8
1.6
24.6
18.7
0.4
0.4
Hitachi
Neutral
1,132
-
3,079
1,779
2,081
7.8
8.8
21.8
33.4
51.9
33.9
8.4
6.8
17.4
22.1
1.8
1.5
Jyothy Laboratories
Neutral
281
-
5,082
1,620
1,847
11.5
11.5
7.3
8.5
38.5
33.1
5.0
4.6
13.3
14.4
3.0
2.6
MRF
Buy
36,124
45,575
15,321
20,316
14,488
21.4
21.1
5,488.0
3,798.0
6.6
9.5
2.3
1.8
41.1
21.2
0.7
0.9
Page Industries
Neutral
11,047
-
12,322
1,929
2,450
19.8
20.1
229.9
299.0
48.1
37.0
21.2
14.7
52.1
47.1
6.4
5.0
Stock Watch
March 29, 2016
Company Name
Reco
CMP
Target
Mkt Cap
Sales ( Čcr )
OPM(%)
EPS (Č)
PER(x)
P/BV(x)
RoE(%)
EV/Sales(x)
(Č)
Price ( Č)
( Č cr )
FY16E
FY17E
FY16E
FY17E
FY16E
FY17E
FY16E
FY17E
FY16E
FY17E
FY16E
FY17E
FY16E
FY17E
zOthers
Relaxo Footwears
Neutral
362
-
4,350
1,767
2,152
12.3
12.5
19.3
25.1
18.8
14.5
4.6
3.6
27.7
27.8
2.5
2.0
Siyaram Silk Mills
Buy
968
1,354
907
1,636
1,815
11.5
11.5
89.9
104.1
10.8
9.3
1.8
1.5
17.9
17.8
0.7
0.6
Styrolution ABS India* Neutral
589
-
1,035
1,271
1,440
8.6
9.2
32.0
41.1
18.4
14.3
1.9
1.7
10.7
12.4
0.8
0.7
TVS Srichakra
Buy
2,300
3,217
1,761
2,035
2,252
15.9
15.3
248.6
268.1
9.3
8.6
4.0
2.9
43.6
33.9
0.9
0.8
HSIL
Accumulate
272
302
1,966
2,123
2,384
16.1
16.5
15.0
18.9
18.1
14.4
1.4
1.3
8.0
9.4
1.3
1.1
Kirloskar Engines India
Neutral
210
-
3,037
2,403
2,554
8.6
9.9
9.2
10.5
22.9
20.0
2.2
2.1
9.7
10.7
0.9
0.8
Ltd
M M Forgings
Buy
435
614
525
511
615
21.7
21.6
43.1
55.8
10.1
7.8
1.8
1.5
19.9
21.2
1.2
0.9
Banco Products (India) Neutral
111
-
791
1,208
1,353
11.0
12.3
10.8
14.5
10.3
7.6
1.2
1.1
11.9
14.5
0.6
0.5
Competent Automobiles Neutral
134
-
82
1,040
1,137
3.2
3.1
25.7
28.0
5.2
4.8
0.8
0.7
15.0
14.3
0.1
0.1
Nilkamal
Neutral
1,087
-
1,622
1,871
2,031
10.7
10.5
63.2
69.8
17.2
15.6
2.8
2.4
17.6
16.6
0.9
0.8
Visaka Industries
Buy
102
144
162
1,086
1,197
9.9
10.3
21.5
28.8
4.7
3.5
0.5
0.4
9.6
11.6
0.4
0.3
Transport Corporation of
Neutral
277
-
2,104
2,830
3,350
8.8
9.0
14.4
18.3
19.3
15.1
3.0
2.6
15.4
17.1
0.9
0.8
India
Elecon Engineering
Neutral
54
-
589
1,359
1,482
10.3
13.7
0.8
3.9
67.4
13.9
1.1
1.1
1.6
7.8
0.8
0.7
Surya Roshni
Buy
132
201
580
2,992
3,223
8.1
8.4
14.7
18.3
9.0
7.2
0.8
0.8
9.7
11.0
0.5
0.4
MT Educare
Neutral
160
-
637
286
366
18.3
17.7
7.7
9.4
20.7
17.1
4.4
3.8
20.2
21.1
2.1
1.6
Radico Khaitan
Buy
95
156
1,258
1,517
1,635
12.7
13.4
5.8
7.1
16.2
13.3
1.4
1.3
8.6
9.6
1.3
1.2
Garware Wall Ropes
Buy
326
473
714
862
974
11.2
11.2
24.9
29.6
13.1
11.0
2.0
1.7
15.1
15.4
0.8
0.7
Wonderla Holidays
Neutral
369
-
2,083
206
308
44.0
43.6
9.0
12.9
41.0
28.6
5.6
5.1
13.7
17.8
10.0
6.7
Linc Pen & Plastics
Neutral
188
-
278
340
371
8.3
8.9
10.8
13.2
17.4
14.2
2.8
2.4
16.0
17.1
0.9
0.8
The Byke Hospitality
Neutral
154
-
616
222
287
20.5
20.5
5.6
7.6
27.2
20.3
5.1
4.2
18.9
20.8
2.8
2.2
Interglobe Aviation
Neutral
881
-
31,733
17,022
21,122
20.7
14.5
63.9
53.7
13.8
16.4
20.7
16.9
149.9
103.2
1.9
1.5
Coffee Day Enterprises
Neutral
225
-
4,635
2,692
2,964
17.0
18.6
-
4.7
-
47.5
2.8
2.6
0.2
5.5
2.1
2.0
Ltd
Navneet Education
Neutral
81
-
1,925
998
1,062
24.1
24.0
5.8
6.1
14.1
13.3
3.1
2.7
22.0
20.6
2.0
1.9
Navkar Corporation
Buy
172
265
2,452
365
436
38.3
37.5
5.6
5.9
30.5
29.3
1.9
1.8
6.3
6.1
7.5
6.5
Source: Company, Angel Research; Note: *December year end; #September year end; &October year end; Price as on March 28, 2016
Market Outlook
March 29, 2016
Research Team Tel: 022 - 39357800
DISCLAIMER
Angel Broking Private Limited (hereinafter referred to as “Angel”) is a registered Member of National Stock Exchange of India Limited,
Bombay Stock Exchange Limited and Metropolitian Stock Exchange of India Limited. It is also registered as a Depository Participant with
CDSL and Portfolio Manager with SEBI. It also has registration with AMFI as a Mutual Fund Distributor. Angel Broking Private Limited is a
registered entity with SEBI for Research Analyst in terms of SEBI (Research Analyst) Regulations, 2014 vide registration number
INH000000164. Angel or its associates has not been debarred/ suspended by SEBI or any other regulatory authority for accessing
/dealing in securities Market. Angel or its associates including its relatives/analyst do not hold any financial interest/beneficial ownership
of more than 1% in the company covered by Analyst. Angel or its associates/analyst has not received any compensation / managed or co
-managed public offering of securities of the company covered by Analyst during the past twelve months. Angel/analyst has not served as
an officer, director or employee of company covered by Analyst and has not been engaged in market making activity of the company
covered by Analyst.
This document is solely for the personal information of the recipient, and must not be singularly used as the basis of any investment
decision. Nothing in this document should be construed as investment or financial advice. Each recipient of this document should make
such investigations as they deem necessary to arrive at an independent evaluation of an investment in the securities of the companies
referred to in this document (including the merits and risks involved), and should consult their own advisors to determine the merits and
risks of such an investment.
Reports based on technical and derivative analysis center on studying charts of a stock's price movement, outstanding positions and
trading volume, as opposed to focusing on a company's fundamentals and, as such, may not match with a report on a company's
fundamentals.
The information in this document has been printed on the basis of publicly available information, internal data and other reliable sources
believed to be true, but we do not represent that it is accurate or complete and it should not be relied on as such, as this document is for
general guidance only. Angel Broking Pvt. Limited or any of its affiliates/ group companies shall not be in any way responsible for any
loss or damage that may arise to any person from any inadvertent error in the information contained in this report. Angel Broking Pvt.
Limited has not independently verified all the information contained within this document. Accordingly, we cannot testify, nor make any
representation or warranty, express or implied, to the accuracy, contents or data contained within this document. While Angel Broking
Pvt. Limited endeavors to update on a reasonable basis the information discussed in this material, there may be regulatory, compliance,
or other reasons that prevent us from doing so.
This document is being supplied to you solely for your information, and its contents, information or data may not be reproduced,
redistributed or passed on, directly or indirectly.
Neither Angel Broking Pvt. Limited, nor its directors, employees or affiliates shall be liable for any loss or damage that may arise from or
in connection with the use of this information.
Note: Please refer to the important ‘Stock Holding Disclosure' report on the Angel website (Research Section). Also, please refer to the
latest update on respective stocks for the disclosure status in respect of those stocks. Angel Broking Pvt. Limited and its affiliates may have
investment positions in the stocks recommended in this report.