Market Outlook
September 28, 2015
Dealer’s Diary
Domestic Indices
Chg (%)
(Pts)
(Close)
BSE Sensex
0.2
41
25,864
Indian markets are expected to open in red tracking the SGX Nifty and the Asian
Nifty
0.3
23
7,869
cues.
MID CAP
0.2
24
10,598
The US markets were mixed on Friday, after Federal Reserve Chair Janet Yellen
SMALL CAP
0.6
63
10,942
cleared some of the uncertainty regarding the outlook for interest rates. Fed chief
BSE HC
0.7
130
17,617
Janet Yellen stated that the Fed remains on track to raise interest rates by year's end.
BSE PSU
(1.0)
(65)
6,645
The European markets ended the Friday’s session on a positive note led by
BANKEX
(0.5)
(89)
19,696
comments from Janet Yellen, which provided the clarity investors had been seeking
AUTO
0.1
17
17,317
on the direction of U.S. monetary policy.
METAL
(1.4)
(96)
6,888
OIL & GAS
(0.8)
(66)
8,635
The Indian markets ended modestly higher on Thursday ahead of a long weekend
BSE IT
2.0
227
11,473
and the upcoming monetary policy meeting on Tuesday. Mixed global cues, rupee
weakness and portfolio churning on the eve of the expiry of September derivative
Global Indices
Chg (%)
(Pts)
(Close)
contracts limited potential gains.
Dow Jones
0.7
113
16,315
NASDAQ
(1.0)
(48)
4,686
News & Result Analysis
FTSE
2.5
148
6,109
IDBI Bank proposed to be privatised
Nikkei
1.8
309
17,881
US FDA revokes approval to Sun Pharma's anti epilepsy drug
Refer detailed news analysis on the following page
Hang Seng
0.4
90
21,186
Straits Times
(0.5)
(13)
2,833
Markets Today
Shanghai Com
(1.6)
(50)
3,092
The trend deciding level for the day is 25,828 / 7,856 levels. If NIFTY trades above
this level during the first half-an-hour of trade then we may witness a further rally up
Indian ADR
Chg (%)
(Pts)
(Close)
to 25,985 - 26,107 / 7,907 - 7,946 levels. However, if NIFTY trades below
25,828 / 7,856 levels for the first half-an-hour of trade then it may correct towards
INFY
0.7
0.1
$17.8
25,706 - 25,549 / 7,817 - 7,765 levels.
WIT
0.5
0.1
$11.8
IBN
0.5
0.0
$8.5
Indices
S2
S1
PIVOT
R1
R2
HDB
2.3
1.3
$60.6
SENSEX
25,549
25,706
25,828
25,985
26,107
NIFTY
7,765
7,817
7,856
7,907
7,946
Advances / Declines
BSE
NSE
Advances
1,420
799
Net Inflows (September 23, 2015)
Declines
1,270
685
` cr
Purch
Sales
Net
MTD
YTD
Unchanged
114
72
FII
3,007
4,295
(1,288)
(4,043)
119,718
MFs
1,362
570
793
5,938
76,586
Volumes (` cr)
BSE
2,567
FII Derivatives (September 24, 2015)
` cr
Purch
Sales
Net
Open Interest
NSE
19,664
Index Futures
4,794
5,426
(633)
16,739
Stock Futures
11,234
11,195
39
42,230
Gainers / Losers
Gainer
Loser
Company
Price (`)
chg (%)
Company
Price (`)
chg (%)
SOUTHBANK
24
11.4
SUNASIAN
94
(5.0)
RAJESHEXPO
489
6.4
PMCFIN
1
(4.5)
TV18BRDCST
35
6.3
ONGC
227
(3.7)
OBEROIRLTY
268
6.2
CONCOR
1,356
(3.4)
HINDZINC
143
5.5
VOLTAS
250
(3.1)
Market Outlook
September 28, 2015
IDBI Bank proposed to be privatised
News articles suggest that the Finance Ministry is working on a proposal to
transition IDBI Bank to a model similar to Axis Bank. Recently, comments to this
effect were made by the Finance Minister, which though were not clear on the
timelines, but from the latest news, it appears that the timeline for the same could
be sooner than later. Under the proposal, the government would look to reduce its
stake to 49% in the bank and also hold this stake indirectly through other PSU
financial institutions. If this proposal goes through, this would amount to
privatisation of IDBI Bank and would in our view create room for significant
upsides over a period of time.
Significant valuation gap vis-a-vis private banks creates scope for upsides over the
long-term: On the valuation front, in line with other PSU Banks, IDBI Bank is
trading at 0.7x FY2017E P/ABV (adjusted for SASF and taking into account dilution
due to upcoming government capital infusion), whereas private banks like Axis
Bank are trading at around 2.0x FY2017E P/ABV. However, this gap in valuations
will not be bridged in a short period of time, but will rather be subject to
improvement in IDBI Bank’s actual fundamentals on similar lines as private banks,
which is likely to take several years and entails significant execution risk.
For instance, up to 2004, Axis Bank (at that time known as UTI Bank) used to trade
at an average one-year forward P/ABV multiple of around 1.1x and it took
substantial period for the stock to get re-rated. The re-rating happened gradually
as the bank’s retail business mix increased (and contribution of volatile segments
like treasury reduced), modern channel and technology roll-out took place at a
rapid place (branch, ATM, payment systems, etc.) and market share gains and
earnings growth accelerated to similar levels and consistency as other private
banks like HDFC Bank.
Moreover, the current competitive landscape is a lot tougher than a decade back,
with existing private banks having an already dominant positioning. Also, IDBI
Bank’s own balance sheet too is quite large at Rs3.4 lakh cr, creating challenges
for IDBI Bank to mirror private banks’ growth in their initial phase. Rather, in our
view, initial valuation upsides would likely emerge from scope for improvement in
processes ranging from loan appraisal to staff incentive structures to board
structure to overall management and operational efficiencies, which itself for a
massive organisation like IDBI Bank would be a significantly challenging and long-
drawn out process. That said, for IDBI Bank, one advantage compared to other
PSU banks that may aid the transition process, is that it’s branch network,
technology and staff strength is not burdened by legacy like other PSU bank peers,
which is reflected in the bank’s Opex/Total Assets ratio being lower at 1.2% (vs.
1.8% and 2.0% for PNB and SBI respectively).
Bank’s current fundamentals remain challenged: IDBI Bank’s stock price has
rallied 35% from recent lows, outperforming peers significantly and likely driven by
these developments. Hence, any indications of the proposal not going through or
getting delayed would result in the stock giving up these recent gains. This is
especially as the bank’s current fundamentals are challenged by asset quality
concerns.
Asset quality continues to be weak with total stressed assets at
14.8% in
1QFY2016 as compared to 14.1% in 4QFY2015 and 13.3% in 1QFY2015, and
annualized slippage ratio at 4% in the last two quarters. Exposure to stressed
Market Outlook
September 28, 2015
assets like Power, Metals, Infra, Textiles and Gems & Jewellery is at 39.2%, which
is quite high as compared to other PSU banks (25.3% for PNB, 32.7% for SBI,
23.5% for BOB). ROE is expected to be at a low level of 6-7% in FY2016E. Also,
granularity of loan book and deposits is lower than peers with corporate lending at
67% of total loan book and bulk deposits constituting 49% of total deposits. On
Tier 1 capital, there is some respite as the Government has decided to infuse
`2,229cr in IDBI Bank, which would improve CET 1 from 7.3% to 8.2%; however,
this would still be well below other peer banks (9.3%, 9.5% and 9.2% for PNB,
BOB and SBI respectively).
Notwithstanding the near-term fundamental concerns regarding asset quality and
profitability as well as significant execution risks even if the proposal goes through,
we believe the risk-reward ratio would be favourable considering the substantial
headroom for re-rating of valuations over the longer-term. Overall if the bank
does get privatised, in our view it would be a landmark development and would
likely result in material upsides on the stock even in the short-term considering the
favourable risk-reward outlook. As the event is not confirmed officially, we are not
changing our long-term rating on the stock, but re-iterate that the upside potential
from the event is expected to be significant.
US FDA revokes approval to Sun Pharma's anti epilepsy drug
US Food and Drugs Administration (FDA) has withdrawn an approval granted in
March to Sun Pharma Advanced Research Company's (SPARC) antiepileptic drug
due to regulatory compliance issues at Sun Pharma's Halol plant. SPARC had
earlier received a final approval from USFDA in March 2015 for this product and
was evaluating several marketing partners for commercialization. However SPARC
has now received a complete response letter from the USFDA rescinding its earlier
approval, citing that the compliance status of the manufacturing facility was not
acceptable on the date of approval, The company told that Sun Pharmaceuticals is
working with USFDA in resolving good manufacturing practices deviations at the
facility and has taken several corrective measures.
Economic and Political News
Forex reserves up $631.5 million to $352.02 billion
RBI lets more leverage for companies with partial credit enhancement
Exports languish, 23 sectors out of 30 decline in August
Corporate News
Maruti wage deal: Workers to get `16,800 pm avg salary hike
Nestle steps up marketing for Maggi relaunch
Vedanta seeks increase in iron ore production cap in Goa
Market Outlook
September 28, 2015
Top Picks
Large Cap
Market
CMP
Target
Upside
Company
Sector
Rating
Cap (` Cr)
(`)
(`)
(%)
Aurobindo
Pharma
43,321
Buy
742
872
17.5
Axis Bank
Financials
1,22,147
Buy
514
701
36.4
ICICI Bank
Financials
1,55,963
Buy
269
370
37.8
Infosys
IT
2,62,173
Buy
1,141
1,306
14.4
Capital
Inox Wind
7,932
Buy
357
505
41.3
Goods
LIC HFL
Financials
21,499
Buy
426
570
33.8
Power Grid
Power
65,866
Buy
126
170
35.0
TCS
IT
5,04,490
Buy
2,576
3,168
23.0
Tech Mahindra IT
54,615
Buy
568
646
13.8
Yes Bank
Financials
30,180
Buy
721
953
32.2
Sun Pharma Pharma
2,14,486
Accumulate
891
950
6.6
Source: Bloomberg, Angel Research
Mid Cap
Market Cap
CMP
Target
Upside
Company
Sector
Rating
(` Cr)
(`)
(`)
(%)
Bajaj Electricals
Others
2,512
Buy
249
341
36.9
Garware Wall
Others
723
Buy
330
390
18.1
MBL Infra
Construction
989
Buy
239
360
50.9
Minda Industries
Auto Ancillary
822
Buy
518
652
25.8
MT Educare
Others
511
Buy
128
169
31.7
Radico Khaitan
Others
1,102
Buy
83
112
35.3
Surya Roshni
Others
549
Buy
125
183
46.0
Tree House
Others
1,455
Buy
344
449
30.6
Source: Bloomberg, Angel Research
Market Outlook
September 28, 2015
Global economic events release calendar
Date
Time
Country Event Description
Unit
Period
Bloomberg Data
Last Reported Estimated
September 29, 2015
2:30PM
Euro Zone Euro-Zone Consumer Confidence
Value
Sep F
(7.10)
(7.10)
7:30PM
US
Consumer Confidence
S.A./ 1985=100
Sep
101.54
96.00
11:00AM
India
RBI Reverse Repo rate
%
Sep 29
6.25
6.00
11:00AM
India
RBI Repo rate
%
Sep 29
7.25
7.00
11:00AM
India
RBI Cash Reserve ratio
%
Sep 29
4.00
4.00
September 30, 2015
1:25PM
Germany Unemployment change (000's)
Thousands
Sep
(7.00)
(5.00)
2:00PM
UK
GDP (YoY)
% Change
2Q F
2.60
2.60
October 1, 2015
1:25PM
Germany PMI Manufacturing
Value
Sep F
52.50
52.50
6:00PM
US
Initial Jobless claims
Thousands
Sep 25
267.00
271.50
6:30AM
China
PMI Manufacturing
Value
Sep
49.70
49.70
2:00PM
UK
PMI Manufacturing
Value
Sep
51.50
51.30
October 2, 2015
6:00PM
US
Change in Nonfarm payrolls
Thousands
Sep
173.00
202.00
6:00PM
US
Unnemployment rate
%
Sep
5.10
5.10
October 5, 2015
1:25PM
Germany PMI Services
Value
Sep F
54.30
--
October 7, 2015
2:00PM
UK
Industrial Production (YoY)
% Change
Aug
0.80
--
October 8, 2015
4:30PM
UK
BOE Announces rates
% Ratio
Oct 8
0.50
0.50
October 9, 2015
India
Imports YoY%
% Change
Sep
(9.95)
--
India
Exports YoY%
% Change
Sep
(20.66)
--
October 12, 2015
5:30PM
India
Industrial Production YoY
% Change
Aug
4.20
--
October 13, 2015
2:00PM
UK
CPI (YoY)
% Change
Sep
--
--
China
Exports YoY%
% Change
Sep
(5.50)
--
October 14, 2015
2:00PM
UK
Jobless claims change
% Change
Sep
1.20
--
12:00PM
India
Monthly Wholesale Prices YoY%
% Change
Sep
(4.95)
--
7:00AM
China
Consumer Price Index (YoY)
% Change
Sep
2.00
--
October 15, 2015
6:00PM
US
Consumer price index (mom)
% Change
Sep
(0.10)
--
October 16, 2015
6:45PM
US
Industrial Production
%
Sep
(0.38)
--
2:30PM
Euro Zone Euro-Zone CPI (YoY)
%
Sep F
0.10
--
October 19, 2015
7:30AM
China
Industrial Production (YoY)
% Change
Sep
6.10
--
7:30AM
China
Real GDP (YoY)
% Change
3Q
7.00
--
October 20, 2015
6:00PM
US
Housing Starts
Thousands
Sep
1,126.00
--
6:00PM
US
Building permits
Thousands
Sep
1,161.00
--
October 22, 2015
7:30PM
US
Existing home sales
Million
Sep
5.31
--
5:15PM
Euro Zone ECB announces interest rates
%
Oct 22
0.05
--
Source: Bloomberg, Angel Research
Market Outlook
September 28, 2015
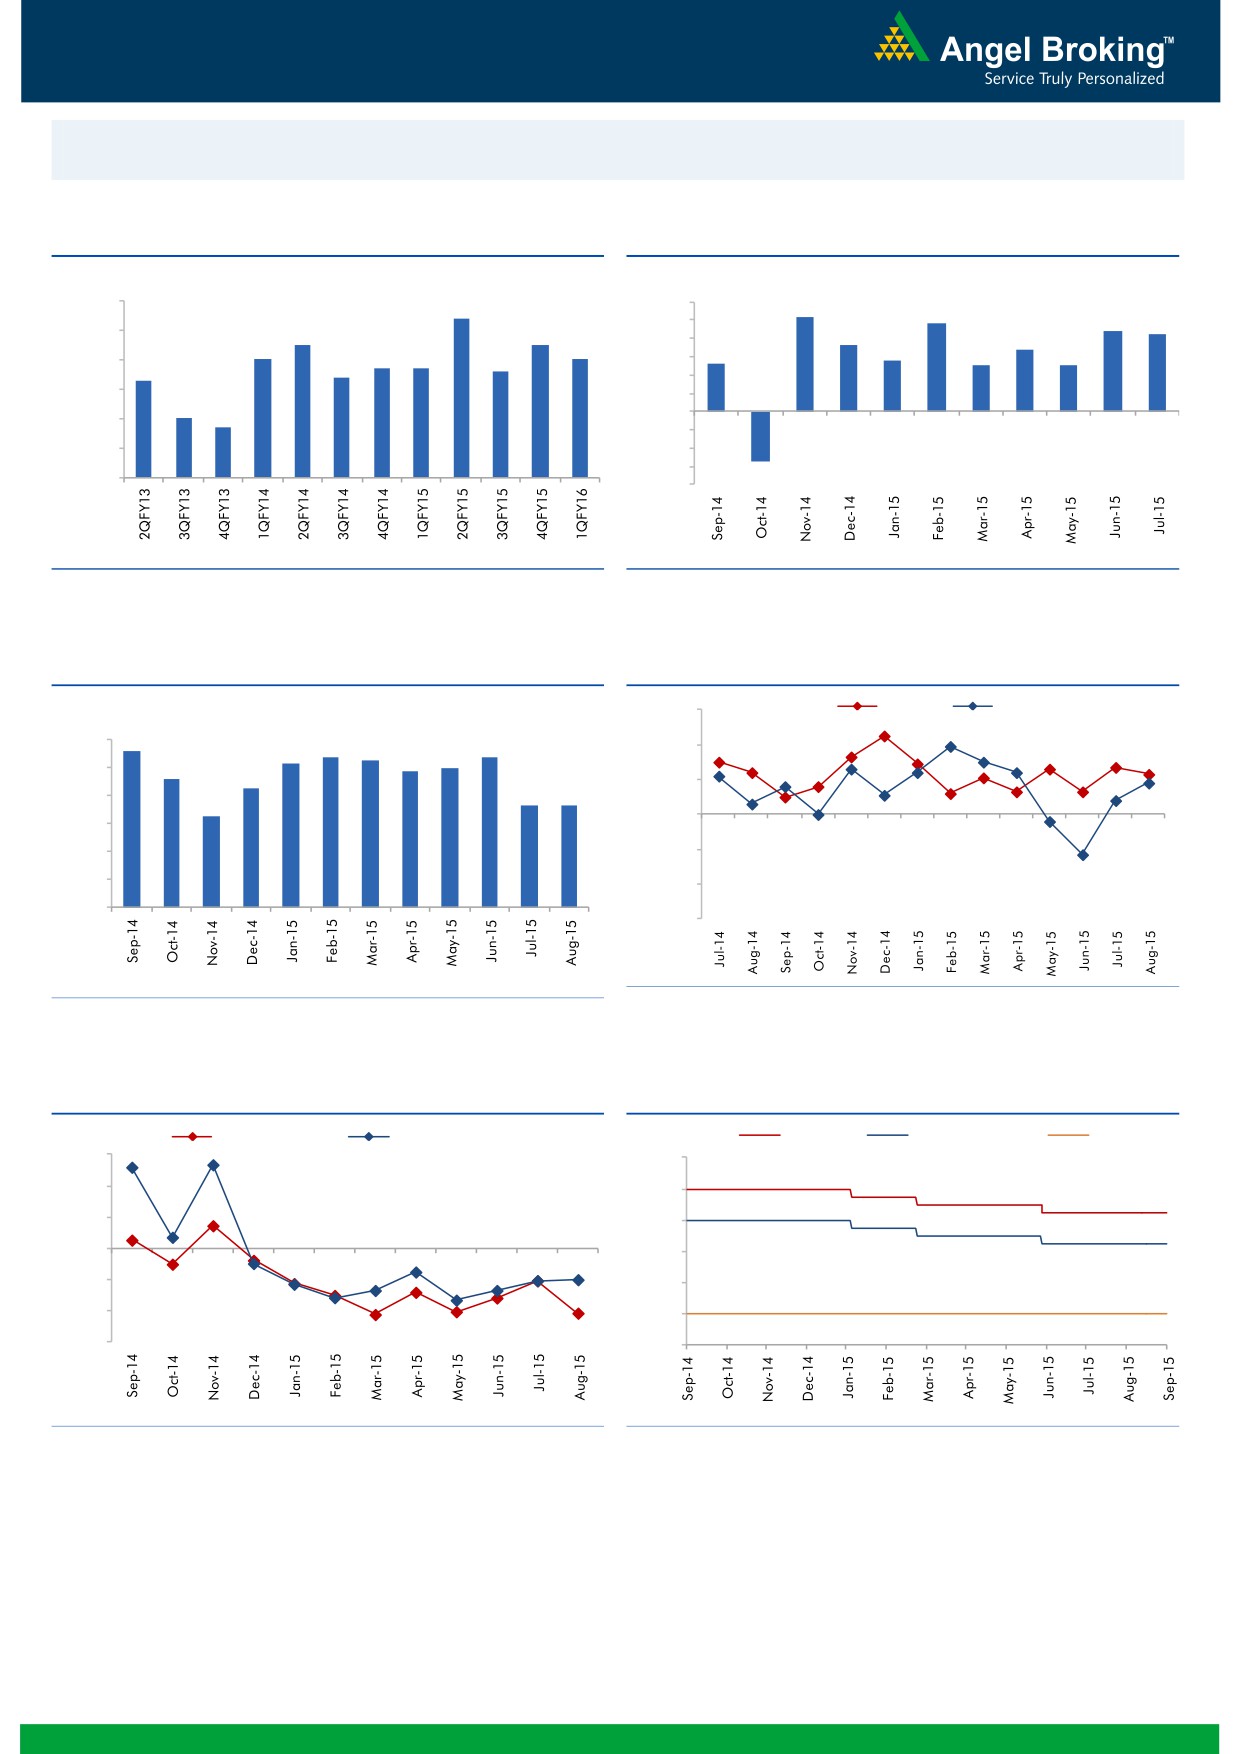
Macro watch
Exhibit 1: Quarterly GDP trends
Exhibit 2: IIP trends
(%)
(%)
9.0
8.4
6.0
5.2
4.8
4.4
4.2
5.0
8.0
7.5
7.5
3.6
3.4
7.0
7.0
4.0
6.7
6.7
2.6
2.8
2.5
2.5
6.6
3.0
7.0
6.3
6.4
2.0
6.0
1.0
5.0
4.7
-
5.0
(1.0)
4.0
(2.0)
(3.0)
3.0
(2.7)
(4.0)
Source: CSO, Angel Research
Source: MOSPI, Angel Research
Exhibit 3: Monthly CPI inflation trends
Exhibit 4: Manufacturing and services PMI
(%)
56.0
Mfg. PMI
Services PMI
5.6
6.0
5.4
5.3
5.4
54.0
5.2
5.0
4.9
4.6
5.0
4.3
52.0
3.7
3.7
4.0
3.3
50.0
3.0
2.0
48.0
1.0
46.0
-
44.0
Source: Market, Angel Research; Note: Level above 50 indicates expansion
Source: MOSPI, Angel Research
Exhibit 5: Exports and imports growth trends
Exhibit 6: Key policy rates
(%)
Exports yoy growth
Imports yoy growth
(%)
Repo rate
Reverse Repo rate
CRR
30.0
9.00
20.0
8.00
10.0
7.00
0.0
6.00
(10.0)
5.00
(20.0)
4.00
(30.0)
3.00
Source: Bloomberg, Angel Research
Source: RBI, Angel Research
Market Outlook
September 28, 2015
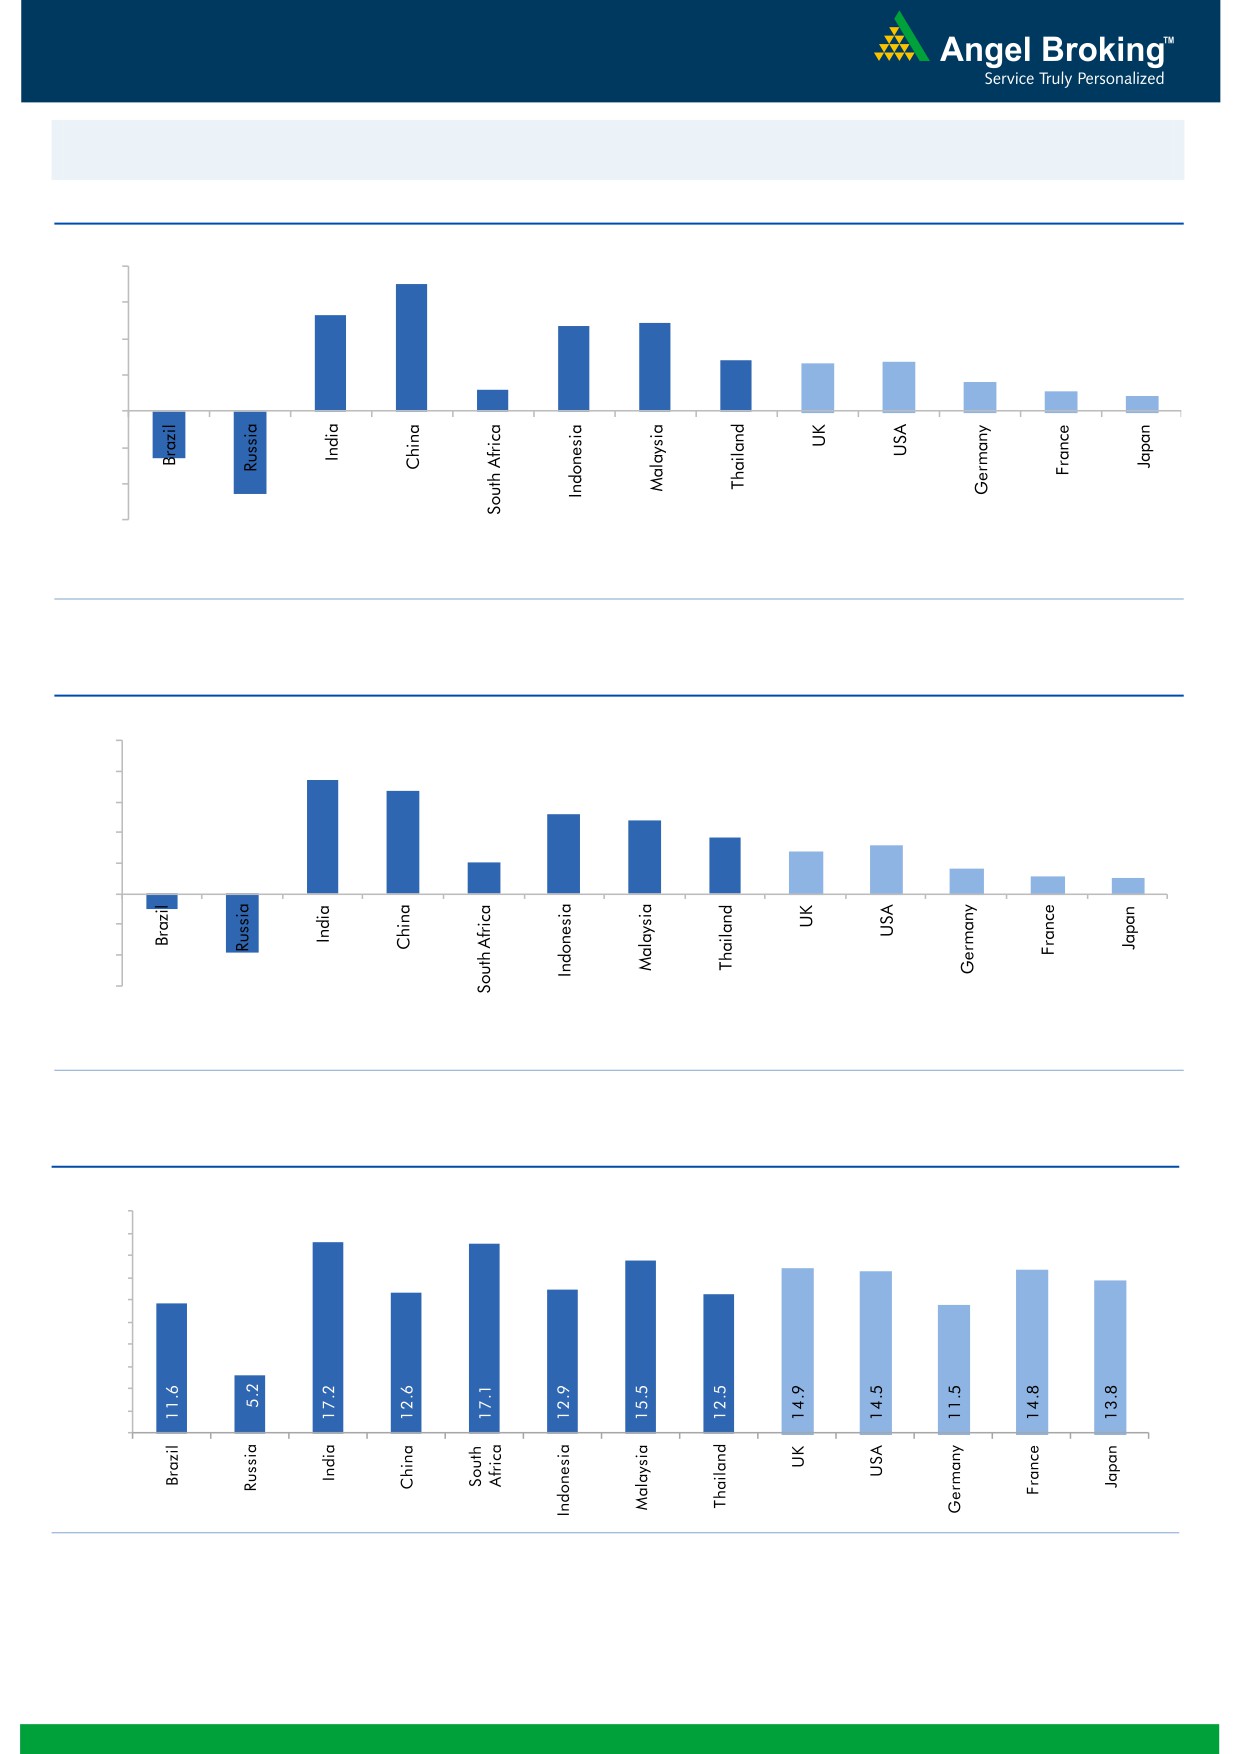
Global watch
Exhibit 1: Latest quarterly GDP Growth (%, yoy) across select developing and developed countries
(%)
8.0
7.0
5.3
6.0
4.9
4.7
4.0
2.8
2.6
2.7
1.6
2.0
1.2
1.1
0.8
(4.6)
(2.6)
-
(2.0)
(4.0)
(6.0)
Source: Bloomberg, Angel Research
Exhibit 2: 2015 GDP Growth projection by IMF (%, yoy) across select developing and developed countries
(%)
10.0
7.5
8.0
6.8
5.2
6.0
4.8
3.7
3.1
4.0
2.7
2.0
1.6
2.0
1.2
1.0
(3.8)
(1.0)
-
(2.0)
(4.0)
(6.0)
Source: IMF, Angel Research
Exhibit 3: One year forward P-E ratio across select developing and developed countries
(x)
20.0
18.0
16.0
14.0
12.0
10.0
8.0
6.0
4.0
2.0
-
Source: Bloomberg, Angel Research
Market Outlook
September 28, 2015
Exhibit 4: Relative performance of indices across globe
Returns (%)
Country
Name of index
Closing price
1M
3M
1YR
Brazil
Bovespa
44,831
0.6
(15.7)
(21.1)
Russia
Micex
1,640
(1.3)
0.3
13.7
India
Nifty
7,869
0.8
(6.3)
(1.3)
China
Shanghai Composite
3,092
(3.7)
(31.7)
34.7
South Africa
Top 40
44,963
3.5
(4.9)
0.2
Mexico
Mexbol
42,435
1.0
(6.9)
(5.2)
Indonesia
LQ45
699
(1.3)
(18.5)
(21.1)
Malaysia
KLCI
1,615
2.6
(6.5)
(12.7)
Thailand
SET 50
890
3.9
(10.9)
(15.4)
USA
Dow Jones
16,315
4.1
(8.8)
(4.7)
UK
FTSE
6,109
0.5
(9.5)
(8.1)
Japan
Nikkei
17,881
(8.0)
(14.1)
12.1
Germany
DAX
9,689
(3.1)
(12.6)
1.9
France
CAC
4,481
(0.5)
(8.0)
2.6
Source: Bloomberg, Angel Research
Market Outlook
September 28, 2015
Stock Watch
Company Name
Reco
CMP
Target
Mkt Cap
Sales ( Čcr )
OPM(%)
EPS (Č)
PER(x)
P/BV(x)
RoE(%)
EV/Sales(x)
(Č)
Price ( Č)
( Č cr )
FY16E FY17E
FY16E
FY17E
FY16E
FY17E
FY16E
FY17E
FY16E
FY17E
FY16E
FY17E
FY16E
FY17E
Agri / Agri Chemical
Rallis
Neutral
222
-
4,317
2,075
2,394
14.4
14.4
9.5
11.0
23.4
20.2
4.6
4.0
21.1
21.3
2.1
1.8
United Phosphorus
Accumulate
467
510
19,997
13,698
15,752
17.6
17.6
32.1
38.5
14.5
12.1
2.9
2.4
21.4
21.3
1.6
1.3
Auto & Auto Ancillary
Ashok Leyland
Accumulate
91
97
25,926
18,186
21,529
10.8
11.2
3.3
4.5
27.6
20.2
4.7
4.3
17.3
21.6
1.4
1.1
Bajaj Auto
Accumulate
2,283
2,438
66,065
23,544
27,245
19.8
19.8
127.0
143.4
18.0
15.9
5.4
4.7
30.3
29.4
2.4
2.0
Eicher Motors
Buy
17,776
22,859
48,249
11,681
15,550
15.3
16.9
358.5
564.3
49.6
31.5
14.9
11.1
29.8
34.9
4.0
3.0
Hero Motocorp
Accumulate
2,381
2,672
47,539
28,500
32,764
14.1
14.3
146.9
167.0
16.2
14.3
6.1
5.2
37.8
36.5
1.5
1.3
L G Balakrishnan & Bros Neutral
439
-
689
1,254
1,394
11.6
11.8
35.9
41.7
12.2
10.5
1.7
1.5
13.5
13.8
0.7
0.6
Mahindra and Mahindra Accumulate
1,221
1,383
75,807
38,337
43,069
13.0
13.4
52.9
63.5
23.1
19.2
3.5
3.1
15.0
15.9
1.6
1.4
Maruti
Neutral
4,570
-
138,057
58,102
68,587
16.7
16.9
182.0
225.5
25.1
20.3
5.0
4.3
19.9
21.0
2.1
1.8
Minda Industries
Buy
518
652
822
2,567
2,965
7.3
8.0
38.8
54.3
13.4
9.6
1.9
1.6
14.4
16.8
0.4
0.4
Rane Brake Lining
Buy
294
366
232
454
511
11.1
11.4
23.8
28.1
12.3
10.4
1.8
1.6
14.2
15.3
0.6
0.6
Setco Automotive
Neutral
228
-
608
594
741
12.7
13.7
8.4
15.8
27.1
14.4
2.8
2.4
10.4
16.9
1.5
1.2
Tata Motors
Neutral
304
-
87,670
264,038
297,882
13.8
13.9
34.5
38.9
8.8
7.8
1.5
1.3
17.6
16.8
0.5
0.5
TVS Motor
Neutral
236
-
11,203
11,702
13,713
6.8
7.7
10.1
14.5
23.4
16.3
5.7
4.6
24.5
28.3
0.9
0.8
Amara Raja Batteries
Neutral
985
-
16,823
5,101
6,224
17.8
17.6
31.1
39.2
31.7
25.1
7.9
6.2
24.8
24.8
3.3
2.6
Exide Industries
Neutral
159
-
13,536
7,363
8,247
13.7
14.5
6.6
7.7
24.1
20.7
3.0
2.8
12.6
13.3
1.6
1.4
Apollo Tyres
Neutral
186
-
9,488
12,576
12,978
16.8
16.1
22.3
19.9
8.4
9.4
1.4
1.3
17.2
13.4
0.8
0.9
Ceat
Neutral
1,271
-
5,143
6,041
6,597
14.3
14.2
101.5
116.6
12.5
10.9
2.5
2.1
20.0
19.1
1.0
0.9
JK Tyres
Neutral
102
-
2,314
7,446
7,669
15.2
14.0
19.6
18.4
5.2
5.5
1.3
1.1
25.2
19.5
0.7
0.6
Swaraj Engines
Neutral
872
-
1,083
593
677
14.5
14.8
51.2
60.8
17.0
14.3
4.0
3.6
23.3
24.8
1.7
1.4
Subros
Neutral
80
-
481
1,268
1,488
11.6
11.9
3.7
6.6
21.7
12.1
1.5
1.3
6.8
11.4
0.7
0.6
Indag Rubber
Neutral
175
-
459
283
329
17.0
17.2
13.0
15.4
13.5
11.3
2.9
2.4
21.8
21.6
1.3
1.1
Capital Goods
ACE
Neutral
37
-
367
660
839
4.7
8.2
1.0
3.9
37.1
9.5
1.2
1.0
3.2
11.3
0.7
0.6
BEML
Neutral
1,263
-
5,259
3,277
4,006
6.0
8.9
29.2
64.3
43.3
19.6
2.4
2.2
5.7
11.7
1.7
1.3
BGR Energy
Neutral
106
-
762
3,615
3,181
9.5
9.4
16.7
12.4
6.3
8.5
0.6
0.6
10.0
7.0
0.6
0.8
BHEL
Neutral
198
-
48,377
33,722
35,272
10.8
11.7
10.5
14.2
18.8
13.9
1.4
1.3
7.0
9.0
1.5
1.4
Blue Star
Buy
333
387
2,991
3,649
4,209
5.0
5.9
9.2
14.7
36.4
22.6
6.6
6.2
9.1
17.5
0.9
0.8
Crompton Greaves
Buy
174
204
10,924
13,484
14,687
4.9
6.2
4.5
7.1
38.7
24.6
2.7
2.6
7.2
10.8
0.9
0.9
Inox Wind
Buy
357
505
7,932
4,980
5,943
17.0
17.5
26.6
31.6
13.4
11.3
4.0
3.0
35.0
30.0
1.7
1.4
Market Outlook
September 28, 2015
Stock Watch
Company Name
Reco
CMP
Target
Mkt Cap
Sales ( Čcr )
OPM(%)
EPS (Č)
PER(x)
P/BV(x)
RoE(%)
EV/Sales(x)
(Č)
Price ( Č)
( Č cr )
FY16E
FY17E
FY16E
FY17E
FY16E
FY17E
FY16E
FY17E
FY16E
FY17E
FY16E
FY17E
FY16E
FY17E
Capital Goods
KEC International
Neutral
139
-
3,580
8,791
9,716
6.1
6.8
5.4
8.2
25.8
17.0
2.6
2.4
10.0
14.0
0.6
0.6
Thermax
Neutral
881
-
10,498
6,413
7,525
7.4
8.5
30.5
39.3
28.9
22.4
4.5
3.9
15.0
17.0
1.6
1.3
Cement
ACC
Buy
1,344
1,548
25,235
11,856
14,092
14.5
17.8
47.6
76.1
28.2
17.7
2.9
2.7
10.6
15.7
2.0
1.6
Ambuja Cements
Accumulate
207
233
32,109
10,569
12,022
20.7
22.2
8.7
10.7
23.8
19.3
3.0
2.9
13.0
15.2
2.6
2.3
India Cements
Buy
74
112
2,273
4,716
5,133
15.9
16.9
3.7
7.5
20.0
9.9
0.7
0.7
3.8
7.3
0.8
0.7
JK Cement
Buy
650
767
4,542
4,056
4,748
14.5
17.0
22.6
41.1
28.8
15.8
2.6
2.3
9.3
15.3
1.6
1.3
J K Lakshmi Cement
Buy
366
430
4,303
2,947
3,616
16.7
19.9
11.5
27.2
31.8
13.4
3.0
2.6
9.8
20.8
1.9
1.5
Mangalam Cements
Neutral
233
-
621
1,053
1,347
10.5
13.3
8.4
26.0
27.7
9.0
1.2
1.1
4.3
12.5
1.0
0.7
Orient Cement
Buy
155
183
3,184
1,854
2,524
21.2
22.2
7.7
11.1
20.2
14.0
2.9
2.5
13.3
15.7
2.5
1.7
Ramco Cements
Accumulate
319
350
7,604
4,036
4,545
20.8
21.3
15.1
18.8
21.2
17.0
2.6
2.3
12.9
14.3
2.4
2.1
Shree Cement^
Neutral
11,159
-
38,876
7,150
8,742
26.7
28.6
228.0
345.5
48.9
32.3
7.2
6.0
15.7
20.3
5.2
4.2
UltraTech Cement
Buy
2,811
3,282
77,127
27,562
31,548
20.4
22.3
111.9
143.3
25.1
19.6
3.6
3.1
15.2
16.8
2.9
2.5
Construction
ITNL
Neutral
96
-
2,369
7,360
8,825
34.0
35.9
1.0
5.0
96.0
19.2
0.4
0.4
0.3
1.4
3.8
3.6
KNR Constructions
Neutral
555
-
1,561
915
1,479
14.3
13.9
20.3
37.2
27.3
14.9
2.5
2.2
9.6
15.6
1.8
1.2
Larsen & Toubro
Buy
1,462
2,013
136,086
68,920
82,446
10.9
11.5
57.0
73.0
25.7
20.0
2.3
2.2
13.6
15.5
2.2
1.8
Gujarat Pipavav Port
Neutral
185
-
8,946
721
784
53.1
53.6
8.2
9.1
22.5
20.3
3.6
2.9
20.0
18.3
12.0
10.6
MBL Infrastructures
Buy
239
360
989
2,313
2,797
12.2
14.6
19.0
20.0
12.6
11.9
1.3
1.2
11.3
10.6
1.1
1.0
Nagarjuna Const.
Neutral
71
-
3,964
7,892
8,842
8.3
9.1
2.4
5.3
29.7
13.5
1.2
1.1
4.2
8.6
0.7
0.6
PNC Infratech
Neutral
478
-
2,453
1,798
2,132
13.2
13.5
22.0
30.0
21.7
15.9
2.0
1.8
11.5
11.4
1.5
1.2
Simplex Infra
Neutral
270
-
1,334
6,241
7,008
10.4
10.7
20.0
36.0
13.5
7.5
1.1
1.0
6.8
11.1
0.7
0.6
Financials
Allahabad Bank
Neutral
76
-
4,365
8,438
9,521
2.8
2.8
21.9
27.0
3.5
2.8
0.4
0.3
10.2
11.5
-
-
Axis Bank
Buy
514
701
122,147
26,941
32,298
3.5
3.6
37.4
46.4
13.7
11.1
2.8
2.4
18.7
20.0
-
-
Bank of Baroda
Neutral
187
-
41,244
19,027
21,737
1.9
2.0
16.9
24.5
11.0
7.6
1.0
0.9
9.1
12.1
-
-
Bank of India
Neutral
135
-
8,983
16,438
18,706
1.9
2.0
19.2
40.9
7.0
3.3
0.4
0.3
4.5
9.1
-
-
Canara Bank
Neutral
278
-
14,333
15,491
17,269
2.0
2.0
61.6
70.9
4.5
3.9
0.5
0.5
10.5
11.1
-
-
Dena Bank
Neutral
41
-
2,275
3,498
3,977
2.1
2.3
7.8
10.7
5.2
3.8
0.4
0.4
6.5
8.4
-
-
Federal Bank
Neutral
65
-
11,082
3,527
4,135
3.0
3.1
5.2
6.7
12.4
9.6
1.3
1.2
10.8
12.7
-
-
HDFC
Neutral
1,181
-
186,274
10,883
12,799
3.5
3.4
43.0
50.6
27.5
23.3
5.5
4.9
25.9
26.7
-
-
HDFC Bank
Buy
1,050
1,255
264,486
38,059
46,851
4.4
4.5
50.0
62.7
21.0
16.8
3.7
3.1
18.8
20.2
-
-
Market Outlook
September 28, 2015
Stock Watch
Company Name
Reco
CMP
Target
Mkt Cap
Sales ( Čcr )
OPM(%)
EPS (Č)
PER(x)
P/BV(x)
RoE(%)
EV/Sales(x)
(Č)
Price ( Č)
( Č cr )
FY16E
FY17E
FY16E
FY17E
FY16E
FY17E
FY16E
FY17E
FY16E
FY17E
FY16E
FY17E
FY16E
FY17E
Financials
ICICI Bank
Buy
269
370
155,963
35,810
41,871
3.4
3.5
22.0
26.2
12.2
10.3
2.1
1.8
15.0
15.6
-
-
IDBI Bank
Neutral
74
-
11,853
9,860
10,978
1.8
1.9
9.3
15.6
8.0
4.8
0.5
0.5
6.4
10.1
-
-
Indian Bank
Neutral
132
-
6,354
6,267
7,171
2.4
2.5
25.4
32.1
5.2
4.1
0.4
0.4
8.0
9.3
-
-
LIC Housing Finance
Buy
426
570
21,499
2,934
3,511
2.3
2.3
30.9
36.8
13.8
11.6
2.2
1.9
16.8
17.5
-
-
Oriental Bank
Neutral
131
-
3,913
7,730
8,595
2.4
2.5
38.8
47.4
3.4
2.8
0.3
0.3
8.6
9.8
-
-
Punjab Natl.Bank
Neutral
136
-
25,166
23,446
26,624
2.8
2.9
17.8
27.5
7.6
4.9
0.8
0.6
8.5
12.1
-
-
South Ind.Bank
Neutral
24
-
3,173
1,930
2,215
2.4
2.4
2.6
3.6
9.0
6.5
0.9
0.8
9.9
12.5
-
-
St Bk of India
Buy
239
307
180,946
83,847
96,307
2.8
2.8
20.1
25.1
11.9
9.5
1.3
1.2
11.5
13.1
-
-
Union Bank
Neutral
179
-
11,380
12,755
14,439
2.3
2.4
31.5
39.9
5.7
4.5
0.6
0.5
9.9
11.6
-
-
Vijaya Bank
Neutral
34
-
2,955
3,594
3,969
1.8
1.9
5.8
7.1
5.9
4.9
0.5
0.5
8.2
9.3
-
-
Yes Bank
Buy
721
953
30,180
7,204
9,078
3.2
3.2
57.8
69.5
12.5
10.4
2.2
1.9
19.6
22.6
-
-
FMCG
Asian Paints
Neutral
806
-
77,316
16,553
19,160
16.0
16.2
17.7
21.5
45.6
37.5
12.1
10.9
29.4
31.2
4.5
3.9
Britannia
Neutral
2,882
-
34,578
8,065
9,395
9.6
10.2
47.2
65.5
61.0
44.0
20.3
19.2
38.3
41.2
4.1
3.5
Colgate
Neutral
952
-
25,896
4,836
5,490
19.5
19.7
48.5
53.2
19.6
17.9
14.4
12.5
99.8
97.5
5.2
4.6
Dabur India
Neutral
275
-
48,286
9,370
10,265
17.1
17.2
7.3
8.1
37.5
33.9
11.3
9.2
33.7
30.6
5.1
4.6
GlaxoSmith Con*
Neutral
6,104
-
25,669
4,919
5,742
17.2
17.4
168.3
191.2
36.3
31.9
10.3
8.8
28.8
28.9
4.8
4.1
Godrej Consumer
Neutral
1,176
-
40,036
10,168
12,886
16.1
16.1
32.1
38.4
36.6
30.6
7.5
6.9
19.7
21.0
4.0
3.2
HUL
Neutral
781
-
169,094
34,940
38,957
17.5
17.7
20.8
24.7
37.6
31.6
41.8
33.4
110.5
114.2
4.6
4.1
ITC
Buy
323
409
258,975
41,068
45,068
37.8
37.4
13.9
15.9
23.2
20.3
7.8
6.8
34.1
33.8
5.9
5.4
Marico
Neutral
395
-
25,471
6,551
7,766
15.7
16.0
10.4
12.5
38.0
31.6
11.0
9.2
33.2
32.4
3.8
3.2
Nestle*
Accumulate
6,203
6,646
59,803
11,291
12,847
22.2
22.3
158.9
184.6
39.0
33.6
20.4
18.4
55.0
57.3
5.1
4.5
Tata Global
Buy
124
144
7,832
8,635
9,072
9.8
9.9
6.5
7.6
19.1
16.3
1.9
1.8
6.8
7.4
0.8
0.8
IT
HCL Tech^
Buy
953
1,132
134,026
42,038
47,503
23.5
23.5
56.4
62.9
16.9
15.2
3.9
3.0
23.2
19.8
2.8
2.3
Infosys
Accumulate
1,141
1,306
262,173
60,250
66,999
28.0
28.0
58.3
63.7
19.6
17.9
4.1
3.5
20.9
19.7
3.7
3.1
TCS
Buy
2,576
3,168
504,490
108,420
123,559
28.8
28.7
127.2
143.9
20.3
17.9
8.1
7.5
39.9
41.8
4.2
3.7
Tech Mahindra
Accumulate
568
646
54,615
25,566
28,890
16.0
17.0
26.3
31.9
21.6
17.8
3.9
3.3
17.9
18.6
1.9
1.6
Wipro
Buy
603
719
148,906
52,414
58,704
23.7
23.8
38.4
42.3
15.7
14.3
3.1
2.7
19.5
18.0
2.4
2.0
Media
D B Corp
Accumulate
316
356
5,805
2,241
2,495
27.8
27.9
21.8
25.6
14.5
12.3
3.8
3.3
26.7
28.5
2.5
2.3
HT Media
Neutral
82
-
1,917
2,495
2,603
11.2
11.2
7.3
8.6
11.3
9.6
0.9
0.8
7.4
8.1
0.3
0.3
Market Outlook
September 28, 2015
Stock Watch
Company Name
Reco
CMP
Target
Mkt Cap
Sales ( Čcr )
OPM(%)
EPS (Č)
PER(x)
P/BV(x)
RoE(%)
EV/Sales(x)
(Č)
Price ( Č)
( Č cr )
FY16E FY17E
FY16E
FY17E
FY16E
FY17E
FY16E
FY17E
FY16E
FY17E
FY16E
FY17E
FY16E
FY17E
Media
Jagran Prakashan
Accumulate
138
156
4,516
1,939
2,122
26.0
26.0
8.3
9.2
16.6
15.0
2.9
2.6
17.5
17.1
2.3
2.1
Sun TV Network
Neutral
376
-
14,812
2,779
3,196
70.2
70.5
22.8
27.3
16.5
13.8
4.1
3.7
26.7
28.3
5.1
4.4
Hindustan Media
Buy
236
292
1,735
920
1,031
20.0
20.0
19.2
20.9
12.3
11.3
2.0
1.7
16.4
15.3
1.4
1.3
Ventures
Metals & Mining
Coal India
Buy
319
400
201,239
72,015
78,415
21.2
21.5
21.7
25.3
14.7
12.6
5.0
4.9
33.1
39.1
2.0
1.9
Hind. Zinc
Neutral
143
-
60,401
15,258
16,495
44.2
45.6
17.6
19.2
8.1
7.5
1.3
1.1
15.9
15.3
1.7
1.2
Hindalco
Neutral
72
-
14,775
104,356
111,186
8.7
9.5
6.7
11.1
10.7
6.5
0.4
0.4
3.5
5.9
0.7
0.6
JSW Steel
Neutral
880
-
21,272
48,125
53,595
18.8
21.0
46.9
97.5
18.8
9.0
0.9
0.8
4.4
9.5
1.3
1.1
NMDC
Neutral
95
-
37,704
8,237
10,893
46.6
44.5
10.0
11.7
9.6
8.2
1.1
0.9
12.5
13.0
4.4
3.3
SAIL
Neutral
53
-
21,848
45,915
53,954
7.2
10.5
1.5
4.4
35.1
12.1
0.5
0.5
2.3
4.1
1.1
1.0
Vedanta
Neutral
96
-
28,342
71,445
81,910
26.2
26.3
12.9
19.2
7.4
5.0
0.5
0.5
7.2
8.9
0.8
0.6
Tata Steel
Neutral
215
-
20,920
136,805
149,228
11.3
11.9
26.4
36.8
8.2
5.9
0.7
0.6
6.0
8.0
0.7
0.6
Oil & Gas
Cairn India
Neutral
150
-
28,132
11,323
12,490
49.4
51.0
20.7
20.7
7.2
7.3
0.5
0.4
6.4
6.1
1.6
0.9
GAIL
Neutral
294
-
37,350
64,856
70,933
9.1
9.6
24.0
28.9
12.3
10.2
1.1
1.0
8.8
9.6
0.8
0.7
ONGC
Neutral
227
-
194,552
154,564
167,321
36.8
37.4
28.6
32.5
8.0
7.0
1.0
0.9
12.7
13.5
1.5
1.4
Petronet LNG
Buy
172
210
12,919
39,007
40,785
3.8
4.2
9.2
11.0
18.8
15.7
2.1
1.9
11.6
12.7
0.4
0.4
Indian Oil Corp
Buy
394
455
95,722
359,607
402,760
5.9
6.1
42.5
48.7
9.3
8.1
1.2
1.1
14.1
14.4
0.4
0.3
Reliance Industries
Accumulate
838
930
271,348
313,085
362,904
13.1
13.8
78.4
92.9
10.7
9.0
1.1
1.0
10.8
11.6
1.3
1.2
Pharmaceuticals
Alembic Pharma
Neutral
676
-
12,735
2,601
3,115
21.2
20.2
20.8
23.9
32.5
28.3
10.4
7.9
37.2
31.8
4.9
4.0
Aurobindo Pharma
Buy
742
872
43,321
14,923
17,162
23.0
23.0
38.2
43.6
19.4
17.0
6.0
4.5
36.0
30.2
3.2
2.8
Aventis*
Neutral
4,167
-
9,596
2,156
2,455
15.1
16.8
109.7
133.9
38.0
31.1
5.2
4.3
18.4
22.5
4.2
3.5
Cadila Healthcare
Neutral
2,040
-
41,758
10,224
11,840
20.0
21.0
71.0
85.6
28.7
23.8
7.7
6.1
30.1
28.5
4.2
3.5
Cipla
Neutral
643
-
51,668
14,359
16,884
21.3
19.7
28.4
30.5
22.7
21.1
4.0
3.4
19.3
17.5
3.6
3.0
Dr Reddy's
Neutral
3,972
-
67,723
17,903
20,842
22.7
22.8
160.5
189.5
24.8
21.0
5.0
4.2
22.2
21.7
3.7
3.2
Dishman Pharma
Neutral
303
-
2,443
1,716
1,888
20.2
20.2
16.3
21.6
18.6
14.0
1.7
1.6
9.7
11.7
1.6
1.3
GSK Pharma*
Neutral
3,368
-
28,525
2,870
3,158
20.0
22.1
59.5
68.3
56.6
49.3
16.7
17.2
28.5
34.3
9.4
8.6
Indoco Remedies
Neutral
328
-
3,026
1,088
1,262
18.2
18.2
13.1
15.5
25.1
21.2
4.9
4.1
21.2
21.1
2.8
2.5
Ipca labs
Neutral
770
-
9,716
3,507
4,078
17.6
18.6
25.8
32.0
29.9
24.1
3.9
3.3
13.8
14.9
3.0
2.6
Lupin
Neutral
1,989
-
89,542
14,864
17,244
26.9
26.9
62.1
71.1
32.0
28.0
7.8
6.2
27.4
24.6
5.8
4.8
Sun Pharma
Accumulate
891
950
214,486
28,163
32,610
25.8
30.7
17.4
26.9
51.2
33.1
4.9
4.2
13.0
16.6
7.1
5.9
Market Outlook
September 28, 2015
Stock Watch
Company Name
Reco
CMP
Target
Mkt Cap
Sales ( Čcr )
OPM(%)
EPS (Č)
PER(x)
P/BV(x)
RoE(%)
EV/Sales(x)
(Č)
Price ( Č)
( Č cr )
FY16E FY17E
FY16E
FY17E
FY16E
FY17E
FY16E
FY17E
FY16E
FY17E
FY16E
FY17E
FY16E
FY17E
Power
Tata Power
Neutral
65
-
17,594
35,923
37,402
22.6
22.8
4.1
5.2
16.0
12.6
1.2
1.2
7.5
9.3
1.4
1.3
NTPC
Buy
122
157
100,553
87,064
98,846
23.5
23.5
11.7
13.2
10.4
9.2
1.2
1.1
11.4
12.1
2.2
1.9
Power Grid
Buy
126
170
65,866
20,702
23,361
86.7
86.4
12.1
13.2
10.4
9.5
1.5
1.4
15.6
15.1
8.1
7.6
Telecom
Bharti Airtel
Neutral
333
-
133,093
101,748
109,191
32.1
31.7
12.0
12.5
27.8
26.6
1.9
1.8
6.9
6.7
1.9
1.8
Idea Cellular
Neutral
139
-
50,121
34,282
36,941
32.0
31.5
5.9
6.2
23.6
22.5
2.2
2.0
9.9
9.3
2.0
1.9
zOthers
Abbott India
Neutral
5,727
-
12,169
2,715
3,153
14.5
14.1
134.3
152.2
42.7
37.6
10.6
8.8
27.4
25.6
4.2
3.6
Bajaj Electricals
Buy
249
341
2,512
4,719
5,287
5.2
5.8
8.6
12.7
29.1
19.7
3.3
2.9
11.4
14.8
0.5
0.5
Finolex Cables
Neutral
231
-
3,534
2,728
3,036
10.8
11.0
14.4
16.8
16.0
13.8
2.4
2.1
15.2
15.3
1.0
0.9
Goodyear India*
Buy
554
655
1,278
1,953
1,766
12.4
12.0
67.4
59.6
8.2
9.3
2.1
1.7
27.7
20.2
0.4
0.4
Hitachi
Neutral
1,307
-
3,554
1,806
2,112
9.0
9.2
28.6
29.1
45.7
44.9
11.4
9.2
28.1
22.6
2.0
1.7
Jyothy Laboratories
Neutral
309
-
5,598
1,620
1,847
11.5
11.5
7.3
8.5
42.4
36.5
5.5
5.1
13.3
14.4
3.3
2.8
MRF
Accumulate
41,092
43,575
17,428
20,727
14,841
19.3
18.6
4,905.8
3,351.9
8.4
12.3
2.7
2.2
37.6
19.6
0.8
1.1
Page Industries
Neutral
13,356
-
14,897
1,929
2,450
19.8
20.1
229.9
299.0
58.1
44.7
25.6
17.8
52.1
47.1
7.8
6.1
Relaxo Footwears
Neutral
536
-
6,432
1,767
2,152
12.3
12.5
19.3
25.1
27.9
21.4
6.8
5.3
27.7
27.8
3.7
3.0
Siyaram Silk Mills
Buy
952
1,221
892
1,653
1,873
11.7
12.2
99.3
122.1
9.6
7.8
1.7
1.5
19.5
20.2
0.7
0.6
Styrolution ABS India*
Neutral
763
-
1,341
1,271
1,440
8.6
9.2
32.0
41.1
23.8
18.6
2.4
2.2
10.7
12.4
1.0
0.9
Tree House
Buy
344
449
1,455
259
324
56.8
56.8
17.0
21.7
20.2
15.9
2.0
1.8
10.1
11.5
5.5
4.6
TVS Srichakra
Buy
2,666
3,210
2,041
2,127
2,388
15.2
14.9
237.7
267.5
11.2
10.0
4.8
3.4
51.7
39.8
1.0
0.9
HSIL
Accumulate
275
302
1,985
2,182
2,404
16.3
16.5
15.8
18.9
17.4
14.5
1.4
1.3
8.4
9.4
1.2
1.1
Kirloskar Engines India
Neutral
286
-
4,140
2,634
3,252
10.1
12.0
10.9
17.4
26.3
16.4
2.9
2.6
11.4
16.8
1.2
0.9
Ltd
M M Forgings
Buy
540
797
652
563
671
22.1
22.9
51.0
66.5
10.6
8.1
2.2
1.8
23.1
24.1
1.3
1.1
Banco Products (India)
Neutral
116
-
826
1,208
1,353
11.0
12.3
10.8
14.5
10.7
8.0
1.2
1.1
11.9
14.5
0.6
0.6
Competent Automobiles Neutral
148
-
91
1,007
1,114
3.1
3.1
23.7
28.2
6.3
5.2
0.9
0.8
13.9
14.6
0.1
0.1
Nilkamal
Neutral
973
-
1,452
1,948
2,147
10.6
10.3
60.0
67.0
16.2
14.5
2.5
2.2
16.8
16.1
0.8
0.7
Visaka Industries
Buy
125
166
198
1,158
1,272
8.6
9.5
23.7
32.7
5.3
3.8
0.5
0.5
10.1
12.5
0.3
0.3
Transport Corporation of
Buy
244
293
1,857
2,830
3,350
8.8
9.0
14.4
18.3
17.0
13.3
2.6
2.3
15.4
17.1
0.8
0.7
India
Elecon Engineering
Buy
73
87
794
1,452
1,596
14.0
14.7
4.4
6.2
16.5
11.7
1.4
1.3
8.6
11.2
0.9
0.7
Surya Roshni
Buy
125
183
549
2,992
3,223
8.3
8.5
14.7
18.3
8.5
6.9
0.8
0.7
9.8
11.0
0.5
0.4
MT Educare
Buy
128
169
511
286
366
18.3
17.7
7.7
9.4
16.6
13.7
3.5
3.1
20.2
21.1
1.7
1.3
Market Outlook
September 28, 2015
Stock Watch
Company Name
Reco
CMP
Target Mkt Cap
Sales ( Čcr )
OPM(%)
EPS (Č)
PER(x)
P/BV(x)
RoE(%)
EV/Sales(x)
(Č)
Price ( Č)
( Č cr )
FY16E FY17E FY16E FY17E FY16E FY17E FY16E FY17E FY16E FY17E FY16E FY17E FY16E FY17E
zOthers
Radico Khaitan
Buy
83
112
1,102
1,565
1,687
11.9
12.4
5.4
6.6
15.3
12.6
1.2
1.1
8.0
9.0
1.2
1.2
Garware Wall Ropes
Buy
330
390
723
875
983
10.4
10.6
23.1
27.8
14.3
11.9
2.0
1.8
14.1
14.8
0.8
0.7
Wonderla Holidays
Accumulate
290
322
1,641
206
308
44.0
43.6
9.0
12.9
32.3
22.5
4.4
4.0
13.7
17.8
7.9
5.2
Linc Pen & Plastics
Buy
151
185
223
340
371
8.3
8.9
10.8
13.2
14.0
11.4
2.2
2.0
16.0
17.1
0.7
0.6
The Byke Hospitality
Accumulate
159
181
638
222
287
20.5
20.5
5.6
7.6
28.2
21.1
5.3
4.4
18.9
20.8
2.9
2.2
Source: Company, Angel Research; Note: *December year end; #September year end; &October year end; Price as on September 24, 2015
Market Outlook
September 28, 2015
Research Team Tel: 022 - 39357800
DISCLAIMER
Angel Broking Private Limited (hereinafter referred to as “Angel”) is a registered Member of National Stock Exchange of India Limited,
Bombay Stock Exchange Limited and MCX Stock Exchange Limited. It is also registered as a Depository Participant with CDSL and
Portfolio Manager with SEBI. It also has registration with AMFI as a Mutual Fund Distributor. Angel Broking Private Limited is a registered
entity with SEBI for Research Analyst in terms of SEBI (Research Analyst) Regulations, 2014 vide registration number INH000000164.
Angel or its associates has not been debarred/ suspended by SEBI or any other regulatory authority for accessing /dealing in securities
Market. Angel or its associates including its relatives/analyst do not hold any financial interest/beneficial ownership of more than 1% in
the company covered by Analyst. Angel or its associates/analyst has not received any compensation / managed or co-managed public
offering of securities of the company covered by Analyst during the past twelve months. Angel/analyst has not served as an officer,
director or employee of company covered by Analyst and has not been engaged in market making activity of the company covered by
Analyst.
This document is solely for the personal information of the recipient, and must not be singularly used as the basis of any investment
decision. Nothing in this document should be construed as investment or financial advice. Each recipient of this document should make
such investigations as they deem necessary to arrive at an independent evaluation of an investment in the securities of the companies
referred to in this document (including the merits and risks involved), and should consult their own advisors to determine the merits and
risks of such an investment.
Reports based on technical and derivative analysis center on studying charts of a stock's price movement, outstanding positions and
trading volume, as opposed to focusing on a company's fundamentals and, as such, may not match with a report on a company's
fundamentals.
The information in this document has been printed on the basis of publicly available information, internal data and other reliable sources
believed to be true, but we do not represent that it is accurate or complete and it should not be relied on as such, as this document is for
general guidance only. Angel Broking Pvt. Limited or any of its affiliates/ group companies shall not be in any way responsible for any
loss or damage that may arise to any person from any inadvertent error in the information contained in this report. Angel Broking Pvt.
Limited has not independently verified all the information contained within this document. Accordingly, we cannot testify, nor make any
representation or warranty, express or implied, to the accuracy, contents or data contained within this document. While Angel Broking
Pvt. Limited endeavors to update on a reasonable basis the information discussed in this material, there may be regulatory, compliance,
or other reasons that prevent us from doing so.
This document is being supplied to you solely for your information, and its contents, information or data may not be reproduced,
redistributed or passed on, directly or indirectly.
Neither Angel Broking Pvt. Limited, nor its directors, employees or affiliates shall be liable for any loss or damage that may arise from or
in connection with the use of this information.
Note: Please refer to the important ‘Stock Holding Disclosure' report on the Angel website (Research Section). Also, please refer to the
latest update on respective stocks for the disclosure status in respect of those stocks. Angel Broking Pvt. Limited and its affiliates may have
investment positions in the stocks recommended in this report.