Market Outlook
August 28, 2015
Dealer’s Diary
Domestic Indices
Chg (%)
(Pts)
(Close)
BSE Sensex
2.0
517
26,231
Indian markets are expected to open a Positive note tracing SGX NIFTY and Global
markets.
Nifty
2.0
157
7,949
MID CAP
2.5
261
10,738
Yesterday, the US markets closed in the green as traders continued their bargain
SMALL CAP
2.6
274
10,986
hunting after the sell-off witnessed in the past week.
BSE HC
2.9
504
17,699
European markets too ended in the positive territory after the Chinese market
BSE PSU
2.1
143
6,866
rebounded sharply post the recent sell-off.
BANKEX
1.8
355
19,750
The Indian markets rose sharply in Thursday’s session on the back of gains seen in
AUTO
0.8
145
17,824
global markets.
METAL
2.6
183
7,345
OIL & GAS
2.8
241
8,774
News & Result Analysis
BSE IT
1.2
130
11,022
Aurobindo Pharma receives USFDA Approval for Entecavir Tablets
Global Indices
Chg (%)
(Pts)
(Close)
Lupin receives FDA Approval for Generic Prilosec® Capsules
Refer detailed news analysis on the following page
Dow Jones
2.3
369
16,655
NASDAQ
2.5
115
4,813
Markets Today
FTSE
3.6
213
6,192
The trend deciding level for the day is 26,159 / 7,925 levels. If NIFTY trades above
Nikkei
2.3
431
19,005
this level during the first half-an-hour of trade then we may witness a further rally up
Hang Sang
1.4
307
22,146
to 26,375 - 26,518 / 7,988 - 8,026 levels. However, if NIFTY trades below
Straits Times
1.5
45
2,991
26,159 / 7,925 levels for the first half-an-hour of trade then it may correct towards
Shanghai Com
1.0
32
3,115
26,016 - 25,800 / 7,886 - 7,824 levels.
Indices
S2
S1
PIVOT
R1
R2
Indian ADR
Chg (%)
(Pts)
(Close)
SENSEX
25,800
26,016
26,159
26,375
26,518
INFY
1.9
0.3
$17.3
NIFTY
7,824
7,886
7,925
7,988
8,026
WIT
0.2
0.0
$11.7
IBN
1.7
0.2
$8.9
Net Inflows (August 26, 2015)
HDB
0.3
0.2
$57.8
` cr
Purch
Sales
Net
MTD
YTD
FII
5,046
7,471
(2,426)
(13,578)
127,392
Advances / Declines
BSE
NSE
MFs
1,610
587
1,024
7,369
65,317
Advances
2,000
1,266
Declines
700
254
FII Derivatives (August 27, 2015)
` cr
Purch
Sales
Net
Open Interest
Unchanged
87
41
Index Futures
6,834
5,449
1,385
16,568
Volumes (` cr)
Stock Futures
13,456
13,446
10
43,457
BSE
3,015
Gainers / Losers
NSE
27,117
Gainer
Loser
Company
Price (`)
chg (%)
Company
Price (`)
chg (%)
ESCORTS
171
18.3
SUNASIAN
290
(20.0)
JPASSOCIAT
10
11.7
KAILASH
3
(4.9)
ADANIENT
80
10.7
PMCFIN
3
(4.9)
IBREALEST
66
9.8
BHEL
232
(3.5)
VAKRANGEE
108
9.6
BAJAJ-AUTO
2189
(2.4)
Market Outlook
August 28, 2015
Aurobindo Pharma receives USFDA Approval for Entecavir
Tablets
Aurobindo Pharma Limited is pleased to announce that the company has received
the final approval from the US Food & Drug Administration (USFDA) to
manufacture and market Entecavir Tablets, 0.5mg and 1mg (ANDA 206217).The
approved ANDA is bioequivalent and therapeutically equivalent to the reference
listed drug product (RLD) Baraclude® Tablets, 0.5mg and 1mg, of Bristol-Myers
Squibb. Entecavir Tablets are indicated for treatment of chronic hepatitis B virus
infection of the liver.
The product has an estimated market size of US$294mn for the twelve months
ending June 2015 according to IMS. The product has less competition for the
product with only Teva Pharma USA and Hetero Labs LTDV. Thus we expect the
company can gross sales of US$50mn and around US$25mn in sales and net
profit respectively for the company. We remain neutral on the stock.
Lupin receives FDA Approval for Generic Prilosec® Capsules
Lupin announced that it has received final approval for its Omeprazole Delayed-
Release capsules 40 mg from the United States Food and Drugs Administration
(FDA) to market a generic version of AstraZeneca Pharmaceuticals LP
(AstraZeneca) Prilosec® Delayed-Release capsules 40mg. Lupin's Omeprazole
delayed-Release capsules
40 mg are the AB rated generic equivalent of
AstraZeneca’s. Prilosec® Delayed-Release capsules 40mg. It is indicated for the
short-term treatment of Duodenal Ulcer, Gastric Ulcer, treatment of Gastro
Esophageal Reflux Disease (GERD), maintenance of healing of Erosive Esophagitis
and Pathological Hypersecretory conditions. Prilosec® had annual US sales of
US$185mn (IMS MAT June 2015). The drug is highly competitive, hence won’t
contribute much to the overall sales of the company. We remain neutral on the
stock.
Economic and Political News
Centre releases list of 98 cities for Smart City project
Uncertain monsoon still a risk to growth, inflation: RBI
India can replace China as driver of global growth: Jaitley
Corporate News
Godrej Consumer gets investor nod to raise `300cr via NCDs
Bosch opens `340cr worth factory in Bengaluru
Infosys appoints new Group HR Head
Market Outlook
August 28, 2015
Top Picks
Large Cap
Market
CMP
Target
Upside
Company
Sector
Rating
Cap (` Cr)
(`)
(`)
(%)
Axis Bank
Financials
1,20,989
Buy
509
716
40.6
ICICI Bank
Financials
1,64,641
Buy
284
370
30.5
Infosys
IT
2,49,012
Buy
1,084
1,306
20.5
Inox Wind
Capital Goods
7,898
Buy
356
505
41.9
LIC Housing Fin.Financials
22,490
Buy
446
570
27.9
Power Grid
Power
70,679
Buy
135
170
25.8
TCS
IT
5,04,882
Buy
2,578
3,168
22.9
Tech Mahindra IT
49,951
Buy
519
646
24.4
Yes Bank
Financials
28,757
Buy
687
989
43.9
Source: Angel Research, Bloomberg
Mid Cap
Market
CMP
Target
Upside
Company
Sector
Rating
Cap (` Cr)
(`)
(`)
(%)
Bajaj Electricals
Others
2,424
Buy
240
341
41.8
Garware Wall Ropes Others
661
Buy
302
390
29.0
Hindustan Media Ven. Media
1,611
Buy
219
292
33.1
JK Tyre
Auto Ancillary
2,479
Buy
109
129
18.0
MBL Infrastructures
Construction
989
Buy
239
360
50.9
Minda Industries
Auto Ancillary
839
Buy
529
652
23.4
MT Educare
Others
520
Buy
131
169
29.5
Radico Khaitan
Others
1,245
Buy
94
112
19.7
Surya Roshni
Others
554
Buy
127
183
44.7
Source: Angel Research, Bloomberg
Market Outlook
August 28, 2015
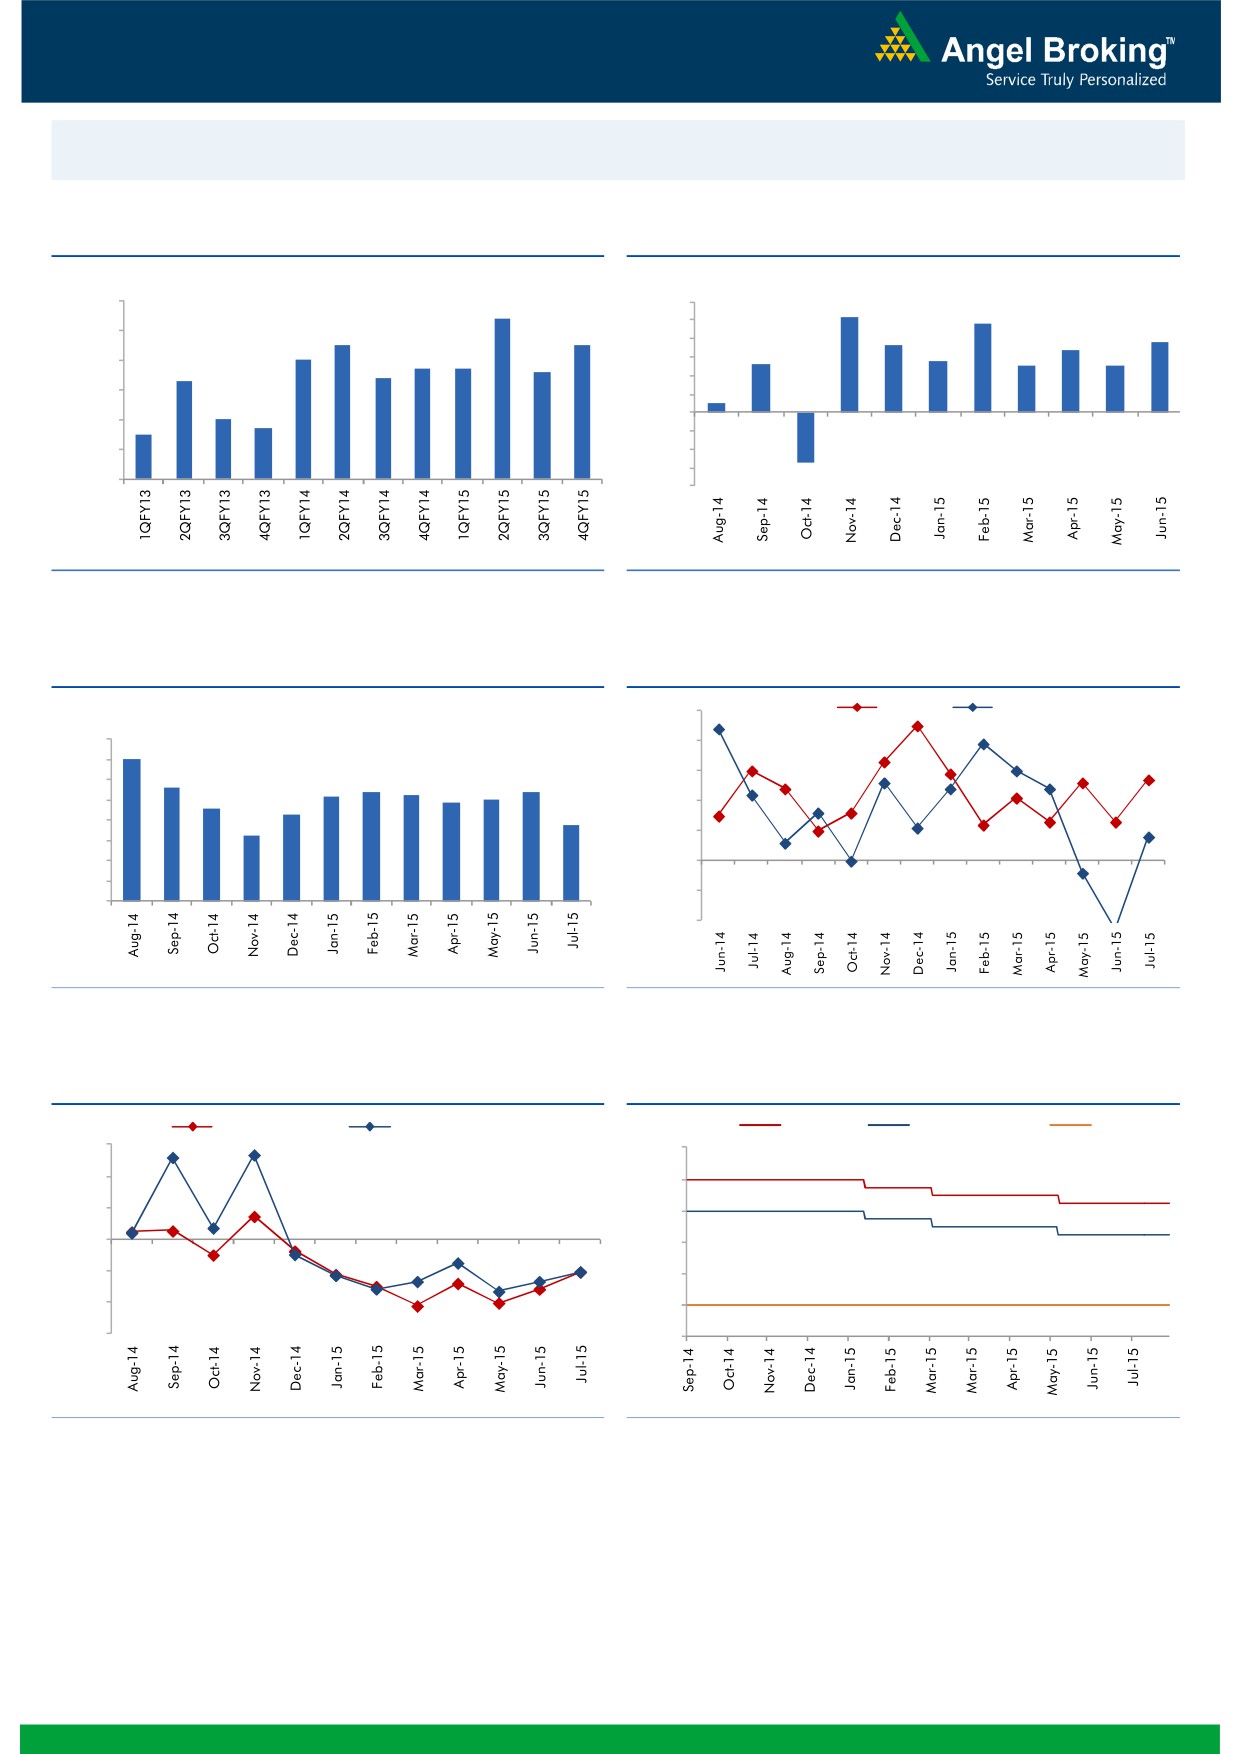
Macro watch
Exhibit 1: Quarterly GDP trends
Exhibit 2: IIP trends
(%)
(%)
9.0
8.4
6.0
5.2
4.8
7.5
7.5
5.0
3.8
8.0
3.6
3.4
7.0
4.0
2.8
6.7
6.7
2.6
2.5
2.5
7.0
6.3
6.4
6.6
3.0
2.0
6.0
0.5
1.0
5.0
4.7
-
5.0
4.5
(1.0)
4.0
(2.0)
(3.0)
3.0
(2.7)
(4.0)
Source: CSO, Angel Research
Source: MOSPI, Angel Research
Exhibit 3: Monthly CPI inflation trends
Exhibit 4: Manufacturing and services PMI
(%)
55.0
Mfg. PMI
Services PMI
8.0
7.0
54.0
7.0
5.6
53.0
6.0
5.2
5.4
5.3
5.4
4.9
5.0
4.6
5.0
4.3
52.0
3.8
4.0
3.3
51.0
3.0
2.0
50.0
1.0
49.0
-
48.0
Source: MOSPI, Angel Research
Source: Market, Angel Research; Note: Level above 50 indicates expansion
Exhibit 5: Exports and imports growth trends
Exhibit 6: Key policy rates
(%)
Exports yoy growth
Imports yoy growth
(%)
Repo rate
Reverse Repo rate
CRR
30.0
9.00
20.0
8.00
10.0
7.00
0.0
6.00
(10.0)
5.00
(20.0)
4.00
(30.0)
3.00
Source: Bloomberg, Angel Research
Source: RBI, Angel Research
Market Outlook
August 28, 2015
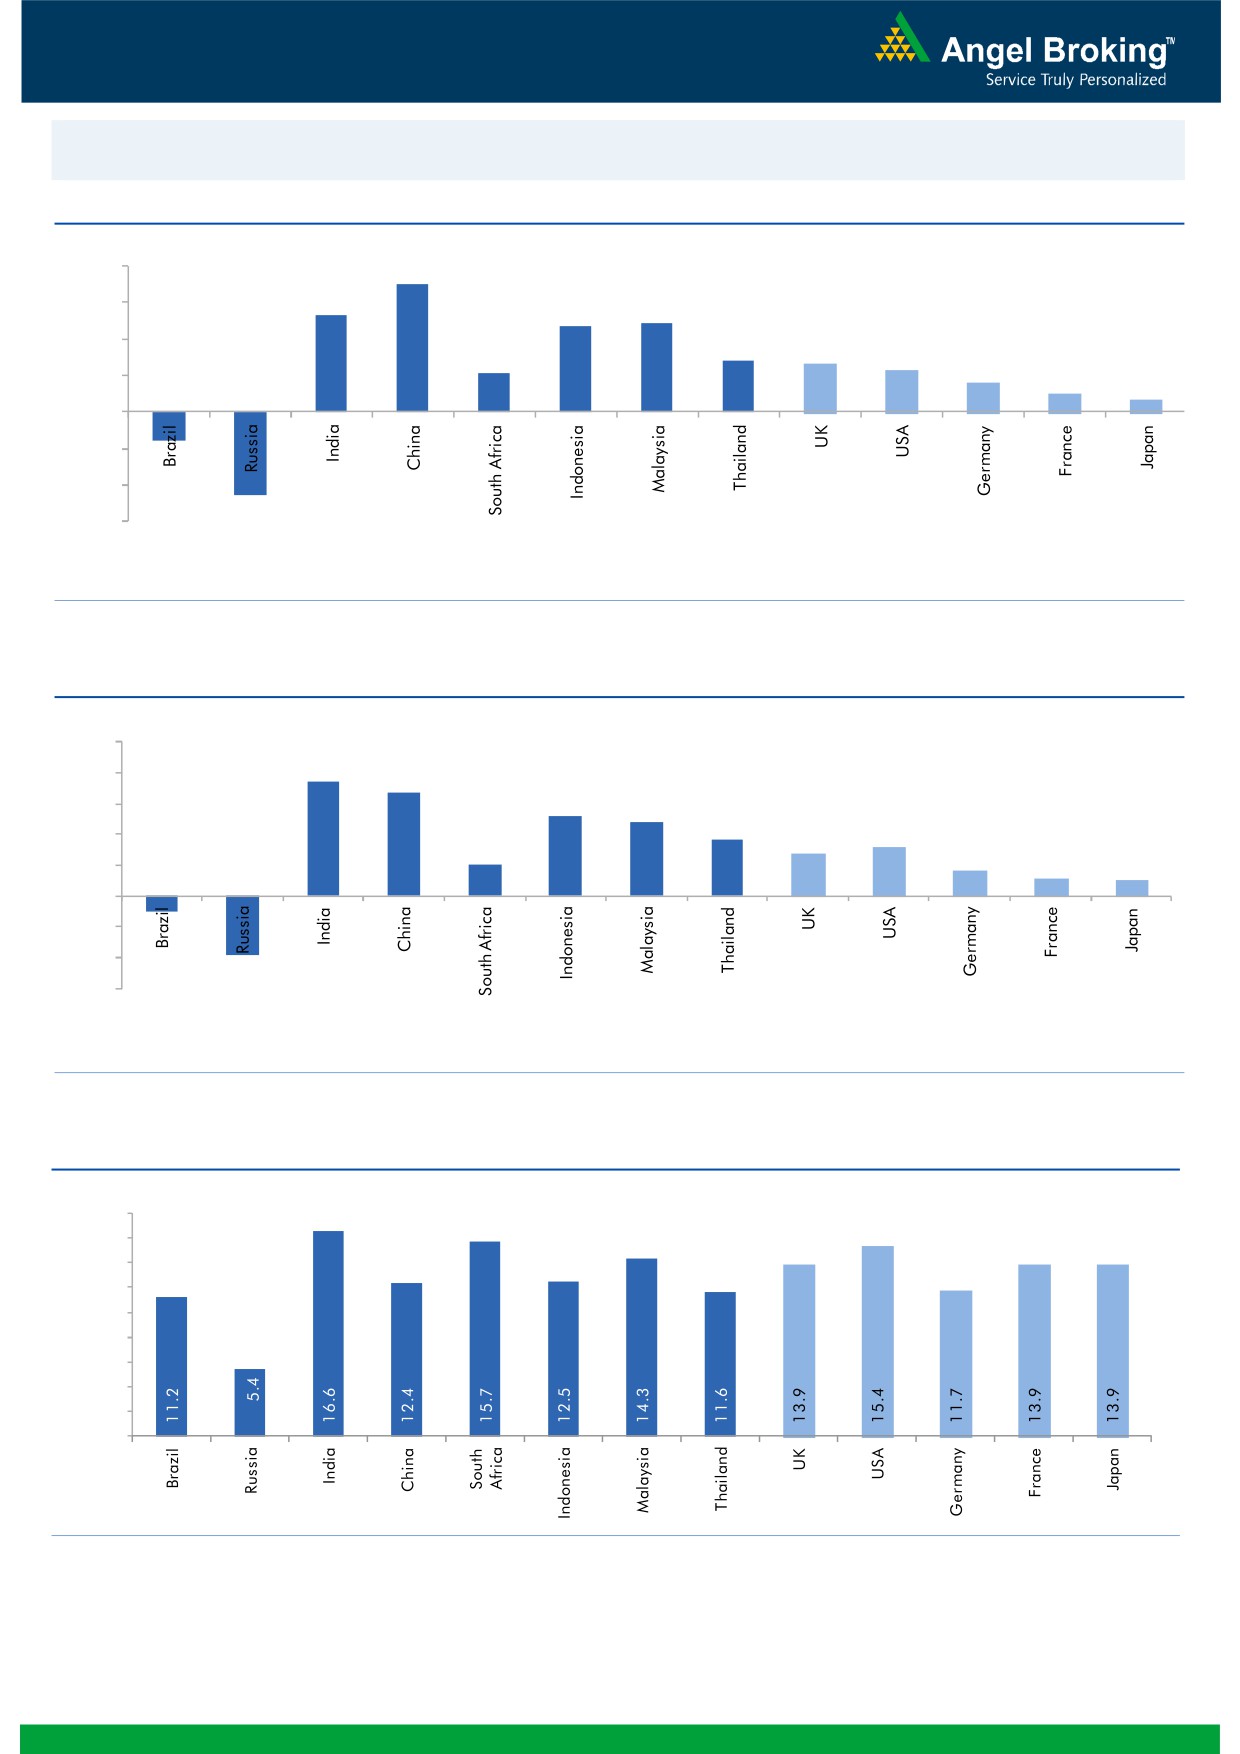
Global watch
Exhibit 1: Latest quarterly GDP Growth (%, yoy) across select developing and developed countries
(%)
8.0
7.0
6.0
5.3
4.9
4.7
4.0
2.8
2.6
2.1
2.3
1.6
2.0
1.0
(1.6)
0.7
(4.6)
-
(2.0)
(4.0)
(6.0)
Source: Bloomberg, Angel Research
Exhibit 2: 2015 GDP Growth projection by IMF (%, yoy) across select developing and developed countries
(%)
10.0
7.5
8.0
6.8
5.2
6.0
4.8
3.7
3.1
4.0
2.7
2.0
1.6
1.2
1.0
2.0
(3.8)
(1.0)
-
(2.0)
(4.0)
(6.0)
Source: IMF, Angel Research
Exhibit 3: One year forward P-E ratio across select developing and developed countries
(x)
18.0
16.0
14.0
12.0
10.0
8.0
6.0
4.0
2.0
-
Source: Bloomberg, Angel Research
Market Outlook
August 28, 2015
Exhibit 4: Relative performance of indices across globe
Returns (%)
Country
Name of index
Closing price
1M
3M
1YR
Brazil
Bovespa
47,715
(3.8)
(12.0)
(20.1)
Russia
Micex
1,695
5.7
2.3
17.5
India
Nifty
7,949
(4.7)
(5.7)
0.9
China
Shanghai Composite
3,084
(17.7)
(32.4)
39.2
South Africa
Top 40
43,625
(4.7)
(7.0)
(6.1)
Mexico
Mexbol
43,452
(1.7)
(2.8)
(4.7)
Indonesia
LQ45
755
(6.6)
(18.6)
(15.2)
Malaysia
KLCI
1,602
(5.1)
(7.8)
(13.4)
Thailand
SET 50
886
(6.0)
(11.0)
(14.7)
USA
Dow Jones
16,655
(5.5)
(8.1)
(2.5)
UK
FTSE
6,192
(5.5)
(11.3)
(9.3)
Japan
Nikkei
18,574
(6.4)
(7.6)
22.9
Germany
DAX
10,316
(7.7)
(9.6)
7.8
France
CAC
4,658
(6.4)
(7.0)
6.4
Source: Bloomberg, Angel Research
Market Outlook
August 28, 2015
Stock Watch
Company Name
Reco
CMP
Target
Mkt Cap
Sales ( Čcr )
OPM(%)
EPS (Č)
PER(x)
P/BV(x)
RoE(%)
EV/Sales(x)
(Č)
Price ( Č)
( Č cr )
FY16E FY17E
FY16E
FY17E
FY16E
FY17E
FY16E
FY17E
FY16E
FY17E
FY16E
FY17E
FY16E
FY17E
Agri / Agri Chemical
Rallis
Neutral
214
-
4,152
2,075
2,394
14.4
14.4
9.5
11.0
22.5
19.4
4.5
3.9
21.1
21.3
2.0
1.8
United Phosphorus
Neutral
520
-
22,275
13,698
15,752
17.6
17.6
32.1
38.5
16.2
13.5
3.2
2.6
21.4
21.3
1.7
1.4
Auto & Auto Ancillary
Ashok Leyland
Neutral
91
-
26,026
17,850
20,852
10.6
11.1
3.2
4.3
28.6
21.3
4.7
4.4
16.4
20.8
1.4
1.2
Bajaj Auto
Accumulate
2,189
2,454
63,351
23,842
27,264
19.8
19.6
128.4
144.4
17.1
15.2
5.2
4.5
30.5
29.5
2.2
1.9
Eicher Motors
Buy
18,772
22,859
50,950
11,681
15,550
15.3
16.9
358.5
564.3
52.4
33.3
15.7
11.7
29.8
34.9
4.2
3.2
Hero Motocorp
Accumulate
2,381
2,660
47,540
28,500
33,028
13.8
14.1
144.2
166.3
16.5
14.3
6.1
5.2
36.7
36.0
1.5
1.3
L G Balakrishnan & Bros Neutral
452
-
709
1,254
1,394
11.6
11.8
35.9
41.7
12.6
10.8
1.7
1.5
13.5
13.8
0.7
0.6
Mahindra and Mahindra Buy
1,232
1,493
76,500
40,088
45,176
13.8
14.0
59.6
70.4
20.7
17.5
3.4
3.0
16.6
17.2
1.6
1.3
Maruti
Accumulate
4,200
4,735
126,875
58,102
68,587
16.7
16.9
182.0
225.5
23.1
18.6
4.6
3.9
19.9
21.0
2.0
1.6
Minda Industries
Buy
529
652
839
2,567
2,965
7.3
8.0
38.8
54.3
13.6
9.7
2.0
1.6
14.4
16.8
0.4
0.4
Rane Brake Lining
Buy
295
366
234
454
511
11.1
11.4
23.8
28.1
12.4
10.5
1.8
1.6
14.2
15.3
0.6
0.6
Setco Automotive
Neutral
226
-
603
594
741
12.7
13.7
8.4
15.8
26.9
14.3
2.8
2.4
10.4
16.9
1.5
1.2
Tata Motors
Buy
335
432
96,635
267,464
307,211
13.7
13.7
34.6
40.7
9.7
8.2
1.2
1.1
13.2
13.6
0.5
0.5
TVS Motor
Accumulate
227
255
10,770
11,839
13,985
7.0
8.0
10.8
15.9
21.0
14.3
5.4
4.2
25.5
29.7
0.9
0.7
Amara Raja Batteries
Neutral
1,063
-
18,151
5,101
6,224
17.8
17.6
31.1
39.2
34.2
27.1
8.5
6.7
24.8
24.8
3.5
2.8
Exide Industries
Neutral
156
-
13,294
7,363
8,247
13.7
14.5
6.6
7.7
23.7
20.3
3.0
2.7
12.6
13.3
1.5
1.4
Apollo Tyres
Neutral
182
-
9,252
12,576
12,978
16.8
16.1
22.3
19.9
8.2
9.1
1.4
1.2
17.2
13.4
0.8
0.8
Ceat
Neutral
1,111
-
4,493
6,041
6,597
14.3
14.2
101.5
116.6
10.9
9.5
2.2
1.8
20.0
19.1
0.9
0.8
JK Tyres
Buy
109
129
2,479
7,446
7,669
15.2
14.0
19.6
18.4
5.6
5.9
1.4
1.2
25.2
19.5
0.7
0.6
Swaraj Engines
Neutral
889
-
1,105
593
677
14.5
14.8
51.2
60.8
17.4
14.6
4.1
3.6
23.3
24.8
1.7
1.5
Subros
Neutral
79
-
475
1,268
1,488
11.6
11.9
3.7
6.6
21.4
12.0
1.4
1.3
6.8
11.4
0.7
0.6
Indag Rubber
Neutral
182
-
477
283
329
17.0
17.2
13.0
15.4
14.1
11.8
3.1
2.6
21.8
21.6
1.4
1.2
Capital Goods
ACE
Neutral
42
-
414
660
839
4.7
8.2
1.0
3.9
41.9
10.7
1.3
1.2
3.2
11.3
0.8
0.6
BEML
Neutral
1,289
-
5,369
3,277
4,006
6.0
8.9
29.2
64.3
44.2
20.1
2.5
2.2
5.7
11.7
1.7
1.4
BGR Energy
Neutral
110
-
792
3,615
3,181
9.5
9.4
16.7
12.4
6.6
8.9
0.6
0.6
10.0
7.0
0.6
0.8
BHEL
Neutral
232
-
56,711
33,722
35,272
10.8
11.7
10.5
14.2
22.1
16.3
1.6
1.5
7.0
9.0
1.8
1.7
Blue Star
Accumulate
352
387
3,164
3,649
4,209
5.0
5.9
9.2
14.7
38.5
23.9
7.0
6.5
9.1
17.5
1.0
0.8
Crompton Greaves
Accumulate
181
204
11,325
13,484
14,687
4.9
6.2
4.5
7.1
40.2
25.5
2.8
2.7
7.2
10.8
1.0
0.9
Inox Wind
Buy
356
505
7,898
4,980
5,943
17.0
17.5
26.6
31.6
13.4
11.3
4.0
2.9
35.0
30.0
1.7
1.4
Market Outlook
August 28, 2015
Stock Watch
Company Name
Reco
CMP
Target
Mkt Cap
Sales ( Čcr )
OPM(%)
EPS (Č)
PER(x)
P/BV(x)
RoE(%)
EV/Sales(x)
(Č)
Price ( Č)
( Č cr )
FY16E
FY17E
FY16E
FY17E
FY16E
FY17E
FY16E
FY17E
FY16E
FY17E
FY16E
FY17E
FY16E
FY17E
Capital Goods
KEC International
Neutral
132
-
3,399
8,791
9,716
6.1
6.8
5.4
8.2
24.5
16.1
2.5
2.2
10.0
14.0
0.6
0.6
Thermax
Neutral
978
-
11,652
6,413
7,525
7.4
8.5
30.5
39.3
32.1
24.9
4.9
4.3
15.0
17.0
1.8
1.5
Cement
ACC
Accumulate
1,371
1,548
25,736
11,856
14,092
14.5
17.8
47.6
76.1
28.8
18.0
3.0
2.7
10.6
15.7
2.0
1.7
Ambuja Cements
Accumulate
210
233
32,605
10,569
12,022
20.7
22.2
8.7
10.7
24.2
19.6
3.1
2.9
13.0
15.2
2.7
2.4
India Cements
Buy
73
112
2,235
4,716
5,133
15.9
16.9
3.7
7.5
19.7
9.7
0.7
0.7
3.8
7.3
0.8
0.7
JK Cement
Buy
621
767
4,338
4,056
4,748
14.5
17.0
22.6
41.1
27.5
15.1
2.5
2.2
9.3
15.3
1.5
1.2
J K Lakshmi Cement
Buy
346
430
4,072
2,947
3,616
16.7
19.9
11.5
27.2
30.1
12.7
2.9
2.5
9.8
20.8
1.8
1.4
Mangalam Cements
Neutral
226
-
602
1,053
1,347
10.5
13.3
8.4
26.0
26.9
8.7
1.1
1.1
4.3
12.5
1.0
0.7
Orient Cement
Accumulate
164
183
3,362
1,854
2,524
21.2
22.2
7.7
11.1
21.3
14.8
3.1
2.6
13.3
15.7
2.6
1.8
Ramco Cements
Accumulate
327
350
7,777
4,036
4,545
20.8
21.3
15.1
18.8
21.6
17.4
2.6
2.4
12.9
14.3
2.4
2.1
Shree Cement^
Neutral
10,830
-
37,727
7,150
8,742
26.7
28.6
228.0
345.5
47.5
31.4
7.0
5.9
15.7
20.3
5.0
4.0
UltraTech Cement
Accumulate
2,902
3,282
79,638
27,562
31,548
20.4
22.3
111.9
143.3
25.9
20.3
3.7
3.2
15.2
16.8
3.0
2.5
Construction
ITNL
Neutral
93
-
2,285
7,360
8,825
34.0
35.9
1.0
5.0
92.6
18.5
0.4
0.4
0.3
1.4
3.7
3.6
KNR Constructions
Neutral
547
-
1,537
915
1,479
14.3
13.9
20.3
37.2
26.9
14.7
2.5
2.1
9.6
15.6
1.8
1.1
Larsen & Toubro
Buy
1,621
2,013
150,818
68,920
82,446
10.9
11.5
57.0
73.0
28.4
22.2
2.6
2.4
13.6
15.5
2.4
2.0
Gujarat Pipavav Port
Neutral
190
-
9,173
740
843
53.1
53.6
8.0
10.0
23.7
19.0
3.7
3.0
20.4
19.4
12.0
10.1
MBL Infrastructures
Buy
239
360
989
2,313
2,797
12.2
14.6
19.0
20.0
12.6
11.9
1.3
1.2
11.3
10.6
1.1
1.0
Nagarjuna Const.
Neutral
74
74
4,108
7,892
8,842
8.3
9.1
2.4
5.3
30.8
13.9
1.2
1.2
4.2
8.6
0.8
0.6
PNC Infratech
Neutral
481
-
2,469
1,798
2,132
13.2
13.5
22.0
30.0
21.9
16.0
2.0
1.8
11.5
11.4
1.5
1.2
Simplex Infra
Neutral
308
308
1,524
6,241
7,008
10.4
10.7
20.0
36.0
15.4
8.6
1.3
1.1
6.8
11.1
0.7
0.6
Financials
Allahabad Bank
Neutral
85
-
4,854
8,859
9,817
3.0
3.0
23.7
30.1
3.6
2.8
0.4
0.4
10.6
12.3
-
-
Axis Bank
Buy
509
716
120,989
26,522
31,625
3.6
3.6
36.2
45.4
14.1
11.2
2.8
2.4
18.2
19.6
-
-
Bank of Baroda
Neutral
188
-
41,477
18,934
21,374
2.0
2.0
13.2
15.1
14.2
12.4
1.1
1.0
7.1
7.7
-
-
Bank of India
Neutral
143
-
9,492
17,402
20,003
2.0
2.1
40.3
50.7
3.5
2.8
0.4
0.3
9.0
10.4
-
-
Canara Bank
Neutral
289
-
14,879
15,805
17,745
2.0
2.2
64.3
73.5
4.5
3.9
0.5
0.5
10.8
11.3
-
-
Dena Bank
Neutral
43
-
2,424
3,580
4,040
2.1
2.2
8.4
10.9
5.2
4.0
0.5
0.4
6.8
8.4
-
-
Federal Bank
Neutral
62
-
10,598
3,522
4,045
3.2
3.2
12.2
14.1
5.1
4.4
0.6
0.6
12.9
13.4
-
-
HDFC
Neutral
1,195
-
188,409
11,198
13,321
3.5
3.5
45.1
53.7
26.5
22.3
5.5
4.9
27.2
28.2
-
-
HDFC Bank
Buy
1,023
1,255
257,144
38,629
47,500
4.5
4.7
52.6
66.4
19.5
15.4
3.6
3.0
19.6
21.2
-
-
Market Outlook
August 28, 2015
Stock Watch
Company Name
Reco
CMP
Target
Mkt Cap
Sales ( Čcr )
OPM(%)
EPS (Č)
PER(x)
P/BV(x)
RoE(%)
EV/Sales(x)
(Č)
Price ( Č)
( Č cr )
FY16E FY17E
FY16E
FY17E
FY16E
FY17E
FY16E
FY17E
FY16E
FY17E
FY16E
FY17E
FY16E
FY17E
Financials
ICICI Bank
Buy
284
370
164,641
36,037
41,647
3.5
3.6
22.9
26.7
12.4
10.6
2.1
1.8
15.7
15.9
-
-
IDBI Bank
Neutral
59
-
9,415
9,806
11,371
1.7
1.9
10.0
16.3
5.9
3.6
0.4
0.4
6.8
10.4
-
-
Indian Bank
Neutral
133
-
6,405
6,454
7,321
2.5
2.6
26.4
33.3
5.1
4.0
0.4
0.4
8.1
9.6
-
-
LIC Housing Finance
Buy
446
570
22,490
2,934
3,511
2.3
2.3
30.9
36.8
14.4
12.1
2.3
2.0
16.8
17.5
-
-
Oriental Bank
Neutral
134
-
4,019
7,930
8,852
2.5
2.5
51.8
57.1
2.6
2.4
0.3
0.3
9.3
9.5
-
-
Punjab Natl.Bank
Neutral
146
-
27,086
24,160
27,777
2.9
3.0
18.5
24.6
7.9
5.9
0.8
0.7
8.8
10.8
-
-
South Ind.Bank
Neutral
21
-
2,815
1,999
2,249
2.4
2.4
3.5
4.0
6.0
5.2
0.8
0.7
12.6
13.1
-
-
St Bk of India
Buy
249
309
188,739
86,900
100,550
3.1
3.1
22.1
27.7
11.3
9.0
1.4
1.2
12.7
14.3
-
-
Union Bank
Neutral
181
-
11,492
12,995
14,782
2.4
2.4
32.3
40.9
5.6
4.4
0.7
0.6
10.7
12.3
-
-
Vijaya Bank
Neutral
36
-
3,114
3,474
3,932
1.8
1.9
5.9
7.2
6.2
5.0
0.5
0.5
8.1
9.3
-
-
Yes Bank
Buy
687
989
28,757
7,006
8,825
3.1
3.3
61.4
77.1
11.2
8.9
2.1
1.8
20.1
21.3
-
-
FMCG
Asian Paints
Neutral
855
-
81,997
16,553
19,160
16.0
16.2
17.7
21.5
48.4
39.8
12.8
11.6
29.4
31.2
4.8
4.1
Britannia
Neutral
2,942
-
35,293
8,065
9,395
9.6
10.2
47.2
65.5
62.3
44.9
20.7
19.6
38.3
41.2
4.2
3.6
Colgate
Neutral
1,944
-
26,441
4,836
5,490
19.5
19.7
48.5
53.2
40.1
36.5
29.4
25.6
99.8
97.5
5.4
4.7
Dabur India
Neutral
284
-
49,955
9,370
10,265
17.1
17.2
7.3
8.1
38.8
35.1
11.7
9.5
33.7
30.6
5.2
4.8
GlaxoSmith Con*
Neutral
6,151
-
25,869
4,919
5,742
17.2
17.4
168.3
191.2
36.6
32.2
10.4
8.8
28.8
28.9
4.8
4.1
Godrej Consumer
Neutral
1,250
-
42,575
10,168
12,886
16.1
16.1
32.1
38.4
39.0
32.6
7.9
7.3
19.7
21.0
4.3
3.4
HUL
Neutral
858
-
185,659
34,940
38,957
17.5
17.7
20.8
24.7
41.3
34.7
45.9
36.7
110.5
114.2
5.1
4.6
ITC
Buy
326
409
261,483
41,068
45,068
37.8
37.4
13.9
15.9
23.4
20.5
7.9
6.9
34.1
33.8
6.0
5.4
Marico
Neutral
412
-
26,561
6,551
7,766
15.7
16.0
10.4
12.5
39.7
32.9
11.5
9.6
33.2
32.4
4.0
3.4
Nestle*
Accumulate
6,060
6,646
58,429
11,291
12,847
22.2
22.3
158.9
184.6
38.1
32.8
19.9
17.9
55.0
57.3
5.0
4.4
Tata Global
Buy
116
152
7,337
8,635
9,072
9.8
9.9
6.5
7.6
17.9
15.3
1.8
1.7
6.8
7.4
0.8
0.7
IT
HCL Tech^
Buy
914
1,132
128,497
42,038
47,503
23.5
23.5
56.4
62.9
16.2
14.5
3.8
2.9
23.2
19.8
2.7
2.1
Infosys
Buy
1,084
1,306
249,012
60,250
66,999
28.0
28.0
58.3
63.7
18.6
17.0
3.9
3.4
20.9
19.7
3.4
2.9
TCS
Buy
2,578
3,168
504,882
108,420
123,559
28.8
28.7
127.2
143.9
20.3
17.9
8.1
7.5
39.9
41.8
4.2
3.7
Tech Mahindra
Buy
519
646
49,951
25,566
28,890
16.0
17.0
26.3
31.9
19.8
16.3
3.6
3.0
17.9
18.6
1.7
1.5
Wipro
Buy
551
719
136,000
52,414
58,704
23.7
23.8
38.4
42.3
14.3
13.0
2.8
2.5
19.5
18.0
2.2
1.8
Media
D B Corp
Buy
301
356
5,529
2,241
2,495
27.8
27.9
21.8
25.6
13.8
11.8
3.6
3.2
26.7
28.5
2.4
2.2
HT Media
Neutral
83
-
1,926
2,495
2,603
11.2
11.2
7.3
8.6
11.3
9.6
0.9
0.8
7.4
8.1
0.3
0.3
Market Outlook
August 28, 2015
Stock Watch
Company Name
Reco
CMP
Target
Mkt Cap
Sales ( Čcr )
OPM(%)
EPS (Č)
PER(x)
P/BV(x)
RoE(%)
EV/Sales(x)
(Č)
Price ( Č)
( Č cr )
FY16E FY17E
FY16E
FY17E
FY16E
FY17E
FY16E
FY17E
FY16E
FY17E
FY16E
FY17E
FY16E
FY17E
Media
Jagran Prakashan
Buy
136
156
4,433
1,939
2,122
26.0
26.0
8.3
9.2
16.3
14.7
2.8
2.5
17.5
17.1
2.2
2.0
Sun TV Network
Neutral
341
-
13,446
2,779
3,196
70.2
70.5
22.8
27.3
15.0
12.5
3.7
3.3
26.7
28.3
4.6
4.0
Hindustan Media
Buy
219
292
1,611
920
1,031
20.0
20.0
19.2
20.9
11.4
10.5
1.9
1.6
16.4
15.3
1.3
1.1
Ventures
Metals & Mining
Coal India
Accumulate
361
400
228,021
72,015
78,415
21.2
21.5
21.7
25.3
16.6
14.3
5.6
5.6
33.1
39.1
2.4
2.2
Hind. Zinc
Neutral
130
-
54,950
15,546
16,821
47.5
49.0
19.7
20.3
6.6
6.4
1.1
1.0
17.2
16.6
1.3
0.9
Hindalco
Neutral
81
-
16,644
112,328
119,817
7.7
7.9
16.3
20.1
5.0
4.0
0.4
0.3
8.0
8.5
0.6
0.5
JSW Steel
Neutral
931
-
22,492
48,125
53,595
18.8
21.0
46.9
97.5
19.8
9.5
1.0
0.9
4.4
9.5
1.3
1.1
NMDC
Neutral
97
-
38,478
12,544
13,330
59.5
59.7
16.3
16.5
6.0
5.9
1.1
1.0
5.1
9.9
1.8
1.8
SAIL
Neutral
51
-
20,857
56,365
63,383
6.9
8.0
7.1
8.2
7.1
6.2
0.4
0.4
7.0
7.1
0.9
0.8
Vedanta
Neutral
91
-
27,023
81,842
88,430
30.6
32.8
20.2
25.7
4.5
3.6
0.3
0.3
7.5
8.5
0.7
0.5
Tata Steel
Neutral
226
-
21,935
136,805
149,228
11.3
11.9
26.4
36.8
8.6
6.1
0.7
0.6
6.0
8.0
0.7
0.6
Oil & Gas
Cairn India
Neutral
140
-
26,182
12,617
14,513
33.7
40.0
25.5
27.7
5.5
5.0
0.4
0.4
7.4
7.7
0.7
0.6
GAIL
Neutral
281
-
35,632
75,595
85,554
8.6
8.0
31.8
36.1
8.8
7.8
1.0
0.9
10.7
11.4
0.6
0.5
ONGC
Neutral
231
-
197,418
174,773
192,517
22.7
24.8
34.6
38.2
6.7
6.0
1.0
0.9
14.2
14.9
1.2
1.1
Petronet LNG
Accumulate
183
210
13,706
39,007
40,785
3.8
4.2
9.2
11.0
20.0
16.7
2.2
2.0
11.6
12.7
0.4
0.4
Indian Oil Corp
Accumulate
410
455
99,510
359,607
402,760
5.9
6.1
42.5
48.7
9.7
8.4
1.3
1.1
14.1
14.4
0.4
0.3
Reliance Industries
Buy
870
1,050
281,573
339,083
384,014
7.8
9.5
75.7
94.5
11.5
9.2
1.1
1.1
10.7
12.2
1.2
1.0
Pharmaceuticals
Alembic Pharma
Neutral
699
-
13,186
2,601
3,115
21.2
20.2
20.8
23.9
33.6
29.3
10.8
8.2
37.2
31.8
5.1
4.2
Aurobindo Pharma
Accumulate
744
824
43,441
14,435
16,600
22.6
22.6
36.1
41.2
20.6
18.1
6.1
4.7
34.5
29.3
3.4
2.9
Aventis*
Neutral
3,976
-
9,156
2,156
2,455
15.1
16.8
109.7
133.9
36.2
29.7
5.0
4.1
18.4
22.5
3.9
3.3
Cadila Healthcare
Neutral
1,903
-
38,961
10,224
11,840
20.0
21.0
71.0
85.6
26.8
22.2
7.2
5.7
30.1
28.5
3.9
3.3
Cipla
Neutral
661
-
53,097
14,051
16,515
20.4
18.7
26.6
28.4
24.9
23.3
4.2
3.6
18.2
16.5
3.8
3.1
Dr Reddy's
Neutral
4,132
-
70,437
17,903
20,842
22.7
22.8
160.5
189.5
25.7
21.8
5.2
4.3
22.2
21.7
3.9
3.3
Dishman Pharma
Buy
199
278
1,605
1,716
1,888
20.2
20.2
16.3
21.6
12.2
9.2
1.1
1.0
9.7
11.7
1.1
0.9
GSK Pharma*
Neutral
3,359
-
28,451
2,870
3,158
20.0
22.1
59.5
68.3
56.5
49.2
16.7
17.1
28.5
34.3
9.4
8.6
Indoco Remedies
Neutral
327
-
3,014
1,088
1,262
18.2
18.2
13.1
15.5
25.0
21.1
4.9
4.1
21.2
21.1
2.8
2.4
Ipca labs
Neutral
779
-
9,829
3,507
4,078
17.6
18.6
25.8
32.0
30.2
24.4
3.9
3.4
13.8
14.9
3.1
2.6
Lupin
Neutral
1,899
-
85,419
14,864
17,244
26.9
26.9
62.1
71.1
30.6
26.7
7.4
5.9
27.4
24.6
5.5
4.6
Sun Pharma
Accumulate
903
950
217,301
28,163
32,610
25.8
30.7
17.4
26.9
51.9
33.6
4.9
4.3
13.0
16.6
7.2
6.0
Market Outlook
August 28, 2015
Stock Watch
Company Name
Reco
CMP
Target
Mkt Cap
Sales ( Čcr )
OPM(%)
EPS (Č)
PER(x)
P/BV(x)
RoE(%)
EV/Sales(x)
(Č)
Price ( Č)
( Č cr )
FY16E FY17E
FY16E
FY17E
FY16E
FY17E
FY16E
FY17E
FY16E
FY17E
FY16E
FY17E
FY16E
FY17E
Power
Tata Power
Neutral
61
-
16,377
38,302
38,404
14.1
13.1
5.1
6.0
11.8
10.2
1.1
1.1
9.2
10.3
1.3
1.3
NTPC
Buy
119
157
98,245
87,064
98,846
23.5
23.5
11.7
13.2
10.2
9.0
1.1
1.1
11.4
12.1
2.2
1.9
Power Grid
Buy
135
170
70,679
20,702
23,361
86.7
86.4
12.1
13.2
11.2
10.2
1.6
1.5
15.6
15.1
8.3
7.8
Telecom
Bharti Airtel
Neutral
347
-
138,850
101,748
109,191
32.1
31.7
12.0
12.5
29.0
27.8
2.0
1.9
6.9
6.7
2.0
1.8
Idea Cellular
Neutral
152
-
54,628
34,282
36,941
32.0
31.5
5.9
6.2
25.7
24.5
2.4
2.1
9.9
9.3
2.2
2.0
zOthers
Abbott India
Neutral
4,771
-
10,139
2,715
3,153
14.5
14.1
134.3
152.2
35.5
31.3
8.9
7.3
27.4
25.6
3.5
2.9
Bajaj Electricals
Buy
240
341
2,424
4,719
5,287
5.2
5.8
8.6
12.7
28.1
19.0
3.2
2.8
11.4
14.8
0.5
0.5
Finolex Cables
Neutral
244
-
3,725
2,728
3,036
10.8
11.0
14.4
16.8
16.9
14.5
2.6
2.2
15.2
15.3
1.1
0.9
Goodyear India*
Buy
568
655
1,309
1,953
1,766
12.4
12.0
67.4
59.6
8.4
9.5
2.1
1.8
27.7
20.2
0.5
0.4
Hitachi
Neutral
1,368
-
3,718
1,806
2,112
9.0
9.2
28.6
29.1
47.8
47.0
11.9
9.6
28.1
22.6
2.1
1.8
Jyothy Laboratories
Neutral
308
-
5,572
1,620
1,847
11.5
11.5
7.3
8.5
42.2
36.3
5.5
5.1
13.3
14.4
3.3
2.8
MRF
Accumulate
41,026
43,575
17,400
20,727
14,841
19.3
18.6
4,905.8
3,351.9
8.4
12.2
2.7
2.2
37.6
19.6
0.8
1.1
Page Industries
Neutral
14,530
-
16,206
1,929
2,450
19.8
20.1
229.9
299.0
63.2
48.6
27.9
19.4
52.1
47.1
8.4
6.6
Relaxo Footwears
Neutral
539
-
6,471
1,767
2,152
12.3
12.5
19.3
25.1
28.0
21.5
6.9
5.3
27.7
27.8
3.7
3.0
Siyaram Silk Mills
Buy
1,054
1,221
988
1,653
1,873
11.7
12.2
99.3
122.1
10.6
8.6
1.9
1.6
19.5
20.2
0.8
0.7
Styrolution ABS India*
Neutral
762
-
1,339
1,271
1,440
8.6
9.2
32.0
41.1
23.8
18.6
2.4
2.2
10.7
12.4
1.0
0.9
Tree House
Accumulate
399
449
1,688
259
324
56.8
56.8
17.0
21.7
23.4
18.4
2.4
2.1
10.1
11.5
6.4
5.3
TVS Srichakra
Buy
2,561
3,210
1,961
2,127
2,388
15.2
14.9
237.7
267.5
10.8
9.6
4.6
3.3
51.7
39.8
1.0
0.8
HSIL
Buy
268
434
1,935
2,085
2,436
18.5
18.6
21.7
28.9
12.4
9.3
1.2
1.1
10.0
12.1
1.1
0.8
Kirloskar Engines India
Accumulate
273
297
3,942
2,634
3,252
10.1
12.0
10.9
17.4
25.0
15.6
2.8
2.5
11.4
16.8
1.1
0.9
Ltd
M M Forgings
Buy
624
797
753
563
671
22.1
22.9
51.0
66.5
12.2
9.4
2.6
2.0
23.1
24.1
1.5
1.2
Banco Products (India)
Neutral
126
-
900
1,208
1,353
11.0
12.3
10.8
14.5
11.7
8.7
1.3
1.2
11.9
14.5
0.7
0.6
Competent Automobiles Neutral
164
-
101
1,007
1,114
3.1
3.1
23.7
28.2
6.9
5.8
1.0
0.9
13.9
14.6
0.1
0.1
Nilkamal
Neutral
974
-
1,454
1,948
2,147
10.6
10.3
60.0
67.0
16.2
14.5
2.5
2.2
16.8
16.1
0.8
0.7
Visaka Industries
Accumulate
154
166
245
1,158
1,272
8.6
9.5
23.7
32.7
6.5
4.7
0.7
0.6
10.1
12.5
0.4
0.3
Transport Corporation of
Buy
253
293
1,928
2,830
3,350
8.8
9.0
14.4
18.3
17.6
13.8
2.7
2.4
15.4
17.1
0.8
0.7
India
Elecon Engineering
Buy
71
87
778
1,452
1,596
14.0
14.7
4.4
6.2
16.2
11.5
1.4
1.2
8.6
11.2
0.8
0.7
Surya Roshni
Buy
127
183
554
2,992
3,223
8.3
8.5
14.7
18.3
8.6
6.9
0.8
0.7
9.8
11.0
0.5
0.4
MT Educare
Buy
131
169
520
286
366
18.3
17.7
7.7
9.4
16.9
13.9
3.6
3.1
20.2
21.1
1.7
1.3
Market Outlook
August 28, 2015
Stock Watch
Company Name
Reco
CMP
Target Mkt Cap
Sales ( Čcr )
OPM(%)
EPS (Č)
PER(x)
P/BV(x)
RoE(%)
EV/Sales(x)
(Č)
Price ( Č)
( Č cr )
FY16E FY17E FY16E FY17E FY16E FY17E FY16E FY17E FY16E FY17E FY16E FY17E FY16E FY17E
zOthers
Radico Khaitan
Buy
94
112
1,245
1,565
1,687
11.9
12.4
5.4
6.6
17.3
14.2
1.4
1.3
8.0
9.0
1.3
1.2
Garware Wall Ropes
Buy
302
390
661
875
983
10.4
10.6
23.1
27.8
13.1
10.9
1.9
1.6
14.1
14.8
0.8
0.6
Source: Company, Angel Research; Note: *December year end; #September year end; &October year end; Price as on August 27, 2015
Market Outlook
August 28, 2015
Research Team Tel: 022 - 39357800
DISCLAIMER
Angel Broking Private Limited (hereinafter referred to as “Angel”) is a registered Member of National Stock Exchange of India Limited,
Bombay Stock Exchange Limited and MCX Stock Exchange Limited. It is also registered as a Depository Participant with CDSL and
Portfolio Manager with SEBI. It also has registration with AMFI as a Mutual Fund Distributor. Angel Broking Private Limited is a registered
entity with SEBI for Research Analyst in terms of SEBI (Research Analyst) Regulations, 2014 vide registration number INH000000164.
Angel or its associates has not been debarred/ suspended by SEBI or any other regulatory authority for accessing /dealing in securities
Market. Angel or its associates including its relatives/analyst do not hold any financial interest/beneficial ownership of more than 1% in
the company covered by Analyst. Angel or its associates/analyst has not received any compensation / managed or co-managed public
offering of securities of the company covered by Analyst during the past twelve months. Angel/analyst has not served as an officer,
director or employee of company covered by Analyst and has not been engaged in market making activity of the company covered by
Analyst.
This document is solely for the personal information of the recipient, and must not be singularly used as the basis of any investment
decision. Nothing in this document should be construed as investment or financial advice. Each recipient of this document should make
such investigations as they deem necessary to arrive at an independent evaluation of an investment in the securities of the companies
referred to in this document (including the merits and risks involved), and should consult their own advisors to determine the merits and
risks of such an investment.
Reports based on technical and derivative analysis center on studying charts of a stock's price movement, outstanding positions and
trading volume, as opposed to focusing on a company's fundamentals and, as such, may not match with a report on a company's
fundamentals.
The information in this document has been printed on the basis of publicly available information, internal data and other reliable sources
believed to be true, but we do not represent that it is accurate or complete and it should not be relied on as such, as this document is for
general guidance only. Angel Broking Pvt. Limited or any of its affiliates/ group companies shall not be in any way responsible for any
loss or damage that may arise to any person from any inadvertent error in the information contained in this report. Angel Broking Pvt.
Limited has not independently verified all the information contained within this document. Accordingly, we cannot testify, nor make any
representation or warranty, express or implied, to the accuracy, contents or data contained within this document. While Angel Broking
Pvt. Limited endeavors to update on a reasonable basis the information discussed in this material, there may be regulatory, compliance,
or other reasons that prevent us from doing so.
This document is being supplied to you solely for your information, and its contents, information or data may not be reproduced,
redistributed or passed on, directly or indirectly.
Neither Angel Broking Pvt. Limited, nor its directors, employees or affiliates shall be liable for any loss or damage that may arise from or
in connection with the use of this information.
Note: Please refer to the important ‘Stock Holding Disclosure' report on the Angel website (Research Section). Also, please refer to the
latest update on respective stocks for the disclosure status in respect of those stocks. Angel Broking Pvt. Limited and its affiliates may have
investment positions in the stocks recommended in this report.