Market Outlook
January 28, 2016
Market Cues
Domestic Indices
Chg (%)
(Pts)
(Close)
Indian markets are expected to open flat tracking the SGX Nifty.
BSE Sensex
0.0
6
24,492
U.S. stocks closed more than 1% lower on Wednesday, despite high oil prices, as
Nifty
0.0
2
7,438
disappointing quarterly reports weighed and Fed statement renewed concerns about
Mid Cap
0.3
31
10,248
the global economic growth. As expected Fed kept rates unchanged, but
Small Cap
0.6
61
10,759
commented that it was closely monitoring global economic and financial
Bankex
(0.1)
(21)
17,642
developments. Lower than expected results led to 6.5% and 8.9% correction in the
Apple and Boeing stocks, respectively.
Global Indices
Chg (%)
(Pts)
(Close)
Britain’s benchmark index FTSE backtracked in the afternoon trade, reversing its
losses made earlier in the day. On the back of higher oil prices, despite jitters about
Dow Jones
(1.4)
(223)
15,944
the state of the Chinese economy, FTSE 100 closed up 1.3%. Shell shareholders
Nasdaq
(2.2)
(100)
4,468
approval of the £40bn takeover of BG Group, helped both companies shares
FTSE
1.3
79
5,990
advance by ~3%.
Nikkei
2.7
455
17,164
Indian stock markets ended almost on a flat note after swinging between minor
Hang Seng
1.0
192
19,052
gains and losses, as investors avoided risky bets ahead of U.S. Federal Reserve
Shanghai Com
(0.5)
(14)
2,736
policy meeting scheduled later in the day. NTPC, Dr Reddy's, Tata Motors and Tata
Steel were top gainers, whereas, BHEL, HUL, Hero MotoCorp, Adani Ports were
losers in the Sensex.
Advances / Declines
BSE
NSE
Advances
1,365
1,059
News & Result Analysis
Declines
1,215
517
Firms want NHPC to run `1 lakh cr hydro projects
Unchanged
183
69
Result Review: KOEL, BEL, HDFC
Detailed analysis on Pg2
Volumes (` Cr)
Investor’s Ready Reckoner
BSE
2,657
Key Domestic & Global Indicators
NSE
15,223
Stock Watch: Latest investment recommendations on 150+ stocks
Refer P7 onwards
Net Inflows (` Cr)
Net
Mtd
Ytd
Top Picks
FII
122
(11,678)
(2,000)
CMP
Target
Upside
Company
Sector
Rating
MFs
32
5,056
74,473
(`)
(`)
(%)
Amara Raja Batteries Auto & Auto Ancillary
Buy
822
1,040
26.5
HCL Tech
IT
Buy
835
1,132
24.3
Top Gainers
Price (`)
Chg (%)
Larsen & Toubro
Construction
Buy
1,107
1,646
48.6
Sparc
310
10.9
LIC Housing Finance Financials
Buy
480
592
23.4
Unionbank
130
9.7
Navkar Corporation Others
Buy
195
265
35.8
Tataelxsi
1,951
7.1
More Top Picks on Pg6
Il&Fstrans
80
6.9
Vakrangee
181
6.1
Key Upcoming Events
Previous
Consensus
Date
Region
Event Description
Reading
Expectations
Top Losers
Price (`)
Chg (%)
Jan 28
UK
GDP (YoY)
2.10
1.90
Bluedart
6,063
(4.5)
USA
FOMC rate decision
0.50
0.50
Aplltd
602
(4.5)
Jan 29
USA
GDP (QoQ, Annualised)
2.00
0.80
Feb 01
Ger
Unemployment change (‘000s)
(14.00)
Bhel
140
(4.1)
Unitdspr
2,592
(4.0)
Rcom
63
(3.9)
As on January 27, 2015
Market Outlook
January 28, 2016
Firms want NHPC to run `1 lakh cr hydro projects
~17,000MW of hydropower projects with cumulative cost of `1,63,000cr have
applied to NHPC to either take them over or form operational Joint Ventures (JVs).
Of these, 3 projects totaling over 5,500MW capacity belong to Jindal Power are at
different stages of development. Most of these projects being offered to NHPC
were awarded during 2008-2010 and are from Arunachal Pradesh and Sikkim.
Besides Jindal Power, NHPC has been approached by Hydro Power players like
IL&FS, Lanco and Bihar and Arunachal Pradesh state governments.
Exhibit 1: Power Projects proposal with NHPC
Location
State
MW
Current Promoter/ Name of SPV
TPC (` cr)
Etalin
A. P.
3,097
Jindal Power
14,000
Kamala
A. P.
1,800
Jindal Power
10,800
Attunli
A. P.
680
Jindal Power
2,725
Siang Upper stage-I A. P.
6,000
Jindal Power
100,000
Teesta VI
Sikkim
500
Lanco Teesta Hydro Power
5,000
Panam
Sikkim
300
Himagiri Hydro Power
1,833
Rangit
Sikkim
120
Jal Power Corporation
1,600
Chamkharchhu
Bhutan
770
NHPC JV with Dunk Green Power Corp.
6,407
Sankosh
Bhutan 2,560
India + Bhutan govt.
11,472
Pirpainti
Bihar
1,320
Govt. of Bihar + IL&FS
9,240
Totals
163,077
Source: Media Reports, Angel Research
Of these over 17,000MW of Hydro-projects, ~11,500MW of Hydro power
projects are from Arunachal Pradesh, where the projects have faced regulatory
hurdles, strikes by the local population and protests by environment protection
groups. As a result, these projects awarded over 5 years back have witnessed huge
cost over-runs, thereby pushing up the final power tariff rates to over `5/unit,
which makes the project unviable.
Further, if we consider the declining trend in power tariff rates from highs of `7-
10/unit in FY2006-07 to `2-3/unit as seen in the last 2-3 years, it strengthens our
view that these projects are now unattractive and unviable.
Considering the unfavorable project dynamics, we are of view that NHPC would
not consider running/ acquiring these assets. Management on same lines has
highlighted that it would not take over such projects, but, consider consultancy role
for such projects.
Result Review
Kirloskar Oil Engines Ltd (CMP: `250/ TP: -/ Upside: -)
For 3QFY2016, Kirloskar Oil Engines (KOEL) reported a disappointing set of
numbers. The top-line for the quarter declined by 1.8% yoy to `601cr mainly
owing to absence of large engines orders. The top-line was below our estimate of
`630cr. The power gen segment which account for ~45% of total revenue grew by
5% yoy to `267cr, agricultural segment grew by 23% yoy to `129cr, industrial and
customer support remained flat while large engines business declined by 62% yoy
to `26cr.
Market Outlook
January 28, 2016
The employee expense as percentage of sales increased by 34bp yoy to 8.5%, and
other expenses as percentage of sales increased by 181bp yoy to 19.6% of sales.
This resulted in EBITDA margin contracting by 137bp yoy to 8.1%, which is lower
than our estimate of 9.1%. There was an exceptional expense of `10.4cr during
the quarter related to Voluntary Retirement Scheme (VRS). Adjusting for the VRS
expense, the net profit declined by 14.9% yoy to `29cr (against our estimate of
`34cr).
Currently, we have a Neutral rating on the stock and will/may update our
numbers post management interaction.
Y/E
Sales OPM PAT EPS
ROE
P/E
P/BV EV/EBITDA EV/Sales
Mar
(` cr)
(%)
(` cr)
(`)
(%)
(x)
(x)
(x)
(x)
FY2016E
2,408
8.5
124
8.6
9.1
27.0
2.4
12.2
1.0
FY2017E
2,753
9.8
174
12.0
12.2
19.3
2.3
8.9
0.9
Bharat Electronics Ltd. (CMP: `1,207 / TP: `1,414/ Upside: 17%)
Bharat Electronics Ltd. (BEL) reported mixed set of numbers. BEL reported top-line
of `1,500 cr, below our estimate of `1,713 cr. Surprise from the results has been
on the EBITDA margin front. Against our expectation of 16.3%, BEL reported
18.4% margins, mainly led by inventory gains. In-line with EBITDA margin
expansion, BEL reported PAT margin expansion to 19.7% and PAT was at `296cr,
ahead of our estimate of `288cr.
During the quarter BEL reported `8,000cr IACCS (Integrated Air Command
Control Systems) order win. Considering their order backlog of over `28,100cr
(OB/LTM sales ratio of 4.0x), margin expansion (as evident from last 2 quarter
results), recent correction in stock price, we maintain BUY rating on the stock with
price target of INR 1,414.
Y/E
Sales OPM
PAT EPS ROE P/E
P/BV EV/EBITDA EV/Sales
Mar
(` cr)
(%)
(` cr)
(`)
(%)
(x)
(x)
(x)
(x)
FY2016E
7,737
16.8
1,296
54
39.3
22.4
3.2
17.0
2.9
FY2017E
8,634
17.2
1,475
61
45.6
19.6
2.8
14.2
2.5
HDFC (CMP: `1,168/ TP: / Upside: )
HDFC Limited 3QFY2016 standalone net profit surged 6.7% YoY to `1,521cr. The
lower growth in the profit for 3QFY2016 is due to lower non-core income i.e.
profit on sale of investments was `57cr as against `113cr for 3QFY2015 coupled
with income from leased properties at `1cr as against `17cr for 3QFY2015. Also,
provisions jumped to `68cr against `45cr for 3QFY2015.
Growth in the non-individual loan portfolio saw a spurt recording a net increase of
`1,987cr for 3QFY2016. This resulted in higher provisioning since the company
had to make 1% standard asset provisioning on the increase in the non-individual
loan book for the quarter.
Total Advances grew at 13% YoY whereas the growth in the total loan book, after
adding back the loans sold in the preceding 12 months is 19%. Gross non-
performing loans came at 0.72% of the loan portfolio. Net Interest Margin for the
nine months ended December 31, 2015 was 3.85%. Overall, the company
Market Outlook
January 28, 2016
reported standalone earnings growth of 6.7% YoY. At the CMP, HDFC’s core
business (after adjusting `489/share towards the value of its subsidiaries) trades at
3.7x FY2017E ABV. We maintain our NEUTRAL view on the stock.
Y/E
Op. Inc
NIM
PAT
EPS ABV ROA ROE
P/E P/ABV
March
(` cr)
(%)
(` cr)
(`)
(`)
(%)
(%)
(x)
(x)
FY2016E
10,358
3.3
6,466
41.1
215.8
1.1
24.7
28.4
5.4
FY2017E
11,852
3.3
7,407
47.0
237.5
1.1
24.9
24.8
4.9
Quarterly Bloomberg Brokers Consensus Estimate
Bharti Airtel Ltd Consol- January 28, 2016
Particulars (` cr)
3QFY16E
3QFY15
y-o-y (%)
2QFY16
q-o-q (%)
Net sales
24,446
23,217
5.3
23,835
2.6
EBITDA
8,474
7,781
8.9
8,250
2.7
EBITDA margin (%)
34.7
33.5
34.6
Net profit
1,231
1,436
(14.3)
1,522
(19.1)
Dabur India Consol - January 28, 2016
Particulars (` cr)
3QFY16E
3QFY15
y-o-y (%)
2QFY16
q-o-q (%)
Net sales
2,223
2,073
7.2
2,092
6.3
EBITDA
394
352
11.9
404
(2.5)
EBITDA margin (%)
17.7
17.0
19.3
Net profit
322
283
13.8
342
(5.8)
Glenmark Pharmaceuticals Ltd - January 28, 2016
Particulars (` cr)
3QFY16E
3QFY15
y-o-y (%)
2QFY16
q-o-q (%)
Net sales
1,903
1,692
12.5
1,844
3.2
EBITDA
405
268
51.1
402
0.7
EBITDA margin (%)
21.3
15.8
21.8
Net profit
223
115
93.9
200
11.5
Maruti Suzuki India Ltd - January 28, 2016
Particulars (` cr)
3QFY16E
3QFY15
y-o-y (%)
2QFY16
q-o-q (%)
Net sales
14,849
12,263
21.1
13,575
9.4
EBITDA
2,378
1,592
49.4
2,269
4.8
EBITDA margin (%)
16.0
13.0
16.7
Net profit
1,333
802
66.2
1,225
8.8
ICICI Bank Ltd - January 28, 2016
Particulars (` cr)
3QFY16E
3QFY15
y-o-y (%)
2QFY16
q-o-q (%)
PAT
3,058
2,889
5.8
3,030
0.9
Market Outlook
January 28, 2016
Economic and Political News
200 SEZs likely to be exempt from 18.5% MAT
Modi government to award `14,225cr port projects by March
Oil sector contracts to have 10% domestic purchase clause
Corporate News
Mumbai Metro One to convert `2,100cr loan into dollar one
Govt to sell 10% stake in Engineers India
Coal India faces third labour strike
Market Outlook
January 28, 2016
Top Picks ★★★★★
Large Cap
Market Cap
CMP
Target
Upside
Company
Rationale
(` Cr)
(`)
(`)
(%)
To outpace battery industry growth due to better technological
Amara Raja Batteries
14,048
822
1,040
26.5
products leading to market share gains in both the automotive
OEM and replacement segments.
Earnings to grow strongly given the MHCV cyclical upturn.
Ashok Leyland
25,101
88
111
25.9
Focus on exports and LCV's provides additional growth
avenue.
The stock is trading at attractive valuations and is factoring all
HCL Tech
117,713
835
1,038
24.3
the bad news.
Strong visibility for a robust 20% earnings trajectory, coupled
HDFC Bank
261,561
1,036
1,262
21.8
with high quality of earnings on account of high quality retail
business and strategic focus on highly rated corporates.
Back on the growth trend, expect a long term growth of 14%
Infosys
261,473
1,138
1,347
18.3
to be a US$20bn in FY2020.
Well positioned to benefit from such expected gradual
recovery in the overall domestic capex cycle, given its presence
Larsen & Toubro
103,113
1,107
1,646
48.6
across various infrastructure segments, its execution
capabilities, and its strong balance sheet.
LICHF continues to grow its retail loan book at a healthy pace
with improvement in asset quality. We expect the company to
LIC Housing Finance
24,204
480
592
23.4
post a healthy loan book which is likely to reflect in a strong
earnings growth.
Source: Company, Angel Research
Mid Cap
Market Cap
CMP
Target
Upside
Company
Rationale
(` Cr)
(`)
(`)
(%)
Favourable outlook for the AC industry to augur well for
Cooling products business which is out pacing the market
Blue Star
3,216
358
439
22.8
growth. EMPPAC division's profitability to improve once
operating environment turns around.
Change in business focus towards high-margin chronic &
Garware Wall Ropes
747
342
473
38.5
lifestyle segments and increasing penetration in Europe and
US
Economic recovery to have favourable impact on advertising &
circulation revenue growth. Further, the acquisition of a radio
Jagran Prakashan
5,388
165
189
14.7
business (Radio City) would also boost the company's revenue
growth.
Massive capacity expansion along with rail advantage at ICD
Navkar Corporation
2,783
195
265
35.8
as well CFS augurs well for the company
Earnings boost on back of stable material prices and
Radico Khaitan
1,509
113
156
37.5
favourable pricing environment. Valuation discount to peers
provides additional comfort
Strong brands and distribution network would boost growth
Siyaram Silk Mills
1,035
1,104
1,354
22.6
going ahead. Stock currently trades at an inexpensive
valuation.
Structural shift in the Lighting industry towards LED lighting will
Surya Roshni
643
147
201
37.0
drive growth.
Source: Company, Angel Research
Market Outlook
January 28, 2016
Key Upcoming Events
Result Calendar
Date
Company
Maruti, ICICI Bank, Syndicate Bank, Dabur India, Sesa Goa, Jyothy Laboratories, Tide Water Oil India, Glenmark
Jan 28, 2016
Pharma.
United Phosphorus, TVS Motor, Siemens, Suzlon Energy, Thermax, Blue Star, Yes Bank, Jagran Prakashan, PVR, JSW
Jan 29, 2016
Steel , Banco, Elecon Engineering, Indoco Remedies, NTPC
Jan 30, 2016
IDFC, Shriram Trans., Marico, Electrosteel Castings, Relaxo
Feb 1, 2016
Tech Mahindra, Transport Corporation of India
Feb 2, 2016
Amara Raja Batteries, Cummins India, Crompton Greaves
Feb 3, 2016
Mangalam Cement, Hexaware, IOC
Feb 4, 2016
Bajaj Auto, ABB, J K Lakshmi Cements, Mphasis, Tata Steel, Styrolution, Visaka Industries, Aventis
Feb 5, 2016
Bosch India, Lupin, Cadila Healthcare, Tata Power Co., PTC India
Feb 8, 2016
GlaxoSmith Con, Sterling Tools
Feb 9, 2016
Motherson Sumi, Apollo Tyres, Ramco Cements, Britannia, Dr Reddy's, CESC
Feb 10, 2016
Ambuja Cements, ACC, India Cements, Rural Elec.Corp., GSK Pharma, NHPC
Feb 11, 2016
Page Industries
Feb 12, 2016
M&M, FAG Bearings, Nestle
Source: Bloomberg, Angel Research
Global economic events release calendar
Date
Time
Country
Event Description
Unit
Period
Bloomberg Data
Last Reported Estimated
Jan 28, 2016
3:00PM UK
GDP (YoY)
% Change
4Q A
2.10
1.90
12:30AM US
FOMC rate decision
%
Jan 27
0.50
0.50
Jan 29, 2016
7:00PM US
GDP Qoq (Annualised)
% Change
4Q A
2.00
0.80
Feb 1, 2016
3:00PM UK
PMI Manufacturing
Value
Jan
51.90
--
6:30AM China
PMI Manufacturing
Value
Jan
49.70
49.60
Feb 2, 2016
2:25PM Germany
Unemployment change (000's)
Thousands
Jan
(14.00)
--
11:00AM India
RBI Reverse Repo rate
%
Feb 2
5.75
5.75
11:00AM India
RBI Repo rate
%
Feb 2
6.75
6.75
11:00AM India
RBI Cash Reserve ratio
%
Feb 2
4.00
4.00
Feb 4, 2016
5:30PM UK
BOE Announces rates
% Ratio
Feb 4
0.50
0.50
Feb 5, 2016
7:00PM US
Change in Nonfarm payrolls
Thousands
Jan
292.00
200.00
7:00PM US
Unnemployment rate
%
Jan
5.00
5.00
Feb 10, 2016
India
Imports YoY%
% Change
Jan
(3.90)
--
India
Exports YoY%
% Change
Jan
(14.70)
--
3:00PM UK
Industrial Production (YoY)
% Change
Dec
0.90
--
Feb 12, 2016 7:30AM India
Industrial Production YoY
% Change
Dec
(3.20)
--
3:30PM Euro Zone
Euro-Zone GDP s.a. (QoQ)
% Change
4Q A
0.30
--
12:30PM Germany
GDP nsa (YoY)
% Change
4Q P
1.80
--
Feb 15, 2016 12:00PM India
Monthly Wholesale Prices YoY%
% Change
Jan
(0.73)
--
China
Exports YoY%
% Change
Jan
(1.40)
--
Source: Bloomberg, Angel Research
Market Outlook
January 28, 2016
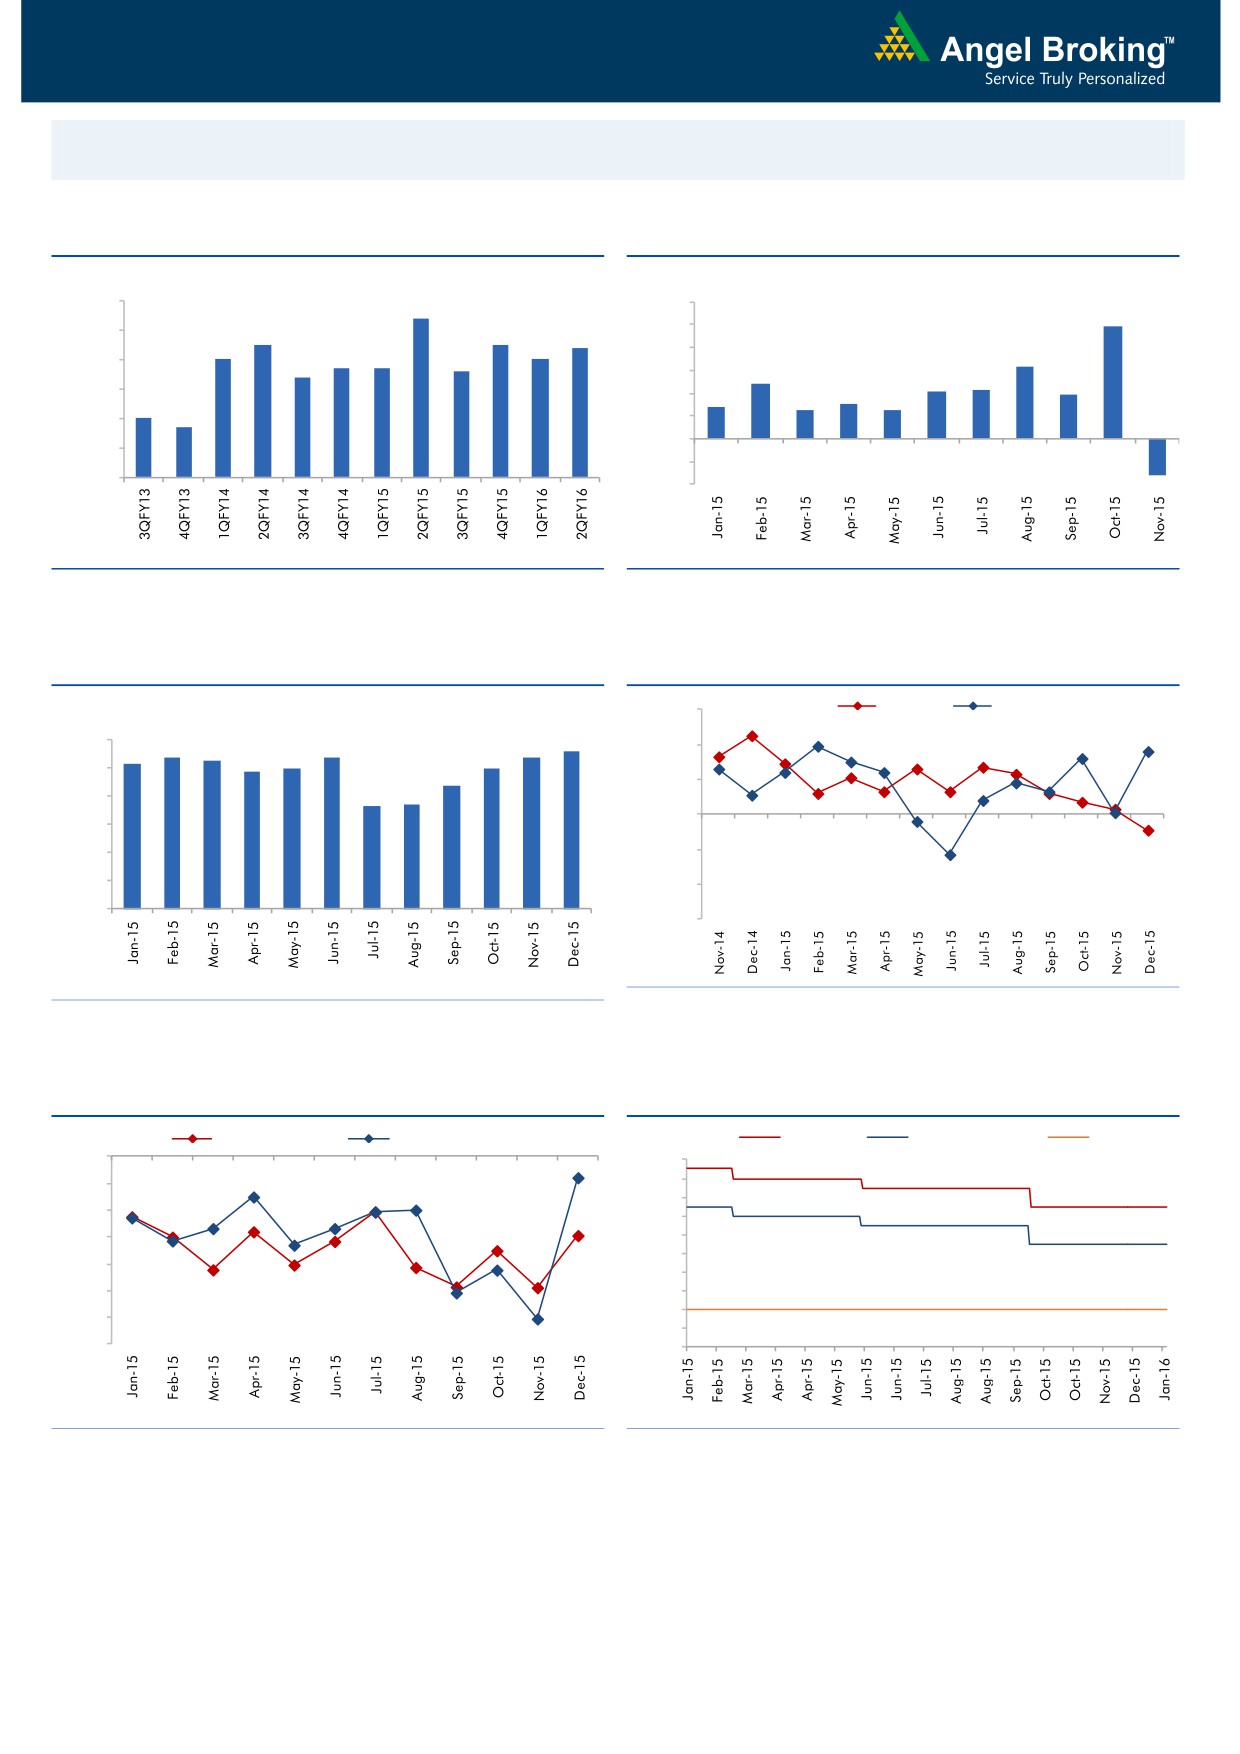
Macro watch
Exhibit 1: Quarterly GDP trends
Exhibit 2: IIP trends
(%)
(%)
9.0
8.4
12.0
9.9
7.5
7.5
10.0
8.0
7.4
7.0
7.0
6.7
6.7
8.0
6.3
6.6
7.0
6.4
6.0
4.8
4.2
4.3
3.8
6.0
2.8
3.0
4.0
2.5
2.5
5.0
4.7
5.0
2.0
-
4.0
(2.0)
3.0
(4.0)
(3.2)
Source: CSO, Angel Research
Source: MOSPI, Angel Research
Exhibit 3: Monthly CPI inflation trends
Exhibit 4: Manufacturing and services PMI
(%)
56.0
Mfg. PMI
Services PMI
5.6
6.0
5.4
5.3
5.4
5.4
54.0
5.2
5.0
5.0
4.9
5.0
4.4
52.0
3.7
3.7
4.0
50.0
3.0
2.0
48.0
1.0
46.0
-
44.0
Source: Market, Angel Research; Note: Level above 50 indicates expansion
Source: MOSPI, Angel Research
Exhibit 5: Exports and imports growth trends
Exhibit 6: Key policy rates
(%)
Exports yoy growth
Imports yoy growth
(%)
Repo rate
Reverse Repo rate
CRR
0.0
8.00
(5.0)
7.50
7.00
(10.0)
6.50
(15.0)
6.00
5.50
(20.0)
5.00
(25.0)
4.50
4.00
(30.0)
3.50
(35.0)
3.00
Source: Bloomberg, Angel Research
Source: RBI, Angel Research
Market Outlook
January 28, 2016
Global watch
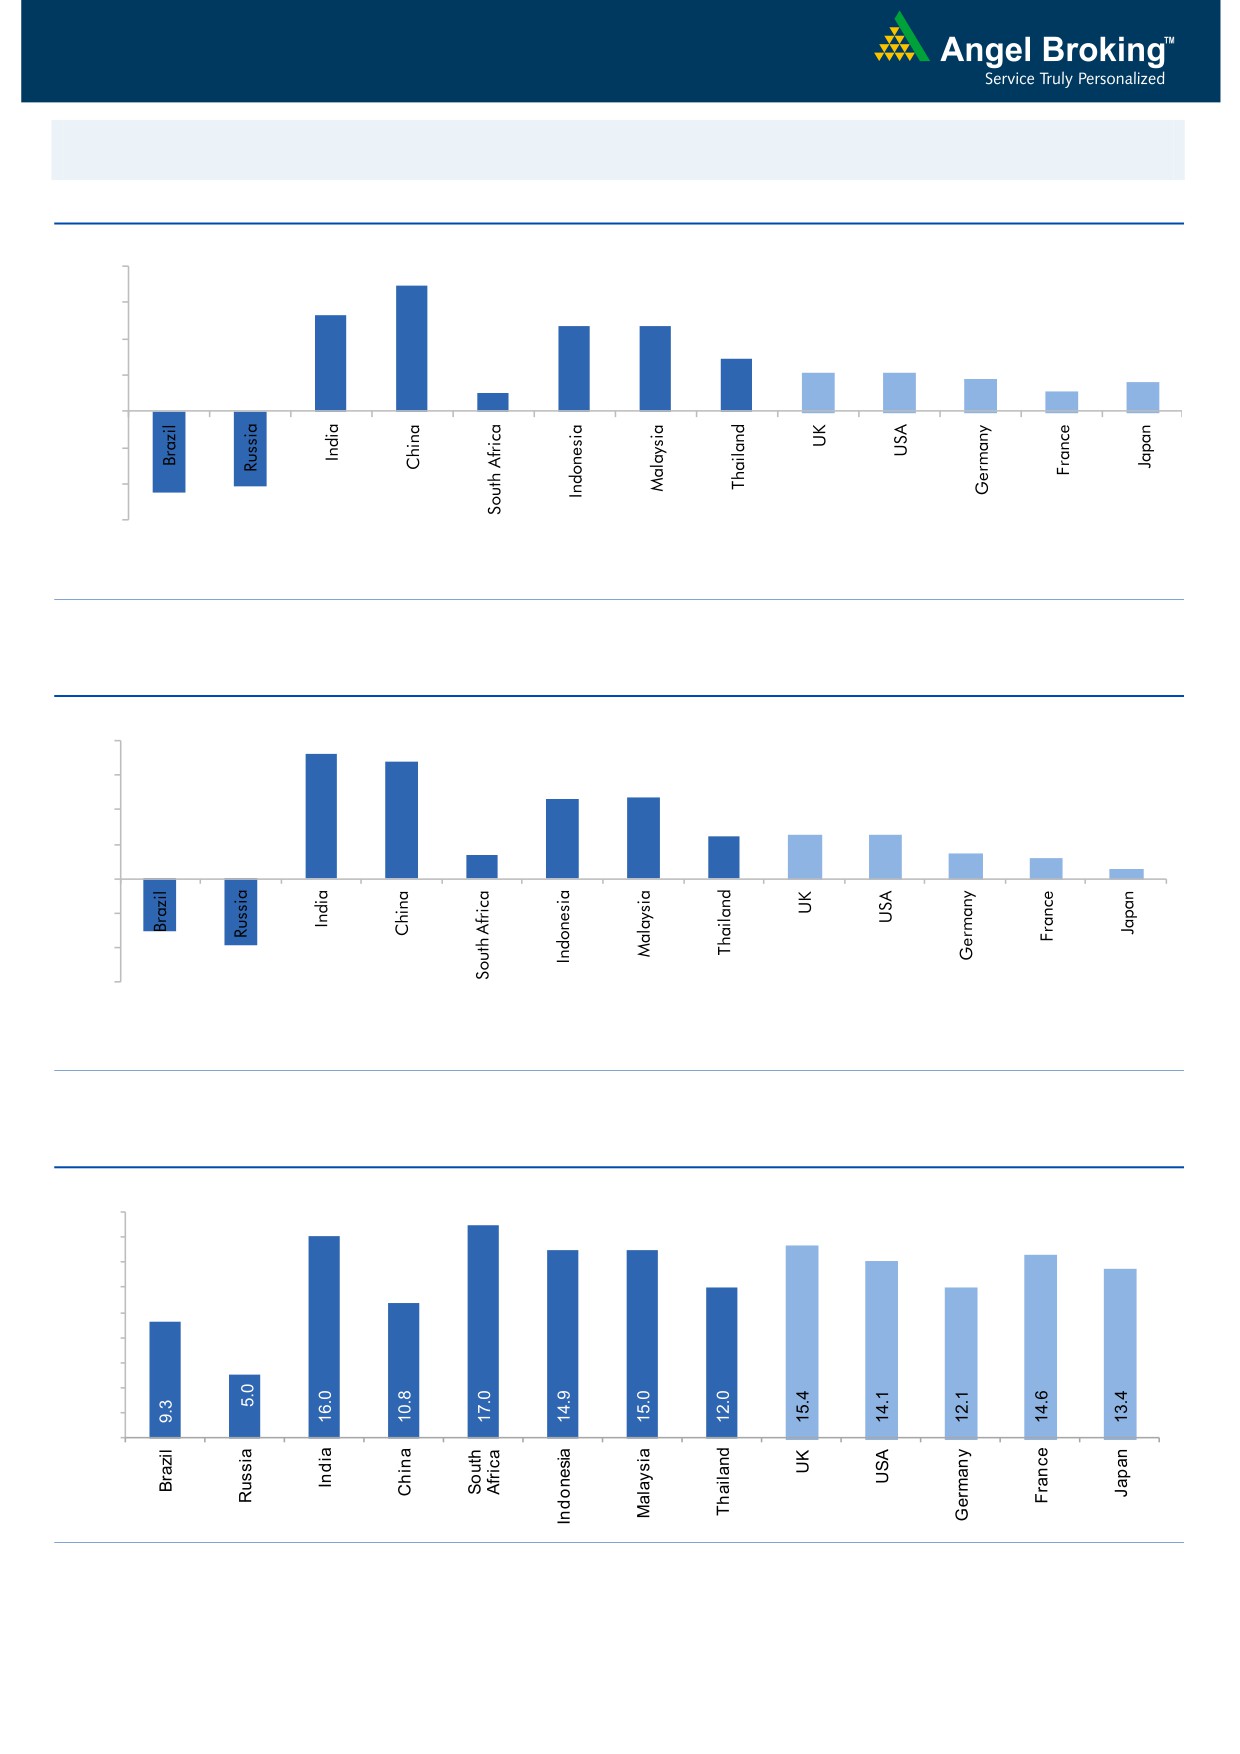
Exhibit 1: Latest quarterly GDP Growth (%, yoy) across select developing and developed countries
(%)
8.0
6.9
5.3
6.0
4.7
4.7
4.0
2.9
2.1
2.1
1.8
2.0
1.0
1.1
1.6
-
(2.0)
(4.0)
(4.1)
(4.5)
(6.0)
Source: Bloomberg, Angel Research
Exhibit 2: 2015 GDP Growth projection by IMF (%, yoy) across select developing and developed countries
(%)
7.3
8.0
6.8
6.0
4.7
4.7
4.0
2.5
2.5
2.6
1.4
1.5
2.0
1.2
0.6
-
(2.0)
(4.0)
(3.0)
(3.8)
(6.0)
Source: IMF, Angel Research
Exhibit 3: One year forward P-E ratio across select developing and developed countries
(x)
18.0
16.0
14.0
12.0
10.0
8.0
6.0
4.0
2.0
-
Source: IMF, Angel Research
Market Outlook
January 28, 2016
Exhibit 4: Relative performance of indices across globe
Returns (%)
Country
Name of index
Closing price
1M
3M
1YR
Brazil
Bovespa
38,376
(16.1)
(19.4)
(21.6)
Russia
Micex
1,748
(6.4)
(5.9)
3.4
India
Nifty
7,438
(5.8)
(11.3)
(13.9)
China
Shanghai Composite
2,736
(19.4)
(12.9)
(9.3)
South Africa
Top 40
42,939
(7.4)
(12.8)
(3.4)
Mexico
Mexbol
42,110
(6.1)
(7.9)
(2.2)
Indonesia
LQ45
794
1.7
(0.1)
(14.4)
Malaysia
KLCI
1,632
(0.7)
(4.3)
(6.9)
Thailand
SET 50
803
(7.3)
(16.0)
(23.8)
USA
Dow Jones
15,944
(11.2)
(8.4)
(10.2)
UK
FTSE
5,990
(4.0)
(6.6)
(12.0)
Japan
Nikkei
17,164
(9.1)
(7.5)
0.9
Germany
DAX
9,881
(10.1)
(7.1)
(10.0)
France
CAC
4,380
(11.8)
(11.7)
(10.8)
Source: Bloomberg, Angel Research
Stock Watch
January 28, 2016
Company Name
Reco
CMP
Target
Mkt Cap
Sales ( Čcr )
OPM(%)
EPS (Č)
PER(x)
P/BV(x)
RoE(%)
EV/Sales(x)
(Č)
Price ( Č)
( Č cr )
FY16E FY17E
FY16E
FY17E
FY16E
FY17E
FY16E
FY17E
FY16E
FY17E
FY16E
FY17E
FY16E
FY17E
Agri / Agri Chemical
Rallis
Neutral
165
-
3,207
2,097
2,415
14.4
14.4
9.5
11.0
17.4
15.0
3.5
3.0
21.1
21.3
1.5
1.3
United Phosphorus
Buy
412
510
17,676
13,698
15,752
17.6
17.6
32.1
38.5
12.9
10.7
2.5
2.1
21.4
21.3
1.4
1.1
Auto & Auto Ancillary
Ashok Leyland
Buy
88
111
25,101
17,995
21,544
11.4
11.6
3.4
4.7
25.9
18.8
4.6
4.2
17.7
22.2
1.3
1.1
Bajaj Auto
Buy
2,302
2,728
66,604
23,695
27,298
21.3
20.4
134.6
151.5
17.1
15.2
5.4
4.7
31.8
30.6
2.4
2.0
Bharat Forge
Buy
826
943
19,221
7,867
8,881
20.0
20.3
34.4
41.0
24.0
20.1
4.7
3.9
21.1
20.9
2.5
2.2
Eicher Motors
Buy
16,232
19,036
44,077
15,379
16,498
15.6
16.6
473.2
574.8
34.3
28.2
12.7
9.4
36.7
33.2
2.8
2.6
Gabriel India
Buy
87
101
1,243
1,415
1,544
8.7
9.0
4.6
5.4
18.8
16.0
3.4
3.0
18.1
18.9
0.8
0.7
Hero Motocorp
Accumulate
2,482
2,774
49,563
28,561
31,559
14.7
14.7
151.1
163.2
16.4
15.2
6.4
5.4
38.7
35.6
1.6
1.5
Jamna Auto Industries Neutral
145
-
1,159
1,292
1,486
9.3
9.8
6.0
7.5
24.2
19.4
5.0
4.2
20.7
21.8
1.0
0.8
L G Balakrishnan & Bros Neutral
473
-
743
1,254
1,394
11.6
11.8
35.9
41.7
13.2
11.4
1.8
1.6
13.5
13.8
0.7
0.6
Mahindra and Mahindra Buy
1,177
1,449
73,096
39,031
44,440
13.8
13.9
57.9
67.6
20.3
17.4
3.3
2.9
16.1
16.6
1.5
1.3
Maruti
Neutral
4,109
-
124,119
57,865
68,104
16.4
16.7
176.3
225.5
23.3
18.2
4.5
3.9
19.4
21.2
1.9
1.6
Minda Industries
Accumulate
806
867
1,279
2,567
2,965
8.0
8.3
46.1
57.8
17.5
14.0
2.9
2.4
16.7
17.3
0.6
0.5
Motherson Sumi
Buy
262
313
34,708
39,343
45,100
8.8
9.1
10.1
12.5
26.0
21.0
8.2
6.5
35.3
34.4
0.9
0.8
Rane Brake Lining
Buy
323
366
256
454
511
11.1
11.4
23.8
28.1
13.6
11.5
1.9
1.8
14.2
15.3
0.7
0.6
Setco Automotive
Neutral
34
-
454
594
741
12.7
13.7
1.7
3.2
20.0
10.6
2.1
1.8
10.4
16.9
1.2
1.0
Tata Motors
Buy
337
409
97,342
266,022
312,667
12.8
13.1
26.3
38.3
12.8
8.8
1.7
1.4
8.4
12.1
0.5
0.5
TVS Motor
Buy
290
338
13,770
11,569
13,648
7.3
8.7
10.3
16.1
28.1
18.0
7.0
5.5
24.8
30.5
1.2
1.0
Amara Raja Batteries
Buy
822
1,040
14,048
4,892
5,871
17.4
17.6
28.8
37.1
28.6
22.2
6.7
5.3
23.4
24.1
2.8
2.3
Exide Industries
Buy
122
162
10,353
6,950
7,784
14.4
14.8
6.6
7.3
18.5
16.7
2.3
2.1
12.6
12.8
1.2
1.1
Apollo Tyres
Buy
146
171
7,432
12,146
12,689
16.8
16.0
21.2
19.0
6.9
7.7
1.1
1.0
16.5
13.0
0.7
0.7
Ceat
Buy
918
1,119
3,715
6,041
6,597
14.1
13.7
99.5
111.9
9.2
8.2
1.8
1.5
19.6
18.5
0.8
0.7
JK Tyres
Neutral
90
-
2,040
7,446
7,669
15.2
14.0
19.6
18.4
4.6
4.9
1.2
1.0
25.2
19.5
0.7
0.6
Swaraj Engines
Neutral
856
-
1,063
552
630
14.2
14.7
44.6
54.1
19.2
15.8
4.5
4.1
23.2
25.6
1.9
1.6
Subros
Neutral
98
-
585
1,268
1,488
11.6
11.9
3.7
6.6
26.4
14.8
1.8
1.6
6.8
11.4
0.7
0.6
Indag Rubber
Neutral
179
-
471
283
329
17.0
17.2
13.0
15.4
13.8
11.6
3.0
2.5
21.8
21.6
1.4
1.2
Capital Goods
ACE
Neutral
39
-
389
660
839
4.7
8.2
1.0
3.9
39.4
10.1
1.2
1.1
3.2
11.3
0.7
0.6
BEML
Neutral
1,086
-
4,522
3,277
4,006
6.0
8.9
29.2
64.3
37.2
16.9
2.1
1.9
5.7
11.7
1.5
1.2
Bharat Electronics
Buy
1,206
1,414
28,944
7,737
8,634
16.8
17.2
54.0
61.0
22.3
19.8
3.2
2.8
39.3
45.6
2.8
2.4
Stock Watch
January 28, 2016
Company Name
Reco
CMP
Target
Mkt Cap
Sales ( Čcr )
OPM(%)
EPS (Č)
PER(x)
P/BV(x)
RoE(%)
EV/Sales(x)
(Č)
Price ( Č)
( Č cr )
FY16E
FY17E
FY16E
FY17E
FY16E
FY17E
FY16E
FY17E
FY16E
FY17E
FY16E
FY17E
FY16E
FY17E
Capital Goods
Voltas
Buy
283
353
9,356
5,363
5,963
8.0
9.1
11.0
13.8
25.7
20.5
3.9
3.5
16.2
17.9
1.7
1.5
BGR Energy
Neutral
113
-
816
3,615
3,181
9.5
9.4
16.7
12.4
6.8
9.1
0.6
0.6
10.0
7.0
0.6
0.8
BHEL
Neutral
140
-
34,169
33,722
35,272
10.8
11.7
10.5
14.2
13.3
9.8
1.0
0.9
7.0
9.0
1.1
1.1
Blue Star
Buy
358
439
3,216
3,548
3,977
6.3
6.9
13.7
17.2
26.1
20.8
6.6
4.3
26.1
25.4
1.0
0.8
Crompton Greaves
Buy
173
204
10,827
13,484
14,687
4.9
6.2
4.5
7.1
38.4
24.3
2.7
2.5
7.2
10.8
0.9
0.8
Greaves Cotton
#N/A
128
3,132
1,655
1,755
16.6
16.8
7.4
7.8
17.3
16.4
3.5
3.3
21.1
20.6
Inox Wind
Buy
317
458
7,033
4,980
5,943
17.0
17.5
26.6
31.6
11.9
10.0
3.6
2.6
35.0
30.0
1.5
1.2
KEC International
Neutral
121
-
3,116
8,791
9,716
6.1
6.8
5.4
8.2
22.4
14.8
2.2
2.1
10.0
14.0
0.6
0.5
Thermax
Neutral
848
-
10,103
6,413
7,525
7.4
8.5
30.5
39.3
27.8
21.6
4.3
3.7
15.0
17.0
1.5
1.3
Cement
ACC
Buy
1,231
1,630
23,110
13,151
14,757
16.4
18.3
63.9
83.4
19.3
14.8
2.5
2.3
13.3
16.1
1.6
1.4
Ambuja Cements
Buy
192
233
29,750
11,564
12,556
19.4
20.7
8.9
10.1
21.5
19.0
2.7
2.6
12.8
13.8
2.2
2.0
HeidelbergCement
Neutral
70
-
1,578
1,772
1,926
13.3
15.4
1.0
3.0
69.7
23.2
1.8
1.6
2.6
7.9
1.5
1.3
India Cements
Buy
89
112
2,723
4,216
4,840
18.0
19.5
4.0
9.9
22.2
9.0
0.9
0.8
4.0
9.5
1.0
0.8
JK Cement
Buy
506
744
3,536
3,661
4,742
10.1
15.8
18.0
61.0
28.1
8.3
2.0
1.8
7.5
22.9
1.4
1.1
J K Lakshmi Cement
Buy
300
430
3,528
2,947
3,616
16.7
19.9
11.5
27.2
26.1
11.0
2.5
2.1
9.8
20.8
1.6
1.3
Mangalam Cements
Neutral
178
-
474
1,053
1,347
10.5
13.3
8.4
26.0
21.1
6.8
0.9
0.8
4.3
12.5
0.8
0.6
Orient Cement
Buy
151
183
3,099
1,854
2,524
21.2
22.2
7.7
11.1
19.6
13.6
2.8
2.4
13.3
15.7
2.3
1.6
Ramco Cements
Neutral
385
-
9,161
4,036
4,545
20.8
21.3
15.1
18.8
25.5
20.5
3.1
2.8
12.9
14.3
2.7
2.3
Shree Cement^
Neutral
9,951
-
34,668
7,150
8,742
26.7
28.6
228.0
345.5
43.6
28.8
6.4
5.4
15.7
20.3
4.6
3.7
UltraTech Cement
Buy
2,747
3,282
75,390
25,021
30,023
19.1
21.6
89.0
132.0
30.9
20.8
3.6
3.1
12.2
15.9
3.0
2.6
Construction
ITNL
Neutral
80
-
2,635
7,360
8,825
34.0
35.9
7.0
9.0
11.4
8.9
0.4
0.4
3.2
3.7
3.7
3.6
KNR Constructions
Buy
499
673
1,403
937
1,470
14.3
14.0
33.5
38.6
14.9
12.9
2.3
2.0
15.4
15.4
1.5
1.0
Larsen & Toubro
Buy
1,107
1,646
103,113
65,065
77,009
11.5
11.7
61.5
65.6
18.0
16.9
1.8
1.7
13.4
14.0
1.8
1.6
Gujarat Pipavav Port
Neutral
146
-
7,073
629
684
51.0
52.2
6.4
5.9
22.9
24.8
3.0
2.8
15.9
12.7
11.1
10.0
MBL Infrastructures
Buy
170
285
704
2,313
2,797
12.2
14.6
19.0
20.0
8.9
8.5
0.9
0.9
11.3
10.6
1.0
0.9
Nagarjuna Const.
Neutral
64
-
3,536
7,892
8,842
8.8
9.1
3.0
5.3
21.2
12.0
1.1
1.0
5.0
8.5
0.7
0.6
PNC Infratech
Accumulate
514
558
2,636
1,873
2,288
13.2
13.5
24.0
32.0
21.4
16.1
2.1
1.9
12.1
12.3
1.4
1.2
Simplex Infra
Neutral
278
-
1,373
5,955
6,829
10.3
10.5
16.0
31.0
17.4
9.0
0.9
0.8
5.3
9.9
0.7
0.6
Power Mech Projects
Neutral
608
-
895
1,539
1,801
12.8
12.7
59.0
72.1
10.3
8.4
1.6
1.3
18.6
16.8
0.6
0.5
Stock Watch
January 28, 2016
Company Name
Reco
CMP
Target
Mkt Cap
Sales ( Čcr )
OPM(%)
EPS (Č)
PER(x)
P/BV(x)
RoE(%)
EV/Sales(x)
(Č)
Price ( Č)
( Č cr )
FY16E
FY17E
FY16E
FY17E
FY16E
FY17E
FY16E
FY17E
FY16E
FY17E
FY16E
FY17E
FY16E
FY17E
Construction
Sadbhav Engineering
Neutral
306
-
5,242
3,481
4,219
10.7
10.8
8.0
12.0
38.2
25.5
3.6
3.1
10.3
13.5
1.8
1.5
NBCC
Buy
963
1,089
11,556
7,382
9,506
7.7
8.6
39.8
54.4
24.2
17.7
5.8
4.6
26.7
29.1
1.2
0.9
MEP Infra
Neutral
43
-
701
1,956
1,876
28.1
30.5
1.3
3.0
33.2
14.4
7.0
4.7
21.2
32.8
1.8
1.8
SIPL
Neutral
86
-
3,033
675
1,042
62.4
64.7
-
-
3.2
3.7
-
-
16.0
10.8
Financials
Allahabad Bank
Neutral
55
-
3,297
8,569
9,392
2.8
2.9
16.3
27.5
3.4
2.0
0.3
0.3
7.6
11.9
-
-
Axis Bank
Buy
415
531
98,782
26,473
31,527
3.5
3.6
35.7
43.5
11.6
9.6
2.0
1.7
17.9
18.9
-
-
Bank of Baroda
Neutral
130
-
29,989
18,485
21,025
1.9
2.0
13.5
21.1
9.7
6.2
0.8
0.7
7.3
10.6
-
-
Bank of India
Neutral
100
-
8,095
15,972
17,271
1.9
2.0
15.3
33.4
6.5
3.0
0.3
0.3
3.6
7.6
-
-
Canara Bank
Neutral
190
-
10,314
15,441
16,945
2.0
2.1
46.6
70.4
4.1
2.7
0.4
0.3
8.0
11.2
-
-
Dena Bank
Neutral
36
-
2,326
3,440
3,840
2.1
2.3
7.3
10.0
5.0
3.6
0.4
0.3
6.1
7.9
-
-
Federal Bank
Neutral
47
-
8,150
3,477
3,999
3.0
3.0
5.0
6.2
9.5
7.6
1.0
0.9
10.6
11.9
-
-
HDFC
Neutral
1,168
-
184,348
10,358
11,852
3.3
3.3
41.1
47.0
28.4
24.8
5.4
4.9
24.7
24.9
-
-
HDFC Bank
Buy
1,036
1,262
261,561
38,309
47,302
4.3
4.3
49.3
61.1
21.0
17.0
3.6
3.1
18.5
19.7
-
-
ICICI Bank
Buy
237
304
137,723
34,279
39,262
3.3
3.3
21.0
24.4
11.3
9.7
1.9
1.6
14.4
14.7
-
-
IDBI Bank
Neutral
59
-
11,248
9,625
10,455
1.8
1.8
8.5
14.2
6.9
4.2
0.4
0.4
5.9
9.3
-
-
Indian Bank
Neutral
93
-
4,484
6,160
6,858
2.5
2.5
24.5
29.8
3.8
3.1
0.3
0.3
7.7
8.6
-
-
LIC Housing Finance
Buy
480
592
24,204
3,101
3,745
2.5
2.5
33.0
40.2
14.6
11.9
2.7
2.3
19.7
20.5
-
-
Oriental Bank
Neutral
114
-
3,406
7,643
8,373
2.4
2.4
37.2
45.4
3.1
2.5
0.3
0.2
8.2
9.4
-
-
Punjab Natl.Bank
Neutral
94
-
18,448
23,638
26,557
2.8
2.8
17.9
27.2
5.3
3.5
0.5
0.4
8.5
12.0
-
-
South Ind.Bank
Neutral
19
-
2,505
1,965
2,185
2.5
2.5
2.5
3.3
7.4
5.6
0.7
0.7
9.5
11.7
-
-
St Bk of India
Buy
184
237
143,068
82,520
93,299
2.7
2.8
20.0
24.5
9.2
7.5
1.0
0.9
11.5
12.8
-
-
Union Bank
Neutral
130
-
8,954
12,646
14,129
2.3
2.4
31.0
39.1
4.2
3.3
0.5
0.4
9.8
11.4
-
-
Vijaya Bank
Neutral
31
-
2,698
3,536
3,827
1.9
1.9
5.5
6.7
5.7
4.7
0.5
0.4
7.8
8.8
-
-
Yes Bank
Buy
677
825
28,425
7,190
9,011
3.2
3.3
58.2
69.7
11.6
9.7
2.1
1.8
19.2
19.6
-
-
FMCG
Asian Paints
Neutral
859
-
82,366
16,553
19,160
16.0
16.2
17.7
21.5
48.6
39.9
12.9
11.6
29.4
31.2
4.9
4.2
Britannia
Neutral
2,649
-
31,785
8,065
9,395
9.6
10.2
47.2
65.5
56.1
40.5
18.7
17.6
38.3
41.2
3.7
3.2
Colgate
Neutral
855
-
23,253
4,836
5,490
19.5
19.7
48.5
53.2
17.6
16.1
12.9
11.3
99.8
97.5
4.9
4.3
Dabur India
Accumulate
237
267
41,692
9,370
10,265
17.1
17.2
7.3
8.1
32.3
29.3
9.8
7.9
33.7
30.6
4.4
4.1
GlaxoSmith Con*
Accumulate
5,653
6,118
23,773
4,919
5,742
17.2
17.4
168.3
191.2
33.6
29.6
9.5
8.1
28.8
28.9
4.4
3.7
Stock Watch
January 28, 2016
Company Name
Reco
CMP
Target
Mkt Cap
Sales ( Čcr )
OPM(%)
EPS (Č)
PER(x)
P/BV(x)
RoE(%)
EV/Sales(x)
(Č)
Price ( Č)
( Č cr )
FY16E FY17E
FY16E
FY17E
FY16E
FY17E
FY16E
FY17E
FY16E
FY17E
FY16E
FY17E
FY16E
FY17E
FMCG
Godrej Consumer
Neutral
1,148
-
39,080
10,168
12,886
16.1
16.1
32.1
38.4
35.8
29.9
7.3
6.7
19.7
21.0
3.9
3.0
HUL
Accumulate
768
815
166,131
34,940
38,957
17.5
17.7
20.8
24.7
36.9
31.1
41.1
32.8
110.5
114.2
4.6
4.1
ITC
Buy
313
382
251,147
41,068
45,068
37.8
37.4
13.9
15.9
22.5
19.7
7.5
6.6
34.1
33.8
5.7
5.1
Marico
Neutral
214
-
27,597
6,551
7,766
15.7
16.0
10.4
12.5
20.6
17.1
6.0
5.0
33.2
32.4
4.2
3.6
Nestle*
Buy
5,485
6,646
52,884
11,291
12,847
22.2
22.3
158.9
184.6
34.5
29.7
18.0
16.2
55.0
57.3
4.5
3.9
Tata Global
Buy
124
144
7,854
8,635
9,072
9.8
9.9
6.5
7.6
19.2
16.4
1.9
1.8
6.8
7.4
0.9
0.8
IT
HCL Tech^
Buy
835
1,038
117,713
42,038
47,503
21.2
21.5
51.5
57.7
16.2
14.5
3.5
2.7
21.5
18.8
2.4
2.0
Infosys
Buy
1,138
1,347
261,473
61,850
69,981
27.5
27.5
59.4
65.7
19.2
17.3
4.1
3.5
21.2
20.1
3.5
2.9
TCS
Buy
2,320
2,854
457,060
108,487
122,590
28.3
28.5
122.8
138.4
18.9
16.8
7.2
6.5
38.0
38.9
3.8
3.3
Tech Mahindra
Buy
503
646
48,680
25,566
28,890
16.0
17.0
26.3
31.9
19.1
15.8
3.4
2.9
17.9
18.6
1.7
1.5
Wipro
Buy
552
719
136,482
50,808
58,713
23.7
23.8
37.3
42.3
14.8
13.1
2.8
2.5
19.0
17.9
2.2
1.8
Media
D B Corp
Accumulate
314
356
5,775
2,241
2,495
27.8
27.9
21.8
25.6
14.4
12.3
3.8
3.3
26.7
28.5
2.5
2.3
HT Media
Neutral
77
-
1,797
2,495
2,603
11.2
11.2
7.3
8.6
10.6
9.0
0.8
0.8
7.4
8.1
0.2
0.2
Jagran Prakashan
Buy
165
189
5,388
2,170
2,355
27.2
26.2
8.9
9.9
18.5
16.7
3.9
3.4
20.9
20.5
2.4
2.2
Sun TV Network
Neutral
354
-
13,947
2,779
3,196
70.2
70.5
22.8
27.3
15.5
13.0
3.8
3.5
26.7
28.3
4.7
4.1
Hindustan Media
Neutral
283
-
2,074
920
1,031
20.0
20.0
19.2
20.9
14.7
13.5
2.4
2.1
16.4
15.3
1.6
1.4
Ventures
Metals & Mining
Coal India
Buy
304
380
191,828
76,167
84,130
19.9
22.3
22.4
25.8
13.6
11.8
4.9
4.8
35.5
41.0
1.8
1.6
Hind. Zinc
Buy
159
175
67,035
14,641
14,026
50.4
50.4
17.7
16.0
9.0
9.9
1.4
1.3
16.2
13.2
1.8
1.6
Hindalco
Neutral
71
-
14,713
104,356
111,186
8.7
9.5
6.7
11.1
10.6
6.4
0.4
0.4
3.5
5.9
0.7
0.6
JSW Steel
Neutral
1,122
-
27,113
42,308
45,147
16.4
20.7
(10.3)
49.5
22.7
1.3
1.2
(1.0)
5.6
1.7
1.5
NMDC
Neutral
80
-
31,856
8,237
10,893
46.6
44.5
10.0
11.7
8.1
6.9
0.9
0.8
12.5
13.0
3.7
2.8
SAIL
Neutral
44
-
18,028
45,915
53,954
7.2
10.5
1.5
4.4
29.0
10.0
0.4
0.4
2.3
4.1
1.0
0.9
Vedanta
Neutral
64
-
18,915
71,445
81,910
26.2
26.3
12.9
19.2
5.0
3.3
0.3
0.3
7.2
8.9
0.7
0.5
Tata Steel
Neutral
258
-
25,014
126,760
137,307
8.9
11.3
6.4
23.1
40.5
11.2
0.8
0.8
2.0
7.1
0.8
0.7
Oil & Gas
Cairn India
Neutral
119
-
22,264
11,323
12,490
49.4
51.0
20.7
20.7
5.7
5.8
0.4
0.4
6.4
6.1
0.9
0.3
GAIL
Neutral
358
-
45,443
64,856
70,933
9.1
9.6
24.0
28.9
15.0
12.4
1.3
1.2
8.8
9.6
0.9
0.8
ONGC
Neutral
218
-
186,852
154,564
167,321
36.8
37.4
28.6
32.5
7.6
6.7
1.0
0.9
12.7
13.5
1.4
1.3
Petronet LNG
Neutral
248
-
18,604
29,691
31,188
5.8
6.2
12.8
13.4
19.4
18.5
2.9
2.6
15.8
14.8
0.7
0.7
Indian Oil Corp
Accumulate
397
455
96,390
359,607
402,760
5.9
6.1
42.5
48.7
9.4
8.2
1.3
1.1
14.1
14.4
0.4
0.3
Stock Watch
January 28, 2016
Company Name
Reco
CMP
Target
Mkt Cap
Sales ( Čcr )
OPM(%)
EPS (Č)
PER(x)
P/BV(x)
RoE(%)
EV/Sales(x)
(Č)
Price ( Č)
( Č cr )
FY16E FY17E
FY16E
FY17E
FY16E
FY17E
FY16E
FY17E
FY16E
FY17E
FY16E
FY17E
FY16E
FY17E
Oil & Gas
Reliance Industries
Accumulate
999
1,150
323,730
304,775
344,392
12.6
13.4
91.3
102.6
11.0
9.7
1.2
1.1
11.8
12.0
1.0
0.8
Pharmaceuticals
Alembic Pharma
Neutral
602
-
11,349
2,658
3,112
24.1
20.2
24.6
23.9
24.5
25.2
8.8
6.7
42.5
30.2
4.5
3.8
Aurobindo Pharma
Accumulate
802
856
46,825
14,923
17,162
22.0
23.0
35.7
42.8
22.5
18.7
6.6
5.0
34.0
30.2
3.6
3.0
Aventis*
Neutral
4,194
-
9,659
2,082
2,371
17.4
20.8
118.2
151.5
35.5
27.7
5.2
4.2
19.9
25.5
4.3
3.6
Cadila Healthcare
Buy
305
352
31,193
10,224
11,840
21.0
22.0
14.6
17.6
20.9
17.3
5.7
4.5
30.8
29.0
3.1
2.6
Cipla
Accumulate
581
636
46,628
14,211
16,611
20.6
19.0
27.0
28.9
21.5
20.1
3.7
3.1
18.4
16.8
3.3
2.7
Dr Reddy's
Buy
2,968
3,933
50,610
16,838
19,575
25.0
23.1
167.5
178.8
17.7
16.6
3.7
3.1
23.1
20.4
2.8
2.4
Dishman Pharma
Neutral
329
-
2,654
1,733
1,906
21.5
21.5
17.0
19.9
19.4
16.5
2.0
1.8
10.5
11.2
2.0
1.7
GSK Pharma*
Neutral
3,217
-
27,251
2,870
3,158
20.0
22.1
59.5
68.3
54.1
47.1
16.0
16.4
28.5
34.3
8.7
8.0
Indoco Remedies
Neutral
319
-
2,939
1,033
1,199
15.9
18.2
9.4
13.6
33.9
23.5
5.0
4.3
15.7
19.7
2.8
2.4
Ipca labs
Buy
651
900
8,214
3,363
3,909
12.9
18.6
13.4
28.0
48.6
23.3
3.5
3.0
7.4
14.0
2.7
2.3
Lupin
Neutral
1,690
-
76,125
13,092
16,561
25.0
27.0
50.4
68.3
33.5
24.7
6.9
5.5
22.8
24.7
5.6
4.3
Sun Pharma
Buy
821
950
197,655
28,163
32,610
25.8
30.7
17.4
26.9
47.2
30.5
4.5
3.9
13.0
16.6
6.2
5.2
Power
Tata Power
Neutral
61
-
16,579
35,923
37,402
22.6
22.8
4.1
5.2
15.1
11.9
1.2
1.1
7.5
9.3
1.4
1.3
NTPC
Accumulate
143
157
118,240
87,064
98,846
23.5
23.5
11.7
13.2
12.3
10.9
1.4
1.3
11.4
12.1
2.3
2.1
Power Grid
Buy
138
170
72,405
20,702
23,361
86.7
86.4
12.1
13.2
11.5
10.5
1.7
1.5
15.6
15.1
8.3
7.7
Telecom
Bharti Airtel
Neutral
298
-
119,083
101,748
109,191
32.1
31.7
12.0
12.5
24.8
23.8
1.7
1.6
6.9
6.7
1.8
1.6
Idea Cellular
Neutral
109
-
39,316
34,282
36,941
32.0
31.5
5.9
6.2
18.5
17.6
1.7
1.5
9.9
9.3
1.7
1.6
zOthers
Abbott India
Neutral
4,983
-
10,589
2,715
3,153
14.5
14.1
134.3
152.2
37.1
32.7
9.3
7.6
27.4
25.6
3.7
3.1
Bajaj Electricals
Buy
184
290
1,862
4,719
5,287
5.2
5.8
8.6
12.7
21.6
14.6
2.5
2.2
11.4
14.8
0.4
0.3
Finolex Cables
Neutral
233
-
3,563
2,520
2,883
12.2
12.0
12.7
14.2
18.4
16.4
2.5
2.2
13.6
13.5
1.1
0.9
Goodyear India*
Buy
482
622
1,112
1,888
1,680
12.1
11.9
62.2
56.6
7.8
8.5
1.8
1.6
25.9
19.7
0.4
0.4
Hitachi
Neutral
1,157
-
3,145
1,779
2,081
7.8
8.8
21.8
33.4
53.1
34.6
8.6
6.9
17.4
22.1
1.8
1.5
Jyothy Laboratories
Neutral
289
-
5,237
1,620
1,847
11.5
11.5
7.3
8.5
39.7
34.1
5.1
4.8
13.3
14.4
2.9
2.5
MRF
Buy
35,792
45,575
15,180
20,316
14,488
21.4
21.1
5,488.0
3,798.0
6.5
9.4
2.2
1.8
41.1
21.2
0.7
0.9
Page Industries
Neutral
12,196
-
13,603
1,929
2,450
19.8
20.1
229.9
299.0
53.1
40.8
23.4
16.3
52.1
47.1
7.1
5.6
Relaxo Footwears
Neutral
460
-
5,516
1,767
2,152
12.3
12.5
19.3
25.1
23.9
18.3
5.9
4.5
27.7
27.8
3.1
2.6
Siyaram Silk Mills
Buy
1,104
1,354
1,035
1,636
1,815
11.5
11.5
89.9
104.1
12.3
10.6
2.0
1.8
17.9
17.8
0.8
0.7
Styrolution ABS India*
Neutral
684
-
1,203
1,271
1,440
8.6
9.2
32.0
41.1
21.4
16.7
2.2
2.0
10.7
12.4
0.9
0.8
Stock Watch
January 28, 2016
Company Name
Reco
CMP
Target
Mkt Cap
Sales ( Čcr )
OPM(%)
EPS (Č)
PER(x)
P/BV(x)
RoE(%)
EV/Sales(x)
(Č)
Price ( Č)
( Č cr )
FY16E
FY17E
FY16E
FY17E
FY16E
FY17E
FY16E
FY17E
FY16E
FY17E
FY16E
FY17E
FY16E
FY17E
zOthers
TVS Srichakra
Buy
2,543
3,240
1,947
2,101
2,338
15.7
15.0
248.6
270.0
10.2
9.4
4.5
3.2
43.6
34.0
1.0
0.8
HSIL
Accumulate
278
302
2,012
2,123
2,384
16.1
16.5
15.0
18.9
18.5
14.7
1.4
1.3
8.0
9.4
1.3
1.1
Kirloskar Engines India
Neutral
247
-
3,574
2,471
2,826
8.8
10.4
9.1
13.3
27.1
18.5
2.6
2.4
9.7
13.4
1.0
0.8
Ltd
M M Forgings
Buy
476
614
574
511
615
21.7
21.6
43.1
55.8
11.0
8.5
2.0
1.7
19.9
21.2
1.3
1.0
Banco Products (India) Neutral
126
-
902
1,208
1,353
11.0
12.3
10.8
14.5
11.7
8.7
1.3
1.2
11.9
14.5
0.7
0.6
Competent Automobiles Neutral
146
-
89
1,040
1,137
3.2
3.1
25.7
28.0
5.7
5.2
0.9
0.7
15.0
14.3
0.1
0.1
Nilkamal
Neutral
1,302
-
1,942
1,910
2,083
10.5
10.3
63.3
69.2
20.6
18.8
3.4
2.9
17.6
16.5
1.1
0.9
Visaka Industries
Buy
108
144
171
1,086
1,197
9.9
10.3
21.5
28.8
5.0
3.8
0.5
0.4
9.6
11.6
0.4
0.3
Transport Corporation of
Neutral
234
-
1,778
2,830
3,350
8.8
9.0
14.4
18.3
16.3
12.8
2.5
2.2
15.4
17.1
0.8
0.7
India
Elecon Engineering
Buy
65
85
705
1,369
1,533
13.7
14.9
3.3
6.1
19.5
10.7
1.3
1.2
6.6
11.4
0.9
0.8
Surya Roshni
Buy
147
201
643
2,992
3,223
8.1
8.4
14.7
18.3
10.0
8.0
0.9
0.8
9.7
11.0
0.5
0.5
MT Educare
Neutral
162
-
647
286
366
18.3
17.7
7.7
9.4
21.0
17.3
4.4
3.9
20.2
21.1
2.1
1.6
Radico Khaitan
Buy
113
156
1,509
1,565
1,687
12.2
13.0
5.7
7.1
19.9
16.0
1.7
1.5
8.3
9.6
1.4
1.3
Garware Wall Ropes
Buy
342
473
747
862
974
11.2
11.2
24.9
29.6
13.7
11.6
2.1
1.8
15.1
15.4
0.9
0.8
Wonderla Holidays
Neutral
404
-
2,283
206
308
44.0
43.6
9.0
12.9
44.9
31.3
6.1
5.6
13.7
17.8
10.6
7.1
Linc Pen & Plastics
Neutral
211
-
311
340
371
8.3
8.9
10.8
13.2
19.5
16.0
3.1
2.7
16.0
17.1
1.0
0.9
The Byke Hospitality
Neutral
157
-
629
222
287
20.5
20.5
5.6
7.6
27.8
20.8
5.2
4.3
18.9
20.8
2.9
2.2
Interglobe Aviation
Neutral
936
-
33,735
17,022
21,122
20.7
14.5
63.9
53.7
14.7
17.4
22.0
18.0
149.9
103.2
2.1
1.7
Coffee Day Enterprises
Neutral
248
-
5,100
2,692
2,964
17.0
18.6
-
4.7
-
52.2
3.0
2.9
0.2
5.5
2.3
2.1
Ltd
Navneet Education
Neutral
88
-
2,103
998
1,062
24.1
24.0
5.8
6.1
15.4
14.5
3.4
3.0
22.0
20.6
2.1
2.0
Navkar Corporation
Buy
195
265
2,783
365
436
38.3
37.5
5.6
5.9
34.6
33.2
2.2
2.0
6.3
6.1
8.5
7.3
Source: Company, Angel Research; Note: *December year end; #September year end; &October year end; Price as on January 27, 2016
Market Outlook
January 28, 2016
Research Team Tel: 022 - 39357800
DISCLAIMER
Angel Broking Private Limited (hereinafter referred to as “Angel”) is a registered Member of National Stock Exchange of India Limited,
Bombay Stock Exchange Limited and Metropolitian Stock Exchange of India Limited. It is also registered as a Depository Participant with
CDSL and Portfolio Manager with SEBI. It also has registration with AMFI as a Mutual Fund Distributor. Angel Broking Private Limited is a
registered entity with SEBI for Research Analyst in terms of SEBI (Research Analyst) Regulations, 2014 vide registration number
INH000000164. Angel or its associates has not been debarred/ suspended by SEBI or any other regulatory authority for accessing
/dealing in securities Market. Angel or its associates including its relatives/analyst do not hold any financial interest/beneficial ownership
of more than 1% in the company covered by Analyst. Angel or its associates/analyst has not received any compensation / managed or co
-managed public offering of securities of the company covered by Analyst during the past twelve months. Angel/analyst has not served as
an officer, director or employee of company covered by Analyst and has not been engaged in market making activity of the company
covered by Analyst.
This document is solely for the personal information of the recipient, and must not be singularly used as the basis of any investment
decision. Nothing in this document should be construed as investment or financial advice. Each recipient of this document should make
such investigations as they deem necessary to arrive at an independent evaluation of an investment in the securities of the companies
referred to in this document (including the merits and risks involved), and should consult their own advisors to determine the merits and
risks of such an investment.
Reports based on technical and derivative analysis center on studying charts of a stock's price movement, outstanding positions and
trading volume, as opposed to focusing on a company's fundamentals and, as such, may not match with a report on a company's
fundamentals.
The information in this document has been printed on the basis of publicly available information, internal data and other reliable sources
believed to be true, but we do not represent that it is accurate or complete and it should not be relied on as such, as this document is for
general guidance only. Angel Broking Pvt. Limited or any of its affiliates/ group companies shall not be in any way responsible for any
loss or damage that may arise to any person from any inadvertent error in the information contained in this report. Angel Broking Pvt.
Limited has not independently verified all the information contained within this document. Accordingly, we cannot testify, nor make any
representation or warranty, express or implied, to the accuracy, contents or data contained within this document. While Angel Broking
Pvt. Limited endeavors to update on a reasonable basis the information discussed in this material, there may be regulatory, compliance,
or other reasons that prevent us from doing so.
This document is being supplied to you solely for your information, and its contents, information or data may not be reproduced,
redistributed or passed on, directly or indirectly.
Neither Angel Broking Pvt. Limited, nor its directors, employees or affiliates shall be liable for any loss or damage that may arise from or
in connection with the use of this information.
Note: Please refer to the important ‘Stock Holding Disclosure' report on the Angel website (Research Section). Also, please refer to the
latest update on respective stocks for the disclosure status in respect of those stocks. Angel Broking Pvt. Limited and its affiliates may have
investment positions in the stocks recommended in this report.