Market Outlook
November 27, 2015
Market Cues
Domestic Indices
Chg (%)
(Pts)
(Close)
Indian markets are expected to open flat tracking the SGX Nifty.
BSE Sensex
0.7
183
25,959
U.S. markets were shut on account of Thanksgiving holiday.
Nifty
0.7
52
7,884
The European markets rallied, closing at a three month high as reports suggested
Mid Cap
0.3
29
10,935
that the European Central bank is looking at expanding stimulus to boost the
Small Cap
0.5
51
11,509
economy.
Bankex
0.3
66
19,495
Indian markets closed in the green on the last day of the expiry. The rally was led by
index heavyweights Tata Motors (gained 5%) and ITC & Reliance Industries which
Global Indices
Chg (%)
(Pts)
(Close)
gained more than 2% each.
Dow Jones
0.0
1
17,813
News & Result Analysis
Nasdaq
0.3
13
5,116
Ban on Alcohol sale in Bihar effective April 2016, impact on Radico Khaitan to
FTSE
0.9
55
6,393
be negligible
Nikkei
0.5
97
19,944
Update on USFDA warning letter on Dr. Reddy’s Lab
Hang Seng
(0.0)
(9)
22,489
Detailed analysis on Pg2
Shanghai Com
(0.3)
(12)
3,636
Investor’s Ready Reckoner
Key Domestic & Global Indicators
Advances / Declines
BSE
NSE
Stock Watch: Latest investment recommendations on 150+ stocks
Advances
1,623
849
Refer P4 onwards
Declines
1,049
534
Unchanged
228
64
Top Picks
CMP
Target
Upside
Company
Sector
Rating
(`)
(`)
(%)
Volumes (` Cr)
Axis Bank
Financials
Buy
465
630
35.4
BSE
2,852
HCL Tech
IT
Buy
863
1,132
31.2
NSE
23,315
ICICI Bank
Financials
Buy
264
357
34.9
Ashok Leyland
Automobiles
Buy
94
111
18.0
Net Inflows (` Cr)
Net
Mtd
Ytd
Larsen & Toubro
Construction
Buy
1,334
1,646
23.4
More Top Picks on Pg4
FII
(28)
(4,474)
(19,294)
MFs
144
4,197
54,544
Key Upcoming Events
Previous
Consensus
Date
Region
Event Description
Reading
Expectations
Top Gainers
Price (`)
Chg (%)
Nov 27
UK
GDP (QoQ) (Q3)
0.5%
0.5%
Mannapuram
25
13.0
Dec 1
China
Manufacturing PMI (Nov)
49.8
-
Pmcfin
1
8.4
Dec 1
Germany
Manufacturing PMI (Nov)
52.6
-
Hcc
27
7.8
Dec 1
India
RBI Repo Rate
6.75%
-
Mrpl
64
7.2
Jetairways
505
6.8
Top Losers
Price (`)
Chg (%)
Drreddy
3,110
(8.2)
Unitdspr
3,211
(4.7)
Redington
116
(3.3)
Renuka
15
(2.7)
Ceat
1,034
(2.7)
As on November 26, 2015
Market Outlook
November 27, 2015
Ban on Alcohol sale in Bihar effective April 2016, impact on
Radico Khaitan to be negligible
Bihar Chief Minister, Nitish Kumar has announced a ban on sale of alcohol in the
state from April 1, 2016. This will have a negative impact on the Indian Liquor
Industry. At the moment we have a Buy recommendation on Radico Khaitan, which
has declined ~7% post the announcement. However, in our view the impact of this
is likely to be negligible as the Bihar only accounts for ~2% of the overall top-line
(Premium and regular brands). Additionally, contribution from the premium
segment (high margin business) is also estimated to be at minimal levels and as a
result we do not expect this to significantly impact the overall profitability of the
company. Moreover, the long term prospects of the company are intact. Hence we
maintain our Buy recommendation on the stock with target price of `156.
Update on USFDA warning letter on Dr. Reddy’s Lab (DRL)
Details, available from a warning letter issued to DRL on November 5 2015,
shows that Units VI (in Srikakulam, Andhra Pradesh) and V (Nalgonda, Telangana)
facilities, had significant deviations from current GMP for the manufacture of APIs.
At Unit-VII (Visakhapatnam, AP) they found significant violations of CGMP
regulations for finished pharmaceuticals.
The inspection team also “discovered” the presence of “an uncontrolled “Custom
QC laboratory” at the Srikakulam facility, the existence of which was previously
unknown to USFDA. An official at the facility acknowledged that the laboratory was
involved in CGMP analysis of APIs intended for export to the US through 2012, the
regulator said. Stating that it has got nine responses from the company, between
December 2014 and September 2015, the regulator said they lack sufficient
corrective actions. Among the failures listed were those to maintain complete data
derived from all laboratory tests, including to prevent unauthorised access or
changes to data and to provide adequate controls to prevent omission of data.
Thus, significant deviations from current GMP for manufacture of APIs at two
facilities and violations of CGMP regulations for finished pharmaceuticals at
another besides presence of a laboratory unknown to the regulator figure in the
charges the U.S. Food and Drug Administration has made against DRL. USFDA
needs DRL to focus on third party verification and implementation across the
manufacturing network. The company has not done any third party verification till
date.
The company said it believed the best course of action is to set a higher
benchmark across all sites and employ company level application of corrective
and preventive actions (CAPAs) raised at any one specific site. The company has
been given December 7, 2015 as the deadline for submitting the response to the
warning letter. These issues, given quality issues will take some time to get
resolved. However, we have already pruned the numbers for worst case scenario
coming from these three plants. We maintain our buy with a price target of
`3933.
Market Outlook
November 27, 2015
Economic and Political News
Housing for All scheme to come with cheap power and water
Railways eyes `1.1-lakh cr fund for infra upgrade
Sovereign Gold Bond scheme launch postponed to Nov 30
Corporate News
Sandoz gets FDA rap over documentation at plants
Bain Capital selling $116-mn Hero MotoCorp shares
Plan B after sale of spectrum: Videocon to focus on other businesses
Market Outlook
November 27, 2015
Top Picks ★★★★★
Large Cap
Market Cap
CMP
Target
Upside
Company
Rationale
(` Cr)
(`)
(`)
(%)
To outpace battery industry growth due to better technological
Amara Raja Batteries
14,804
867
1,040
20.0
products leading to market share gains in both the automotive
OEM and replacement segments.
Earnings to grow strongly given the MHCV cyclical upturn.
Ashok Leyland
26,765
94
111
18.0
Focus on exports and LCV's provides additional growth
avenue.
Healthy pace of branch expansion, backed by distribution
Axis Bank
110,618
465
630
35.4
network, will be the driving force for the bank’s retail business
and overall earnings.
The stock is trading at attractive valuations and is factoring all
HCL Tech
121,370
863
1,132
31.2
the bad news.
Strong visibility for a robust 20% earnings trajectory, coupled
HDFC Bank
268,074
1,065
1,262
18.6
with high quality of earnings on account of high quality retail
business and strategic focus on highly rated corporates.
Due to its robust franchise and capital adequacy position, the
bank is well positioned to grow by at least a few percentage
ICICI Bank
153,555
264
357
34.9
points higher than the average industry growth rate from a
structural point of view.
Back on the growth trend, expect a long term growth of 14%
Infosys
241,914
1,053
1,306
24.0
to be a US$20bn in FY2020.
Well positioned to benefit from such expected gradual
recovery in the overall domestic capex cycle, given its presence
Larsen & Toubro
124,150
1,334
1,646
23.4
across various infrastructure segments, its execution
capabilities, and its strong balance sheet.
LICHF continues to grow its retail loan book at a healthy pace
with improvement in asset quality. We expect the company to
LIC Housing Finance
23,979
475
571
20.2
post a healthy loan book which is likely to reflect in a strong
earnings growth.
Source: Company, Angel Research
Mid Cap
Market Cap
CMP
Target
Upside
Company
Rationale
(` Cr)
(`)
(`)
(%)
Government thrust on Renewable sector and strong order
Inox Wind
7,999
360
505
40.1
book would drive future growth.
Change in business focus towards high-margin chronic and
Ipca labs
9,593
760
900
18.4
lifestyle segments and increasing penetration in Europe and
US
Economic recovery to have favourable impact on advertising &
circulation revenue growth. Further, the acquisition of a radio
Jagran Prakashan
4,672
143
169
18.3
business (Radio City) would also boost the company's revenue
growth.
Strong brand & quality teaching with innovative technologies
MT Educare
573
144
169
17.4
& higher government educational spending to boost growth
Earnings boost on back of stable material prices and
Radico Khaitan
1,520
114
156
36.5
favourable pricing environment. Valuation discount to peers
provides additional comfort
Strong brands and distribution network would boost growth
Siyaram Silk Mills
872
930
1,145
23.1
going ahead. Stock currently trades at an inexpensive
valuation.
Structural shift in the Lighting industry towards LED lighting will
Surya Roshni
576
131
183
39.4
drive growth.
Source: Company, Angel Research
Market Outlook
November 27, 2015
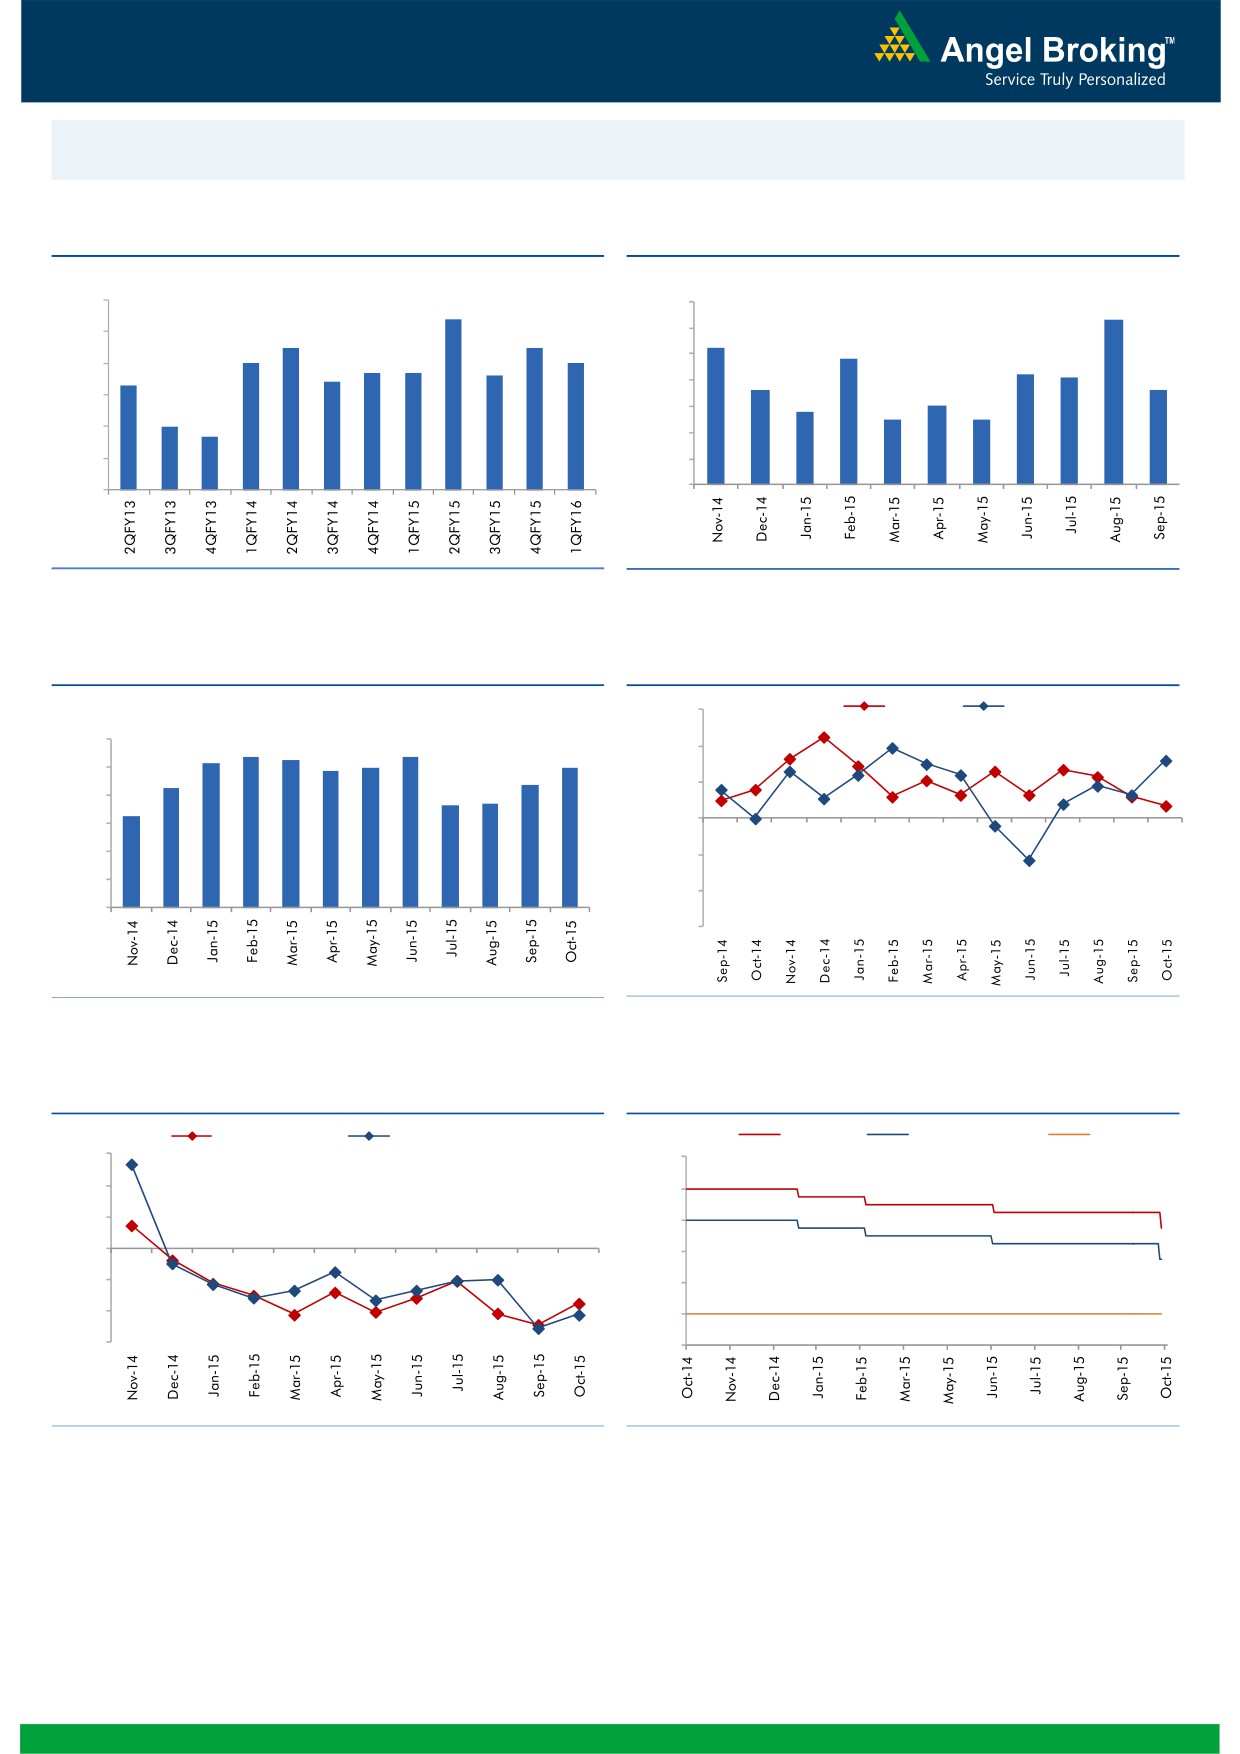
Macro watch
Exhibit 1: Quarterly GDP trends
Exhibit 2: IIP trends
(%)
(%)
9.0
8.4
7.0
6.3
8.0
7.5
7.5
6.0
5.2
7.0
7.0
4.8
6.7
6.7
5.0
7.0
6.4
6.6
4.2
4.1
6.3
3.6
3.6
4.0
6.0
2.8
3.0
2.5
2.5
5.0
3.0
4.7
5.0
2.0
4.0
1.0
3.0
-
Source: CSO, Angel Research
Source: MOSPI, Angel Research
Exhibit 3: Monthly CPI inflation trends
Exhibit 4: Manufacturing and services PMI
(%)
56.0
Mfg. PMI
Services PMI
6.0
5.4
5.3
5.4
5.2
5.0
5.0
54.0
4.9
5.0
4.3
4.4
3.7
3.7
52.0
4.0
3.3
50.0
3.0
2.0
48.0
1.0
46.0
-
44.0
Source: MOSPI, Angel Research
Source: Market, Angel Research; Note: Level above 50 indicates expansion
Exhibit 5: Exports and imports growth trends
Exhibit 6: Key policy rates
(%)
Exports yoy growth
Imports yoy growth
(%)
Repo rate
Reverse Repo rate
CRR
30.0
9.00
20.0
8.00
10.0
7.00
0.0
6.00
(10.0)
5.00
(20.0)
4.00
(30.0)
3.00
Source: Bloomberg, Angel Research
Source: RBI, Angel Research
Market Outlook
November 27, 2015
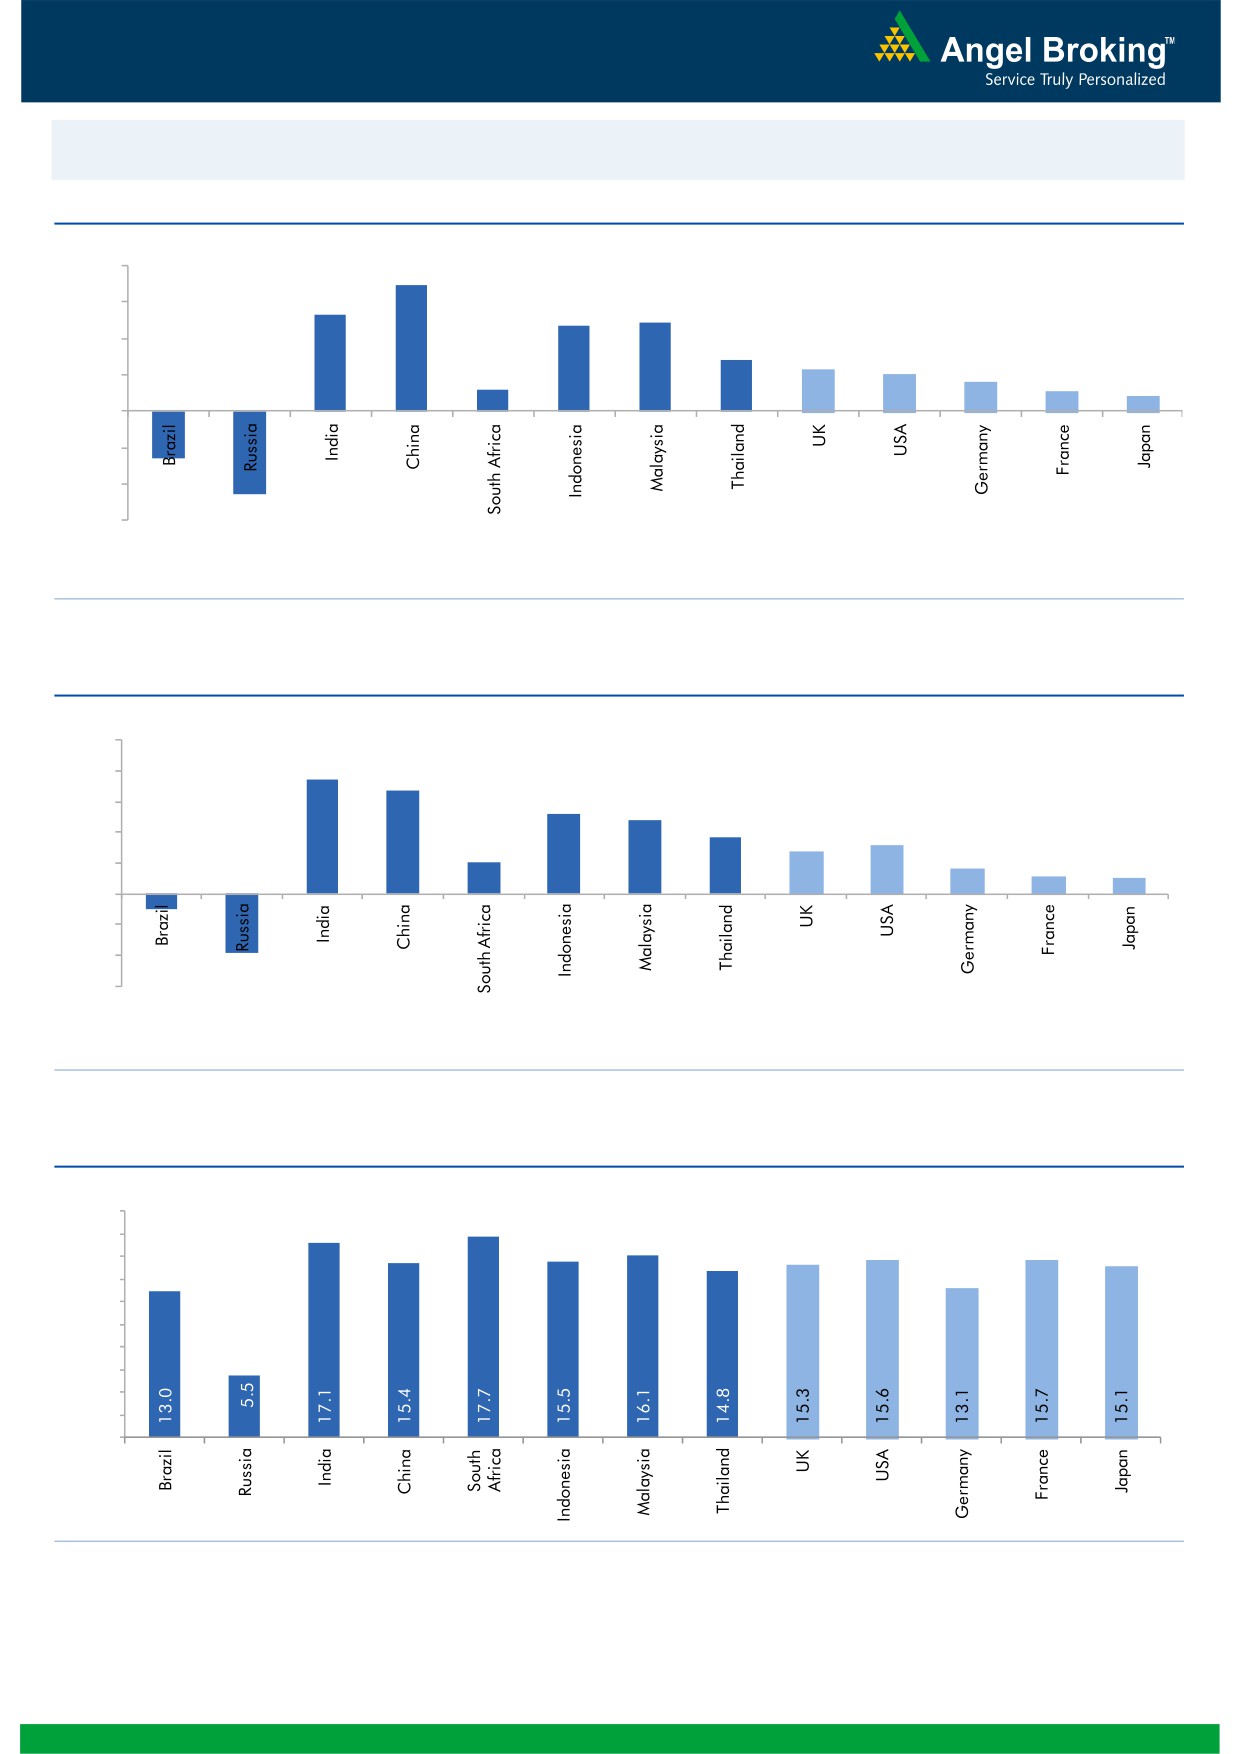
Global watch
Exhibit 1: Latest quarterly GDP Growth (%, yoy) across select developing and developed countries
(%)
8.0
6.9
5.3
6.0
4.9
4.7
4.0
2.8
2.3
2.0
1.6
2.0
1.2
1.1
0.8
(2.6)
-
(2.0)
(4.0)
(4.6)
(6.0)
Source: Bloomberg, Angel Research
Exhibit 2: 2015 GDP Growth projection by IMF (%, yoy) across select developing and developed countries
(%)
10.0
7.5
8.0
6.8
5.2
6.0
4.8
3.7
3.1
4.0
2.7
2.0
1.6
1.2
1.0
2.0
-
(2.0)
(4.0)
(1.0)
(3.8)
(6.0)
Source: IMF, Angel Research
Exhibit 3: One year forward P-E ratio across select developing and developed countries
(x)
20.0
18.0
16.0
14.0
12.0
10.0
8.0
6.0
4.0
2.0
-
Source: IMF, Angel Research
Market Outlook
November 27, 2015
Exhibit 4: Relative performance of indices across globe
Country
Name of index
Closing price
1M
1YR
Brazil
Bovespa
47,146
(0.1)
(14.4)
Russia
Micex
1,828
5.9
19.4
India
Nifty
7,884
(4.2)
(7.2)
China
Shanghai Composite
3,608
5.1
37.2
South Africa
Top 40
46,877
(3.5)
4.8
Mexico
Mexbol
44,375
(0.7)
(0.7)
Indonesia
LQ45
797
(1.7)
(10.1)
Malaysia
KLCI
1,681
(0.9)
(8.0)
Thailand
SET 50
875
(5.1)
(18.6)
USA
Dow Jones
17,813
1.1
(0.1)
UK
FTSE
6,393
(0.4)
(5.0)
Japan
Nikkei
19,843
5.7
15.0
Germany
DAX
11,321
4.8
14.2
France
CAC
4,946
2.0
12.9
Source: Bloomberg, Angel Research
Stock Watch
November 27, 2015
Company Name
Reco
CMP
Target
Mkt Cap
Sales ( Čcr )
OPM(%)
EPS (Č)
PER(x)
P/BV(x)
RoE(%)
EV/Sales(x)
(Č)
Price ( Č)
( Č cr )
FY16E FY17E
FY16E
FY17E
FY16E
FY17E
FY16E
FY17E
FY16E
FY17E
FY16E
FY17E
FY16E
FY17E
Agri / Agri Chemical
Rallis
Neutral
186
-
3,614
2,075
2,394
14.4
14.4
9.5
11.0
19.6
16.9
3.9
3.4
21.1
21.3
1.8
1.5
United Phosphorus
Buy
431
510
18,456
13,698
15,752
17.6
17.6
32.1
38.5
13.4
11.2
2.6
2.2
21.4
21.3
1.4
1.2
Auto & Auto Ancillary
Ashok Leyland
Buy
94
111
26,765
18,763
22,357
11.1
11.2
3.6
4.8
26.1
19.6
4.8
4.4
18.7
22.6
1.4
1.1
Bajaj Auto
Accumulate
2,462
2,672
71,254
24,115
27,600
21.3
21.0
136.8
157.2
18.0
15.7
5.8
4.9
32.2
31.5
2.5
2.2
Bharat Forge
Buy
859
1,016
20,008
8,013
9,250
20.0
20.3
35.2
43.1
24.4
19.9
4.8
4.0
21.6
21.8
2.6
2.2
Eicher Motors
Buy
16,514
19,036
44,824
15,379
16,498
15.6
16.6
473.2
574.8
34.9
28.7
12.9
9.6
36.7
33.2
2.8
2.6
Hero Motocorp
Neutral
2,681
-
53,532
28,561
31,559
14.7
14.7
151.1
163.2
17.7
16.4
6.9
5.9
38.7
35.6
1.7
1.5
Jamna Auto Industries Accumulate
231
258
4,605
1,292
1,486
9.3
9.8
12.0
15.0
19.2
15.4
4.0
3.4
20.7
21.8
3.6
3.2
L G Balakrishnan & Bros Neutral
492
-
772
1,254
1,394
11.6
11.8
35.9
41.7
13.7
11.8
1.9
1.6
13.5
13.8
0.7
0.6
Mahindra and Mahindra Neutral
1,345
-
83,543
38,513
43,579
13.6
13.7
56.1
65.1
24.0
20.7
3.8
3.3
15.7
16.2
1.8
1.5
Maruti
Accumulate
4,611
4,960
139,301
57,865
68,104
16.4
16.7
176.3
225.5
26.2
20.5
5.1
4.3
19.4
21.2
2.2
1.8
Minda Industries
Neutral
923
-
1,464
2,567
2,965
8.0
8.3
46.1
57.8
20.0
16.0
3.3
2.8
16.7
17.3
0.7
0.6
Motherson Sumi
Accumulate
296
313
39,126
39,343
45,100
8.8
9.1
10.1
12.5
29.3
23.7
9.3
7.3
35.3
34.4
1.1
0.9
Rane Brake Lining
Neutral
354
-
280
454
511
11.1
11.4
23.8
28.1
14.9
12.6
2.1
1.9
14.2
15.3
0.7
0.7
Setco Automotive
Neutral
225
-
600
594
741
12.7
13.7
8.4
15.8
26.7
14.2
2.8
2.4
10.4
16.9
1.5
1.2
Tata Motors
Neutral
423
-
122,172
255,254
301,772
12.9
13.4
23.7
37.3
17.9
11.3
2.2
1.8
7.4
12.1
0.7
0.6
TVS Motor
Neutral
298
-
14,167
11,845
14,040
7.2
9.0
10.4
17.4
28.7
17.1
7.2
5.5
25.1
32.0
1.2
1.0
Amara Raja Batteries
Buy
867
1,040
14,804
4,892
5,871
17.4
17.6
28.8
37.1
30.1
23.4
7.0
5.6
23.4
24.1
3.0
2.4
Exide Industries
Accumulate
149
162
12,652
6,950
7,784
14.4
14.8
6.6
7.3
22.6
20.4
2.9
2.6
12.6
12.8
1.5
1.4
Apollo Tyres
Accumulate
161
171
8,193
12,146
12,689
16.8
16.0
21.2
19.0
7.6
8.5
1.3
1.1
16.5
13.0
0.8
0.8
Ceat
Accumulate
1,034
1,119
4,182
6,041
6,597
14.1
13.7
99.5
111.9
10.4
9.2
2.0
1.7
19.6
18.5
0.8
0.7
JK Tyres
Neutral
96
-
2,185
7,446
7,669
15.2
14.0
19.6
18.4
4.9
5.2
1.2
1.0
25.2
19.5
0.7
0.6
Swaraj Engines
Neutral
915
-
1,136
552
630
14.2
14.7
44.6
54.1
20.5
16.9
4.8
4.3
23.2
25.6
1.9
1.6
Subros
Neutral
93
-
559
1,268
1,488
11.6
11.9
3.7
6.6
25.2
14.1
1.7
1.5
6.8
11.4
0.7
0.6
Indag Rubber
Neutral
197
-
516
283
329
17.0
17.2
13.0
15.4
15.2
12.7
3.3
2.8
21.8
21.6
1.5
1.3
Capital Goods
ACE
Neutral
44
-
431
660
839
4.7
8.2
1.0
3.9
43.6
11.2
1.4
1.2
3.2
11.3
0.8
0.6
BEML
Neutral
1,067
-
4,441
3,277
4,006
6.0
8.9
29.2
64.3
36.5
16.6
2.0
1.9
5.7
11.7
1.4
1.1
BGR Energy
Neutral
116
-
837
3,615
3,181
9.5
9.4
16.7
12.4
7.0
9.4
0.7
0.6
10.0
7.0
0.6
0.8
BHEL
Neutral
173
-
42,429
33,722
35,272
10.8
11.7
10.5
14.2
16.5
12.2
1.2
1.2
7.0
9.0
1.3
1.3
Stock Watch
November 27, 2015
Company Name
Reco
CMP
Target
Mkt Cap
Sales ( Čcr )
OPM(%)
EPS (Č)
PER(x)
P/BV(x)
RoE(%)
EV/Sales(x)
(Č)
Price ( Č)
( Č cr )
FY16E
FY17E
FY16E
FY17E
FY16E
FY17E
FY16E
FY17E
FY16E
FY17E
FY16E
FY17E
FY16E
FY17E
Capital Goods
Blue Star
Accumulate
357
382
3,211
3,624
4,157
5.3
6.0
9.6
14.5
37.1
24.7
6.8
5.8
18.6
25.4
1.0
0.9
Crompton Greaves
Accumulate
193
204
12,124
13,484
14,687
4.9
6.2
4.5
7.1
43.0
27.3
3.0
2.8
7.2
10.8
1.0
0.9
Inox Wind
Buy
360
505
7,999
4,980
5,943
17.0
17.5
26.6
31.6
13.6
11.4
4.1
3.0
35.0
30.0
1.8
1.4
KEC International
Neutral
157
-
4,038
8,791
9,716
6.1
6.8
5.4
8.2
29.1
19.2
2.9
2.7
10.0
14.0
0.7
0.6
Thermax
Neutral
855
-
10,190
6,413
7,525
7.4
8.5
30.5
39.3
28.0
21.8
4.3
3.8
15.0
17.0
1.6
1.3
Cement
ACC
Buy
1,352
1,630
25,391
13,151
14,757
16.4
18.3
63.9
83.4
21.2
16.2
2.7
2.5
13.3
16.1
1.8
1.5
Ambuja Cements
Accumulate
203
233
31,511
11,564
12,556
19.4
20.7
8.9
10.1
22.8
20.1
2.9
2.7
12.8
13.8
2.4
2.1
HeidelbergCement
Neutral
76
-
1,727
1,772
1,926
13.3
15.4
1.0
3.0
76.2
25.4
1.9
1.8
2.6
7.9
1.6
1.3
India Cements
Buy
88
112
2,709
4,216
4,840
18.0
19.5
4.0
9.9
22.1
8.9
0.9
0.8
4.0
9.5
1.0
0.8
JK Cement
Accumulate
654
744
4,569
3,661
4,742
10.1
15.8
18.0
61.0
36.3
10.7
2.6
2.3
7.5
22.9
1.7
1.3
J K Lakshmi Cement
Buy
354
430
4,160
2,947
3,616
16.7
19.9
11.5
27.2
30.7
13.0
2.9
2.5
9.8
20.8
1.8
1.5
Mangalam Cements
Neutral
196
-
523
1,053
1,347
10.5
13.3
8.4
26.0
23.3
7.5
1.0
0.9
4.3
12.5
0.9
0.6
Orient Cement
Accumulate
165
183
3,370
1,854
2,524
21.2
22.2
7.7
11.1
21.4
14.8
3.1
2.6
13.3
15.7
2.6
1.8
Ramco Cements
Neutral
377
-
8,984
4,036
4,545
20.8
21.3
15.1
18.8
25.0
20.1
3.1
2.7
12.9
14.3
2.7
2.4
Shree Cement^
Neutral
11,298
-
39,359
7,150
8,742
26.7
28.6
228.0
345.5
49.5
32.7
7.3
6.1
15.7
20.3
5.3
4.2
UltraTech Cement
Buy
2,812
3,282
77,173
25,021
30,023
19.1
21.6
89.0
132.0
31.6
21.3
3.7
3.2
12.2
15.9
3.1
2.6
Construction
ITNL
Neutral
91
-
2,992
7,360
8,825
34.0
35.9
7.0
9.0
13.0
10.1
0.4
0.4
3.2
3.7
3.8
3.6
KNR Constructions
Accumulate
620
673
1,742
937
1,470
14.3
14.0
33.5
38.6
18.5
16.1
2.8
2.4
15.4
15.4
1.9
1.3
Larsen & Toubro
Buy
1,334
1,646
124,150
65,065
77,009
11.5
11.7
61.5
65.6
21.7
20.3
2.2
2.0
13.4
14.0
2.1
1.8
Gujarat Pipavav Port
Neutral
167
-
8,049
629
684
51.0
52.2
6.4
5.9
26.0
28.2
3.4
3.2
15.9
12.7
12.5
11.2
MBL Infrastructures
Buy
218
285
904
2,313
2,797
12.2
14.6
19.0
20.0
11.5
10.9
1.2
1.1
11.3
10.6
1.1
1.0
Nagarjuna Const.
Neutral
78
-
4,353
7,892
8,842
8.8
9.1
3.0
5.3
26.1
14.8
1.3
1.2
5.0
8.5
0.8
0.7
PNC Infratech
Accumulate
529
558
2,713
1,873
2,288
13.2
13.5
24.0
32.0
22.0
16.5
2.2
1.9
12.1
12.3
1.6
1.3
Simplex Infra
Neutral
329
-
1,627
5,955
6,829
10.3
10.5
16.0
31.0
20.6
10.6
1.3
1.2
5.3
9.9
0.8
0.7
Power Mech Projects
Neutral
634
-
3,812
1,539
1,801
12.8
12.7
59.0
72.1
10.8
8.8
2.6
2.3
18.6
16.8
2.5
2.1
Sadbhav Engineering
Neutral
320
-
2,245
3,481
4,219
10.7
10.8
8.0
12.0
40.0
26.7
1.3
1.2
10.3
13.5
0.9
0.8
National Buildings
Construction
Accumulate
1,000
1,089
8,011
7,382
9,506
7.7
8.6
39.8
54.4
25.1
18.4
4.1
3.7
26.7
29.1
0.8
0.6
Corporation
Sadbhav Infrastructure
Neutral
320
-
2,245
3,481
4,219
10.7
10.8
8.0
12.0
40.0
26.7
1.3
1.2
10.3
13.5
0.9
0.8
Project
Financials
Allahabad Bank
Neutral
73
-
4,408
8,332
9,259
2.8
2.8
21.0
25.6
3.5
2.9
0.4
0.3
9.8
10.9
-
-
Stock Watch
November 27, 2015
Company Name
Reco
CMP
Target
Mkt Cap
Sales ( Čcr )
OPM(%)
EPS (Č)
PER(x)
P/BV(x)
RoE(%)
EV/Sales(x)
(Č)
Price ( Č)
( Č cr )
FY16E
FY17E
FY16E
FY17E
FY16E
FY17E
FY16E
FY17E
FY16E
FY17E
FY16E
FY17E
FY16E
FY17E
Financials
Axis Bank
Buy
465
630
110,618
26,473
31,527
3.5
3.6
35.7
43.5
13.0
10.7
2.5
2.2
17.9
18.9
-
-
Bank of Baroda
Neutral
170
-
39,194
19,105
21,474
2.0
2.0
19.1
24.8
8.9
6.9
0.9
0.8
10.2
12.1
-
-
Bank of India
Neutral
126
-
10,010
15,972
17,271
1.9
2.0
15.3
33.4
8.3
3.8
0.4
0.3
3.6
7.6
-
-
Canara Bank
Neutral
262
-
14,245
15,251
16,725
2.0
2.0
59.3
68.6
4.4
3.8
0.5
0.4
10.1
10.7
-
-
Dena Bank
Neutral
42
-
2,334
3,440
3,840
2.1
2.3
7.3
10.0
5.7
4.2
0.4
0.4
6.1
7.9
-
-
Federal Bank
Neutral
57
-
9,741
3,477
3,999
3.0
3.0
5.0
6.2
11.3
9.1
1.1
1.0
10.6
11.9
-
-
HDFC
Neutral
1,223
-
192,871
10,358
11,852
3.3
3.3
41.1
47.0
29.8
26.0
5.7
5.2
24.7
24.9
-
-
HDFC Bank
Buy
1,065
1,262
268,074
38,309
47,302
4.3
4.3
49.3
61.1
21.6
17.4
3.7
3.2
18.5
19.7
-
-
ICICI Bank
Buy
264
357
153,555
35,168
40,517
3.4
3.4
21.4
25.2
12.4
10.5
2.1
1.8
14.7
15.2
-
-
IDBI Bank
Neutral
83
-
13,321
9,625
10,455
1.8
1.8
8.5
14.2
9.7
5.8
0.6
0.6
5.9
9.3
-
-
Indian Bank
Neutral
127
-
6,076
6,160
6,858
2.5
2.5
24.5
29.8
5.2
4.2
0.4
0.4
7.7
8.6
-
-
LIC Housing Finance
Buy
475
571
23,979
3,101
3,745
2.5
2.5
33.0
40.2
14.4
11.8
2.7
2.3
19.7
20.5
-
-
Oriental Bank
Neutral
145
-
4,340
7,643
8,373
2.4
2.4
37.2
45.4
3.9
3.2
0.3
0.3
8.2
9.4
-
-
Punjab Natl.Bank
Neutral
140
-
27,431
23,638
26,557
2.8
2.8
17.9
27.2
7.8
5.1
0.8
0.6
8.5
12.0
-
-
South Ind.Bank
Neutral
20
-
2,700
1,965
2,185
2.5
2.5
2.5
3.3
8.0
6.1
0.8
0.7
9.5
11.7
-
-
St Bk of India
Buy
243
283
188,441
82,520
93,299
2.7
2.8
20.0
24.5
12.1
9.9
1.3
1.2
11.5
12.8
-
-
Union Bank
Neutral
160
-
11,016
12,646
14,129
2.3
2.4
31.0
39.1
5.2
4.1
0.6
0.5
9.8
11.4
-
-
Vijaya Bank
Neutral
34
-
2,951
3,536
3,827
1.9
1.9
5.5
6.7
6.2
5.2
0.5
0.5
7.8
8.8
-
-
Yes Bank
Buy
750
914
31,389
7,228
9,043
3.2
3.3
57.7
69.4
13.0
10.8
2.3
2.0
19.1
19.6
-
-
FMCG
Asian Paints
Neutral
862
-
82,654
16,553
19,160
16.0
16.2
17.7
21.5
48.8
40.1
12.9
11.6
29.4
31.2
4.8
4.2
Britannia
Neutral
2,909
-
34,906
8,065
9,395
9.6
10.2
47.2
65.5
61.6
44.4
20.5
19.4
38.3
41.2
4.2
3.6
Colgate
Neutral
965
-
26,259
4,836
5,490
19.5
19.7
48.5
53.2
19.9
18.1
14.6
12.7
99.8
97.5
5.3
4.7
Dabur India
Neutral
279
-
49,068
9,370
10,265
17.1
17.2
7.3
8.1
38.1
34.5
11.5
9.3
33.7
30.6
5.1
4.7
GlaxoSmith Con*
Neutral
5,878
-
24,719
4,919
5,742
17.2
17.4
168.3
191.2
34.9
30.7
9.9
8.4
28.8
28.9
4.6
3.9
Godrej Consumer
Neutral
1,262
-
42,972
10,168
12,886
16.1
16.1
32.1
38.4
39.3
32.9
8.0
7.4
19.7
21.0
4.3
3.4
HUL
Neutral
813
-
175,944
34,940
38,957
17.5
17.7
20.8
24.7
39.1
32.9
43.5
34.8
110.5
114.2
4.8
4.3
ITC
Buy
343
409
274,988
41,068
45,068
37.8
37.4
13.9
15.9
24.6
21.6
8.3
7.3
34.1
33.8
6.3
5.7
Marico
Neutral
429
-
27,697
6,551
7,766
15.7
16.0
10.4
12.5
41.4
34.4
12.0
10.0
33.2
32.4
4.2
3.5
Nestle*
Accumulate
6,022
6,646
58,060
11,291
12,847
22.2
22.3
158.9
184.6
37.9
32.6
19.8
17.8
55.0
57.3
5.0
4.3
Stock Watch
November 27, 2015
Company Name
Reco
CMP
Target
Mkt Cap
Sales ( Čcr )
OPM(%)
EPS (Č)
PER(x)
P/BV(x)
RoE(%)
EV/Sales(x)
(Č)
Price ( Č)
( Č cr )
FY16E FY17E
FY16E
FY17E
FY16E
FY17E
FY16E
FY17E
FY16E
FY17E
FY16E
FY17E
FY16E
FY17E
FMCG
Tata Global
Accumulate
135
144
8,517
8,635
9,072
9.8
9.9
6.5
7.6
20.8
17.8
2.1
2.0
6.8
7.4
0.9
0.9
IT
HCL Tech^
Buy
863
1,132
121,370
42,038
47,503
23.2
23.5
55.8
62.9
15.5
13.7
3.6
2.7
23.0
19.8
2.5
2.0
Infosys
Buy
1,053
1,306
241,914
60,250
66,999
28.0
28.0
58.3
63.7
18.1
16.5
3.8
3.3
20.9
19.7
3.3
2.8
TCS
Buy
2,345
3,165
462,095
111,274
126,852
28.4
28.7
125.4
143.9
18.7
16.3
7.4
6.8
39.9
42.2
3.8
3.2
Tech Mahindra
Buy
531
646
51,108
25,566
28,890
16.0
17.0
26.3
31.9
20.2
16.7
3.6
3.1
17.9
18.6
1.8
1.5
Wipro
Buy
570
719
140,747
52,414
58,704
23.7
23.8
38.4
42.3
14.8
13.5
2.9
2.6
19.5
18.0
2.3
1.9
Media
D B Corp
Accumulate
323
356
5,933
2,241
2,495
27.8
27.9
21.8
25.6
14.8
12.6
3.9
3.4
26.7
28.5
2.6
2.3
HT Media
Neutral
79
-
1,847
2,495
2,603
11.2
11.2
7.3
8.6
10.9
9.2
0.9
0.8
7.4
8.1
0.2
0.2
Jagran Prakashan
Buy
143
169
4,672
2,170
2,355
27.0
27.6
12.8
10.3
11.1
13.9
3.1
2.9
21.8
19.4
1.9
1.6
Sun TV Network
Neutral
390
-
15,365
2,779
3,196
70.2
70.5
22.8
27.3
17.1
14.3
4.2
3.8
26.7
28.3
5.3
4.6
Hindustan Media
Neutral
288
-
2,110
920
1,031
20.0
20.0
19.2
20.9
15.0
13.8
2.5
2.1
16.4
15.3
1.8
1.6
Ventures
Metals & Mining
Coal India
Accumulate
336
380
212,167
76,167
84,130
19.9
22.3
22.4
25.8
15.0
13.0
5.4
5.3
35.5
41.0
2.1
1.9
Hind. Zinc
Buy
142
175
59,894
14,641
14,026
50.4
50.4
17.7
16.0
8.0
8.9
1.2
1.1
16.2
13.2
1.7
1.5
Hindalco
Neutral
75
-
15,498
104,356
111,186
8.7
9.5
6.7
11.1
11.2
6.8
0.4
0.4
3.5
5.9
0.7
0.6
JSW Steel
Neutral
892
-
21,559
42,308
45,147
16.4
20.7
(10.3)
49.5
18.0
1.0
1.0
(1.0)
5.6
1.6
1.5
NMDC
Neutral
92
-
36,277
8,237
10,893
46.6
44.5
10.0
11.7
9.2
7.9
1.0
0.9
12.5
13.0
4.2
3.2
SAIL
Neutral
44
-
18,234
45,915
53,954
7.2
10.5
1.5
4.4
29.3
10.1
0.4
0.4
2.3
4.1
1.0
0.9
Vedanta
Neutral
90
-
26,771
71,445
81,910
26.2
26.3
12.9
19.2
7.0
4.7
0.5
0.4
7.2
8.9
0.8
0.6
Tata Steel
Neutral
228
-
22,134
126,760
137,307
8.9
11.3
6.4
23.1
35.8
9.9
0.7
0.7
2.0
7.1
0.8
0.7
Oil & Gas
Cairn India
Neutral
138
-
25,901
11,323
12,490
49.4
51.0
20.7
20.7
6.7
6.7
0.4
0.4
6.4
6.1
1.4
0.7
GAIL
Neutral
368
-
46,642
64,856
70,933
9.1
9.6
24.0
28.9
15.4
12.7
1.3
1.2
8.8
9.6
0.9
0.8
ONGC
Neutral
235
-
201,225
154,564
167,321
36.8
37.4
28.6
32.5
8.2
7.2
1.1
1.0
12.7
13.5
1.5
1.4
Petronet LNG
Neutral
232
-
17,389
29,691
31,188
5.8
6.2
12.8
13.4
18.1
17.3
2.7
2.4
15.8
14.8
0.7
0.6
Indian Oil Corp
Accumulate
421
455
102,241
359,607
402,760
5.9
6.1
42.5
48.7
9.9
8.6
1.3
1.2
14.1
14.4
0.4
0.3
Reliance Industries
Accumulate
988
1,050
319,860
304,775
344,392
12.6
13.4
91.3
102.6
10.8
9.6
1.2
1.1
11.8
12.0
1.0
0.8
Pharmaceuticals
Alembic Pharma
Neutral
668
-
12,589
2,658
3,112
24.1
20.2
24.6
23.9
27.2
27.9
9.7
7.5
42.5
30.2
4.7
4.0
Aurobindo Pharma
Accumulate
825
872
48,160
14,923
17,162
23.0
23.0
38.2
43.6
21.6
18.9
6.7
5.0
36.0
30.2
3.6
3.0
Aventis*
Neutral
4,412
-
10,160
2,082
2,371
17.4
20.8
118.2
151.5
37.3
29.1
5.5
4.4
19.9
25.5
4.6
3.8
Cadila Healthcare
Neutral
405
-
41,421
10,224
11,840
21.0
22.0
14.6
17.6
27.7
23.0
7.6
5.9
30.8
29.0
4.1
3.5
Stock Watch
November 27, 2015
Company Name
Reco
CMP
Target
Mkt Cap
Sales ( Čcr )
OPM(%)
EPS (Č)
PER(x)
P/BV(x)
RoE(%)
EV/Sales(x)
(Č)
Price ( Č)
( Č cr )
FY16E FY17E
FY16E
FY17E
FY16E
FY17E
FY16E
FY17E
FY16E
FY17E
FY16E
FY17E
FY16E
FY17E
Pharmaceuticals
Cipla
Neutral
634
-
50,945
14,211
16,611
20.6
19.0
27.0
28.9
23.5
22.0
4.0
3.4
18.4
16.8
3.6
3.0
Dr Reddy's
Buy
3,110
3,933
53,037
16,838
19,575
25.0
23.1
167.5
178.8
18.6
17.4
3.9
3.3
23.1
20.4
3.1
2.6
Dishman Pharma
Neutral
320
-
2,581
1,733
1,906
21.5
21.5
17.0
19.9
18.8
16.1
1.9
1.7
10.5
11.2
2.0
1.7
GSK Pharma*
Neutral
3,274
-
27,735
2,870
3,158
20.0
22.1
59.5
68.3
55.0
47.9
16.2
16.7
28.5
34.3
9.2
8.4
Indoco Remedies
Neutral
302
-
2,784
1,033
1,199
15.9
18.2
9.4
13.6
32.1
22.2
4.8
4.1
15.7
19.7
2.8
2.4
Ipca labs
Buy
760
900
9,593
3,363
3,909
12.9
18.6
13.4
28.0
56.7
27.2
7.4
5.9
7.4
14.0
3.1
2.7
Lupin
Neutral
1,837
-
82,718
13,092
16,561
25.0
27.0
50.4
68.3
36.5
26.9
7.5
6.0
22.8
24.7
6.0
4.7
Sun Pharma
Buy
736
950
177,102
28,163
32,610
25.8
30.7
17.4
26.9
42.3
27.4
4.0
3.5
13.0
16.6
5.8
4.8
Power
Tata Power
Neutral
66
-
17,945
35,923
37,402
22.6
22.8
4.1
5.2
16.4
12.9
1.3
1.2
7.5
9.3
1.4
1.3
NTPC
Buy
133
157
109,541
87,064
98,846
23.5
23.5
11.7
13.2
11.4
10.1
1.3
1.2
11.4
12.1
2.3
2.0
Power Grid
Buy
134
170
69,920
20,702
23,361
86.7
86.4
12.1
13.2
11.1
10.1
1.6
1.5
15.6
15.1
8.3
7.7
Telecom
Bharti Airtel
Neutral
342
-
136,711
101,748
109,191
32.1
31.7
12.0
12.5
28.5
27.4
2.0
1.8
6.9
6.7
2.0
1.8
Idea Cellular
Neutral
147
-
52,932
34,282
36,941
32.0
31.5
5.9
6.2
24.9
23.7
2.3
2.1
9.9
9.3
2.1
2.0
zOthers
Abbott India
Neutral
5,307
-
11,276
2,715
3,153
14.5
14.1
134.3
152.2
39.5
34.9
9.9
8.1
27.4
25.6
3.9
3.3
Bajaj Electricals
Buy
224
341
2,264
4,719
5,287
5.2
5.8
8.6
12.7
26.2
17.7
3.0
2.6
11.4
14.8
0.5
0.4
Finolex Cables
Neutral
262
-
4,001
2,520
2,883
12.2
12.0
12.7
14.2
20.6
18.4
2.8
2.5
13.6
13.5
1.3
1.1
Goodyear India*
Accumulate
553
622
1,276
1,888
1,680
12.1
11.9
62.2
56.6
8.9
9.8
2.1
1.8
25.9
19.7
0.5
0.5
Hitachi
Neutral
1,338
-
3,638
1,779
2,081
7.8
8.8
21.8
33.4
61.4
40.0
9.9
8.0
17.4
22.1
2.1
1.8
Jyothy Laboratories
Neutral
299
-
5,421
1,620
1,847
11.5
11.5
7.3
8.5
41.1
35.3
5.3
4.9
13.3
14.4
3.2
2.7
MRF
Buy
38,777
45,575
16,446
20,316
14,488
21.4
21.1
5,488.0
3,798.0
7.1
10.2
2.4
2.0
41.1
21.2
0.8
1.0
Page Industries
Neutral
12,941
-
14,435
1,929
2,450
19.8
20.1
229.9
299.0
56.3
43.3
24.8
17.3
52.1
47.1
7.5
5.9
Relaxo Footwears
Neutral
505
-
6,059
1,767
2,152
12.3
12.5
19.3
25.1
26.2
20.2
6.4
5.0
27.7
27.8
3.5
2.8
Siyaram Silk Mills
Buy
930
1,145
872
1,636
1,815
11.5
11.5
89.9
104.1
10.4
8.9
1.7
1.5
17.9
17.8
0.7
0.6
Styrolution ABS India*
Neutral
728
-
1,281
1,271
1,440
8.6
9.2
32.0
41.1
22.7
17.7
2.3
2.1
10.7
12.4
1.0
0.8
Tree House
Buy
211
314
894
256
315
57.2
57.5
16.5
21.0
12.8
10.1
1.2
1.1
9.6
10.9
3.6
3.1
TVS Srichakra
Accumulate
2,890
3,240
2,213
2,101
2,338
15.7
15.0
248.6
270.0
11.6
10.7
5.1
3.6
43.6
34.0
1.1
0.9
HSIL
Neutral
296
-
2,140
2,123
2,384
16.1
16.5
15.0
18.9
19.7
15.7
1.5
1.4
8.0
9.4
1.4
1.2
Kirloskar Engines India
Neutral
266
-
3,852
2,471
2,826
8.8
10.4
9.1
13.3
29.2
20.0
2.8
2.6
9.7
13.4
1.2
1.0
Ltd
M M Forgings
Buy
511
614
616
511
615
21.7
21.6
43.1
55.8
11.8
9.2
2.2
1.8
19.9
21.2
1.4
1.1
Stock Watch
November 27, 2015
Company Name
Reco
CMP
Target Mkt Cap
Sales ( Čcr )
OPM(%)
EPS (Č)
PER(x)
P/BV(x)
RoE(%)
EV/Sales(x)
(Č)
Price ( Č)
( Č cr )
FY16E FY17E FY16E FY17E FY16E FY17E FY16E FY17E FY16E FY17E FY16E FY17E FY16E FY17E
zOthers
Banco Products (India) Neutral
137
-
978
1,208
1,353
11.0
12.3
10.8
14.5
12.7
9.4
1.5
1.3
11.9
14.5
0.8
0.7
Competent Automobiles Neutral
147
-
90
1,040
1,137
3.2
3.1
25.7
28.0
5.7
5.2
0.9
0.8
15.0
14.3
0.1
0.1
Nilkamal
Accumulate
980
1,038
1,462
1,910
2,083
10.5
10.3
63.3
69.2
15.5
14.2
2.5
2.2
17.6
16.5
0.8
0.7
Visaka Industries
Buy
122
144
193
1,086
1,197
9.9
10.3
21.5
28.8
5.7
4.2
0.5
0.5
9.6
11.6
0.4
0.3
Transport Corporation of
Neutral
318
-
2,418
2,830
3,350
8.8
9.0
14.4
18.3
22.1
17.4
3.4
3.0
15.4
17.1
1.0
0.8
India
Elecon Engineering
Neutral
87
-
950
1,369
1,533
13.7
14.9
3.3
6.1
26.3
14.4
1.7
1.6
6.6
11.4
1.0
0.9
Surya Roshni
Buy
131
183
576
2,992
3,223
8.1
8.4
14.7
18.3
8.9
7.2
0.8
0.8
9.7
11.0
0.5
0.4
MT Educare
Buy
144
169
573
286
366
18.3
17.7
7.7
9.4
18.6
15.4
3.9
3.4
20.2
21.1
1.9
1.4
Radico Khaitan
Buy
114
156
1,520
1,565
1,687
12.2
13.0
5.7
7.1
20.0
16.1
1.7
1.6
8.3
9.6
1.4
1.3
Garware Wall Ropes
Accumulate
381
423
834
861
967
10.9
10.9
24.0
28.2
15.9
13.5
2.3
2.0
14.6
14.9
1.0
0.8
Wonderla Holidays
Neutral
371
-
2,099
206
308
44.0
43.6
9.0
12.9
41.3
28.8
5.6
5.1
13.7
17.8
10.1
6.7
Linc Pen & Plastics
Accumulate
172
185
255
340
371
8.3
8.9
10.8
13.2
16.0
13.1
2.6
2.2
16.0
17.1
0.8
0.7
The Byke Hospitality
Accumulate
166
181
666
222
287
20.5
20.5
5.6
7.6
29.5
22.0
5.6
4.6
18.9
20.8
3.0
2.3
Interglobe Aviation
Neutral
1,089
-
39,237
17,022
21,122
20.7
14.5
63.9
53.7
17.0
20.3
25.5
20.9
149.9
103.2
2.3
1.9
Coffee Day Enterprises
Neutral
266
-
5,481
2,692
2,964
17.0
18.6
-
4.7
-
56.1
3.3
3.1
0.2
5.5
2.4
2.3
Ltd
Navneet Education
Accumulate
85
97
427
998
1,062
24.1
24.0
5.8
6.1
14.8
14.0
3.3
2.9
22.0
20.6
0.5
0.5
Source: Company, Angel Research; Note: *December year end; #September year end; &October year end; Price as on November 26, 2015
Market Outlook
November 27, 2015
Research Team Tel: 022 - 39357800
DISCLAIMER
Angel Broking Private Limited (hereinafter referred to as “Angel”) is a registered Member of National Stock Exchange of India Limited,
Bombay Stock Exchange Limited and Metropolitian Stock Exchange of India Limited. It is also registered as a Depository Participant with
CDSL and Portfolio Manager with SEBI. It also has registration with AMFI as a Mutual Fund Distributor. Angel Broking Private Limited is a
registered entity with SEBI for Research Analyst in terms of SEBI (Research Analyst) Regulations, 2014 vide registration number
INH000000164. Angel or its associates has not been debarred/ suspended by SEBI or any other regulatory authority for accessing
/dealing in securities Market. Angel or its associates including its relatives/analyst do not hold any financial interest/beneficial ownership
of more than 1% in the company covered by Analyst. Angel or its associates/analyst has not received any compensation / managed or co
-managed public offering of securities of the company covered by Analyst during the past twelve months. Angel/analyst has not served as
an officer, director or employee of company covered by Analyst and has not been engaged in market making activity of the company
covered by Analyst.
This document is solely for the personal information of the recipient, and must not be singularly used as the basis of any investment
decision. Nothing in this document should be construed as investment or financial advice. Each recipient of this document should make
such investigations as they deem necessary to arrive at an independent evaluation of an investment in the securities of the companies
referred to in this document (including the merits and risks involved), and should consult their own advisors to determine the merits and
risks of such an investment.
Reports based on technical and derivative analysis center on studying charts of a stock's price movement, outstanding positions and
trading volume, as opposed to focusing on a company's fundamentals and, as such, may not match with a report on a company's
fundamentals.
The information in this document has been printed on the basis of publicly available information, internal data and other reliable sources
believed to be true, but we do not represent that it is accurate or complete and it should not be relied on as such, as this document is for
general guidance only. Angel Broking Pvt. Limited or any of its affiliates/ group companies shall not be in any way responsible for any
loss or damage that may arise to any person from any inadvertent error in the information contained in this report. Angel Broking Pvt.
Limited has not independently verified all the information contained within this document. Accordingly, we cannot testify, nor make any
representation or warranty, express or implied, to the accuracy, contents or data contained within this document. While Angel Broking
Pvt. Limited endeavors to update on a reasonable basis the information discussed in this material, there may be regulatory, compliance,
or other reasons that prevent us from doing so.
This document is being supplied to you solely for your information, and its contents, information or data may not be reproduced,
redistributed or passed on, directly or indirectly.
Neither Angel Broking Pvt. Limited, nor its directors, employees or affiliates shall be liable for any loss or damage that may arise from or
in connection with the use of this information.
Note: Please refer to the important ‘Stock Holding Disclosure' report on the Angel website (Research Section). Also, please refer to the
latest update on respective stocks for the disclosure status in respect of those stocks. Angel Broking Pvt. Limited and its affiliates may have
investment positions in the stocks recommended in this report.