Market Outlook
July 27, 2015
Dealer’s Diary
Domestic Indices
Chg (%)
(Pts)
(Close)
Indian markets are expected to open in red tracking SGX Nifty.
BSE Sensex
(0.9)
(259)
28,112
US markets corrected, on account of sell-off seen across materials and energy
Nifty
(0.8)
(68)
8,522
companies, which were impacted by continued fall in the oil and metal prices. On
MID CAP
(0.6)
(68)
11,148
Friday, Amazon surprised the street by reporting profit, and Biogen stock plunged
SMALL CAP
(0.6)
(68)
11,668
22%, after posting poor earnings and lowering of guidance numbers for 2015.
BSE HC
(0.3)
(57)
16,837
BSE PSU
(0.9)
(66)
7,740
U.K. stocks were slammed on Friday, with mining shares hit hard, and Diageo Plc
BANKEX
(1.2)
(259)
21,374
shares correcting on the news of U.S. regulatory investigation in to the liquor maker.
AUTO
(1.1)
(217)
18,953
Days top gainer on FTSE 100 was Vodafone Plc, after it said its seeing continued
METAL
(1.3)
(113)
8,772
recovery in its key European markets, even as quarterly revenue fell.
OIL & GAS
(0.9)
(88)
10,155
Markets continued their downward trend, with a loss of over half a percent on
BSE IT
(0.6)
(65)
11,005
Friday. Correction across Auto, Banking and Cap-good stocks pulled down the
Global Indices
Chg (%)
(Pts)
(Close)
broader indices.
Dow Jones
(0.9)
(163)
17,569
News & Result Analysis
NASDAQ
(1.1)
(58)
5,089
FTSE
(1.1)
(75)
6,580
Power Finance Corp. (PFC) OFS- SUBSCRIBE
Lupin Acquires Specialty Product Portfolio in Germany
Nikkei
(0.7)
(139)
20,545
Result Review: Hitachi Home, Relaxo Footwear, Visaka Industries
Hang Sang
(1.1)
(270)
25,129
Result Preview: Subros Ltd, Tech Mahindra
Straits Times
(0.1)
(4)
3,353
Refer detailed news & result analysis on the following page
Shanghai Com
(1.3)
(53)
4,071
Markets Today
The trend deciding level for the day is 28,200 / 8,541 levels. If NIFTY trades above
Indian ADR
Chg (%)
(Pts)
(Close)
this level during the first half-an-hour of trade then we may witness a further rally up
INFY
(0.5)
(0.1)
$17.2
to 28,315 - 28,518 / 8,569 - 8,617 levels. However, if NIFTY trades below
WIT
(2.6)
(0.3)
$12.3
28,200 / 8,541 levels for the first half-an-hour of trade then it may correct towards
IBN
(3.5)
(0.3)
$9.7
27,997 - 27,881 / 8,494 - 8,466 levels.
HDB
(0.9)
(0.5)
$61.5
Indices
S2
S1
PIVOT
R1
R2
Advances / Declines
BSE
NSE
SENSEX
27,881
27,997
28,200
28,315
28,518
Advances
1,254
573
NIFTY
8,466
8,494
8,541
8,569
8,617
Declines
1,622
947
Net Inflows (July 24, 2015)
Unchanged
97
60
` cr
Purch
Sales
Net
MTD
YTD
Volumes (` cr)
FII
3,860
3,554
306
7,757
143,137
MFs
805
984
(179)
1,634
55,244
BSE
3,422
NSE
17,808
FII Derivatives (July 25, 2015)
` cr
Purch
Sales
Net
Open Interest
Index Futures
1,663
1,698
(36)
21,041
Stock Futures
5,413
5,735
(322)
51,246
Gainers / Losers
Gainer
Loser
Company
Price (`)
chg (%)
Company
Price (`)
chg (%)
TATAELXSI
1,594
12.9
KAILASH
7
(10.0)
UNITDSPR
3,788
5.5
JPASSOCIAT
11
(9.3)
IBREALEST
58
5.2
RALLIS
235
(7.1)
RTNPOWER
8
4.5
INFRATEL
419
(7.0)
GRUH
244
4.0
PVR
803
(6.3)
Market Outlook
July 27, 2015
Power Finance Corp. (PFC) OFS- SUBSCRIBE
Power sector reforms to benefit PFC: Government is geared up to resolve
issues relating to power sector, which will directly benefit PFC, not just in the form
of better credit off-take, but also improved asset quality and profitability. Apart
from its focus on increasing generation and transmission capacities, the
government is also concentrating on addressing the bottleneck faced by power
producers due to shortage of coal. It is in the process of allocating coal mines
directly to state and central PSU and through e-auction to private players, which
would address coal supply issue. For PFC, it removes uncertainty, as 16 projects
with exposure of `36,237cr were linked to de-allocation of coal. Rationalization of
tariff by states and intent of government to reduce AT&C losses from 25% to 15%
by FY22 is positive development to improve health of SEB. We expect PFC to be
direct beneficiary of improving performance of power sector.
High visibility on Credit growth: Outstanding sanctions stand at `1.4lakhcr,
which is 3.2x of disbursement done during FY15. This alone provides loan growth
visibility in the next few years. Improvement in sector outlook will lead to further
improvement in loan book for the company. PFC is well capitalized with Tier I ratio
at 17.6%, which would enable the company to grow without diluting equity.
Moreover banks being cautious to lend to power sector and having to comply with
strict credit concentration norms, it creates even more space for specialized lenders
such as PFC to grow.
However RBI provisioning requirement for new loans restructured from April 2015
at 5% and for existing stock of restructured assets, gradual increase of provisions
from 2.75% to 5% in FY2018, will increase credit cost for the company.
Attractive valuations: At the offer-for-sale (OFS) price of `254, the stock is
trading at 0.77x the consensus FY2017E per book value of `329. Considering the
5% discount (`241), the stock is available at a P/B ratio of 0.73x consensus
FY2017E book, which is attractive. Hence, we recommend investors to apply for
PFC shares in the OFS.
Key financials
Y/E March (` cr)
FY2012
FY2013
FY2014
FY2015P
NII
3958
5,830
7,694
8,782
% chg
20.4
47.3
32.0
14.1
Net profit
3059
4,438
5,462
6,004
% chg
15.6
45.1
23.1
9.9
NIM (%)
3.5
4.0
4.4
4.4
EPS (`)
23.2
33.6
41.4
45.5
P/E (x)
12.1
8.3
6.8
6.1
P/ABV (x)
1.9
1.6
1.4
1.2
RoA (%)
2.5
2.9
3.0
2.8
RoE (%)
17.0
20.0
21.3
20.0
Company background
Incorporated in 1986, Power Finance Corporation (PFC) was formed as a part of
the government’s initiative to enhance funding of power projects in India. The
company plays a major role in channelizing investment into the power sector and
acts as a vehicle for development of this sector. Apart from funding, it works
closely with state governments & state power sector utilities and assists them to
undertake reforms within their organizations.
Market Outlook
July 27, 2015
PFC enjoys the highest credit rating in the Indian market; while in international
markets, the company is rated at par with the Indian Sovereign rating. The
company is registered as a non-banking financial company (NBFC) by the RBI and
was conferred with the status of Nav-Ratna PSU by the Government of India on
June 22, 2007. The company was conferred with the status of NBFCND-IFC (Non
Banking Finance Company-Non Deposit Taking-Infrastructure Finance Company)
on July 28, 2010.
Details of the issue
The Promoter (Government of India), proposes to sell 6,60,02,035 equity shares
of face value of `10 each representing 5% of the total paid up equity share capital
of the company. PFC has fixed the OFS floor price at `254 per share (at a ~2%
discount to its closing price as on July 24, 2015). Retail shareholders will get an
additional discount of 5% on cut-off price. 20% of the issue is reserved for retail
investors.
Pre-Issue
Post-Issue
Particulars
No. of shares
(%)
No. of shares
(%)
Promoter and promoter group
96,09,26,401
72.8
89,49,24,366
67.8
Total public holding
35,91,14,303
27.2
42,51,16,338
32.2
Total
1,32,00,40,704
100
1,32,00,40,704
100
Income statement
Y/E. March (` cr)
FY11
FY12
FY13
FY14
FY15P
Interest Earned
9,776
12,621
16,923
20,980
24,262
Interest Expended
6,490
8,663
11,093
13,286
15,480
Net Interest Income
3,287
3,958
5,830
7,694
8,782
- YoY Growth (%)
13.0
20.4
47.3
32.0
14.1
Other Income
437.8
475
395
649
750
- YoY Growth (%)
72.0
8.5
(16.9)
64.4
15.6
Operating Income
3,725
4,433
6,225
8,343
9,532
- YoY Growth (%)
17.8
19.0
40.4
34.0
14.3
Operating Expenses
107
144
150
249
242
- YoY Growth (%)
(9.3)
34.4
4.2
65.4
(2.5)
Pre - Provision Profit
3,617
4,289
6,074
8,094
9,290
- YoY Growth (%)
18.8
18.6
41.6
33.3
14.8
Provision and
32
143
81
470
844
Contingencies
- YoY Growth (%)
350
(43)
481
80
Profit Before Tax
3,586
4,146
5,994
7,624
8,446
- YoY Growth (%)
17.7
15.6
44.6
27.2
10.8
Provision for Taxation
938
1,087
1,556
2,163
2,441
- as a % of PBT
26.2
26.2
26.0
28.4
28.9
PAT
2,647
3,059
4,438
5,462
6,004
- YoY Growth (%)
11.3
15.6
45.1
23.1
9.9
Market Outlook
July 27, 2015
Balance sheet
Y/E. March (` cr)
FY11
FY12
FY13
FY14
FY15P
Share Capital
1,148
1,320
1,320
1,320
1,320
Res. & Surplus
14,093
19,473
22,360
26,202
31,091
Borrowings
85,599
1,10,126
1,39,473
1,59,215
1,87,795
- Growth (%)
26.3
28.7
26.6
14.2
18.0
Other Liab. & Prv.
3,803
4,676
5,968
7,309
8,517
Total Liabilities
104642
135595
1,69,121
1,94,047
2,28,723
Investments
27
27
27
27
24
Advances
97,622
1,24,556
1,58,380
1,87,098
2,14,244
- Growth (%)
22.2
27.6
27.2
18.1
14.5
Fixed Assets
77
77
75
72
104
Other Assets
6,917
10,934
10,639
6,849
14,351
Total Assets
104643
135594
1,69,121
1,94,047
2,28,723
Key Ratios
Year end March
FY11
FY12
FY13
FY14
FY15P
Per Share Data (`)
EPS
23.1
23.2
33.6
41.4
45.5
ABVPS ( 75% Coverage for NPAs)
131.6
150.9
173.9
203.4
235.7
DPS
5.2
6.0
7.0
9.0
9.3
Profitability ratios (%)
Yield on earning assets
10.8
11.1
11.7
12.0
12.1
Cost of funds
8.5
8.9
8.9
8.9
8.9
NIMs
3.6
3.5
4.0
4.4
4.4
ROA
2.8
2.5
2.9
3.0
2.8
ROE
18.5
17.0
20.0
21.3
20.0
Asset Quality (%)
Gross NPAs
0.24
1.09
0.72
0.66
1.10
Net NPAs
0.20
0.98
0.64
0.53
0.88
Valuation Ratios
PER (x)
12.1
12.1
8.3
6.8
6.1
P/ABVPS (x)
2.1
1.9
1.6
1.4
1.2
Dividend Yield
1.9
2.1
2.5
3.2
3.3
DuPont Analysis (%)
NII
3.5
3.3
3.8
4.2
4.2
(-) Prov. Exp.
0.0
0.1
0.1
0.3
0.4
Adj NII
3.4
3.2
3.8
4.0
3.8
Other Inc.
0.5
0.4
0.3
0.4
0.4
Op. Inc.
3.9
3.6
4.0
4.3
4.1
Opex
0.1
0.1
0.1
0.1
0.1
PBT
3.8
3.5
3.9
4.2
4.0
Taxes
1.0
0.9
1.0
1.2
1.2
ROA
2.8
2.5
2.9
3.0
2.8
Leverage
6.7
6.7
6.9
7.1
7.1
ROE
18.5
17.0
20.0
21.3
20.0
Market Outlook
July 27, 2015
Lupin Acquires Specialty Product Portfolio in Germany
Lupin announced it has entered into a strategic asset purchase agreement with
TEMMLER PHARMA GMBH & CO. KG (Temmler), a part of the Aenova Group, one
of the world’s largest pharmaceutical contract manufacturers, to acquire Temmler's
specialty product portfolio subject to certain closing conditions.
Based in Marburg (Germany), Temmler has a fast growing specialty portfolio of 13
products including key Central Nervous System (CNS) products and specialty
products that address rare disease areas like Myasthenia Gravis, Huntington
disease as well as fast-growing dermatology products for anti-wart treatment. This
adds to Lupin’s specialty business. Temmler’s business has a strong strategic fit
with Lupin’s business in Germany and enables Lupin to bring an enhanced
specialty CNS portfolio to the German market. While the cost of acquisition and
sales are not available, we don’t think the sales will be significant to contribute
significantly to the overall sales. We maintain our neutral rating on the stock.
Result Review
Hitachi Home (CMP: `1,518/ TP: -/ Upside: -)
For 1QFY2016, the company reported numbers that were in-line with our
estimates. The top-line grew by 18.1% yoy to `709cr against our estimate of
`704cr. Operating expenses as a percentage of sales were stable during the
quarter where - raw material cost (as a percentage of sales) declined by 13bp yoy
to 62.8%, employee expense de-grew by 67bp yoy to 4.0% and other expenses
grew by 2bp yoy to 21% of sales. This resulted in EBITDA increasing by 26.1% yoy
to `87cr and EBITDA margin improving by 78bp yoy to 12.2%. We had built in
slightly higher raw material cost of 63.8% of sales which resulted in EBITDA
margin coming above our estimate of 10.9%. Owing to higher foreign exchange
loss of `3cr (against `0.3cr in the same quarter of the previous year) and higher
depreciation, the net profit witnessed 8.1% yoy improvement to `47cr, which is
in-line with our estimate of `46cr.
At the current market price, the stock is trading at PE of 39.1x for FY2017E. We
maintain our Neutral recommendation on the stock owing to higher valuations.
Y/E
Sales OPM
PAT
EPS ROE P/E P/BV EV/EBITDA EV/Sales
Mar
(` cr)
(%)
(` cr)
(`)
(%)
(x)
(x)
(x)
(x)
FY2016E
1,806
9.2
79
29.1
22.6
52.2
10.6
25.4
2.3
FY2017E
2,112
9.7
105
38.8
24.0
39.1
8.4
20.4
2.0
Relaxo Footwears (CMP: `569/ TP: -/ Upside: -)
For 1QFY2016, Relaxo footwears reported numbers that were mainly in-line with
our estimates. The top-line during the quarter witnessed 21.4% yoy improvement
to `452cr against our expectation of `442cr. Raw material cost as a percentage of
sales decline significantly by 509bp yoy to 40.8%. Employee expenses (% of sales)
remained stable at 9.0% of (vs. 8.9% in the same quarter of the previous year) and
other expenses as a percentage of sales increased by 256bp yoy to 35.3%. On the
back of decline in raw material cost, the EBITDA margin expanded by 237bp yoy
Market Outlook
July 27, 2015
to 14.8%. Consequently, the net profit grew by 55.5% yoy to `36cr vis-à-vis our
expectation of `34cr.
At the current market price, the stock is trading at PE of 45.8x for FY2017E. We
have a Neutral recommendation on the stock.
Y/E
Sales OPM
PAT
EPS ROE P/E P/BV EV/EBITDA EV/Sales
Mar
(` cr)
(%)
(` cr)
(`)
(%)
(x)
(x)
(x)
(x)
FY2016E
1,796
12.3
115
19.1
27.3
59.5
14.4
31.5
3.9
FY2017E
2,169
12.5
149
24.8
27.5
45.8
11.2
25.2
3.2
Visaka Industries (CMP: `143/ TP: `161/ Upside: 13%)
For 1QFY2016, Visaka Industries posted decent set of numbers. The top-line
during the quarter grew by 2.9% yoy to `321cr. The raw material cost as a
percentage of sales remained the same on qoq basis but it declined by 319bp yoy
to 58.7%. Employee expense grew marginally by 29bp yoy to 5.8% of sales and
other expenses increased by 268bp yoy to 24.3% thus negating the positive impact
of lower raw material cost. As a result, the EBITDA margin improved marginally by
23bp yoy to 11.2% - against our expectation of 11.1%. Depreciation expense
declined by 30.3% to `9cr and consequently, the net profit for the quarter grew by
21.6% yoy to `14cr.
The top-line for the Building Products segment of the company grew marginally by
4.2% on yoy basis to `274cr. The EBIT margin for the segment reported 79bp yoy
expansion to 9.0% and segment ROCE improved marginally to 18.3% from 18.1%
in the same quarter of the previous year. The Synthetic Yarn segment witnessed
7.6% yoy decline in its top-line to `44cr with EBIT margin expanding significantly
by 723bp yoy to 17.4%. The ROCE for the segment improved to 55.9% from
35.4% in 1QFY2015.
At the current market price, the stock is trading at PE of 4.4x for FY2017E. We
maintain our Accumulate rating on the stock with a revised target price of `161
based on target PE of 5.0X for FY2017E.
Y/E
Sales OPM
PAT
EPS ROE P/E P/BV EV/EBITDA EV/Sales
Mar
(` cr)
(%)
(` cr)
(`)
(%)
(x)
(x)
(x)
(x)
FY2016E
1,113
9.6
36
22.9
10.1
6.2
0.6
4.3
0.4
FY2017E
1,254
10.0
51
32.2
12.8
4.4
0.6
3.7
0.4
Result Preview
Subros Ltd (CMP: `80/ TP: /Upside: )
Subros Ltd is slated to announce its 1QFY2016 results today. Revenues are
estimated to grow 8% yoy to `309cr. Volumes are expected to grow 12% yoy on
back of strong double digit growth by major customer Maruti Suzuki. However
realization/kit is likely to decline 4% yoy on back of continued weakness in
Japanese Yen. Operating margins are likely to improve 220 bp yoy to 12.6% on
back of decline in raw material costs (due to Yen depreciation) and operating
leverage. We expect the Net Profit to come in at `7.9cr as against `3.3cr reported
in 1QFY2015. Currently we have Neutral rating on the stock.
Market Outlook
July 27, 2015
Y/E
Sales OPM
PAT
EPS ROE P/E P/BV EV/EBITDA EV/Sales
March
(` cr)
(%)
(` cr)
(`)
(%)
(x)
(x)
(x)
(x)
FY2016E
1,295
11.7
25
4.2
7.7
19.2
1.4
5.7
0.6
FY2017E
1,533
12.0
44
7.3
12.4
11.0
1.3
4.5
0.5
Tech Mahindra (CMP: `511/ TP: `646/Upside: 26.4%)
Tech Mahindra is expected to announce its 1QFY2016 results today. The company
is expected to post a dip of 0.1% qoq in USD revenues to US$983mn V/s
US$984mn in 4QFY2015. The, company has already guided for a weaker
1QFY2016, on back of the weakness in Telecom and Energy domain. In rupee
terms, the revenues are expected to come in at `6,242cr V/s `6,117cr in
4QFY2015, a qoq growth of 2.0%. The EBDITA is expected to come in at 14.9%
and EBIT is expected to be around 12.1%, registering a dip of 30bp and 24bps
qoq respectively. Consequently; the PAT is expected to come in at `556cr V/s
`472cr in 4QFY2015 a growth of 17.9% qoq. We maintain our buy rating on the
stock with a target price of `646.
Y/E
Sales OPM
PAT
EPS ROE P/E P/BV EV/EBITDA EV/Sales
March
(` cr)
(%)
(` cr)
(`)
(%)
(x)
(x)
(x)
(x)
FY2016E
27,281
17.3
2,957
30.8
20.3
16.6
3.4
9.5
1.6
FY2017E
31,373
18.4
3,651
38.0
20.9
13.4
2.8
7.3
1.3
Quarterly Bloomberg Brokers Consensus Estimate
Tech Mahindra Ltd (Consol)- July 27, 2015
Particulars (` cr)
1QFY16E
1QFY15
y-o-y (%)
4QFY15
q-o-q (%)
Net sales
6,218
5,122
21.4
6,117
1.7
EBITDA
923
928
(0.6)
928
(0.6)
EBITDA margin (%)
14.8
18.1
15.2
Net profit
593
631
(6.0)
472
25.6
Ambuja Cements Ltd- July 27, 2015
Particulars (` cr)
1QFY16E
1QFY15
y-o-y (%)
4QFY15
q-o-q (%)
Net sales
2,505
2,706
(7.4)
2,425
3.3
EBITDA
390
588
(33.6)
510
(23.5)
EBITDA margin (%)
15.6
21.7
21.0
Net profit
251
409
(38.7)
318
(21.1)
Maruti Suzuki India Ltd- July 28, 2015
Particulars (` cr)
1QFY16E
1QFY15
y-o-y (%)
4QFY15
q-o-q (%)
Net sales
13,420
11,074
21.2
13,273
1.1
EBITDA
2,130
1,328
60.4
2,164
(1.6)
EBITDA margin (%)
15.9
12.0
16.3
Net profit
1,269
762
66.5
1,284
(1.2)
Market Outlook
July 27, 2015
Housing Development Finance Corp- July 28, 2015
Particulars (` cr)
1QFY16E
1QFY15
y-o-y (%)
4QFY15
q-o-q (%)
Net sales
2,154
6,447
(66.6)
7,448
(71.1)
EBITDA
1,874
6,234
(69.9)
7,241
(74.1)
EBITDA margin (%)
87.0
96.7
97.2
Net profit
1,365
1,345
1.5
1,862
(26.7)
Punjab National Bank- July 28, 2015
Particulars (` cr)
1QFY16E
1QFY15
y-o-y (%)
4QFY15
q-o-q (%)
PAT
872
1,405
(38.0)
307
184.3
Bank of India- July 28, 2015
Particulars (` cr)
1QFY16E
1QFY15
y-o-y (%)
4QFY15
q-o-q (%)
PAT
329
806
(59.1)
(56)
0.0
IDBI Bank Ltd- July 28, 2015
Particulars (` cr)
1QFY16E
1QFY15
y-o-y (%)
4QFY15
q-o-q (%)
PAT
150
105
43.3
546
(72.5)
Union Bank of India- July 28, 2015
Particulars (` cr)
1QFY16E
1QFY15
y-o-y (%)
4QFY15
q-o-q (%)
PAT
509
664
(23.3)
444
14.7
Yes Bank Ltd- July 29, 2015
Particulars (` cr)
1QFY16E
1QFY15
y-o-y (%)
4QFY15
q-o-q (%)
PAT
550
439
25.1
551
(0.2)
Nestle India Ltd- July 29, 2015
Particulars (` cr)
1QFY16E
1QFY15
y-o-y (%)
4QFY15
q-o-q (%)
Net sales
2,361
2,419
(2.4)
2,507
(5.8)
EBITDA
400
500
(20.1)
612
(34.7)
EBITDA margin (%)
16.9
20.7
24.4
Net profit
272
288
(5.6)
320
(15.2)
Dabur India Ltd (Consol)- July 29, 2015
Particulars (` cr)
1QFY16E
1QFY15
y-o-y (%)
4QFY15
q-o-q (%)
Net sales
2,065
1,864
10.8
1,945
6.2
EBITDA
317
268
18.4
346
(8.2)
EBITDA margin (%)
15.4
14.4
17.8
Net profit
255
211
21.1
285
(10.3)
Godrej Consumer Products Ltd (Consol)- July 29, 2015
Particulars (` cr)
1QFY16E
1QFY15
y-o-y (%)
4QFY15
q-o-q (%)
Net sales
2,116
1,886
12.2
2,083
1.6
EBITDA
298
242
23.4
387
(22.9)
EBITDA margin (%)
14.1
12.8
18.6
Net profit
193
143
34.8
266
(27.2)
Market Outlook
July 27, 2015
JSW Steel Ltd (Consol)- July 29, 2015
Particulars (` cr)
1QFY16E
1QFY15
y-o-y (%)
4QFY15
q-o-q (%)
Net sales
11,583
13,067
(11.4)
12,364
(6.3)
EBITDA
1,540
2,612
(41.0)
1,683
(8.4)
EBITDA margin (%)
13.3
20.0
13.6
Net profit
(98)
656
0.0
62
0.0
Vedanta- July 29, 2015
Particulars (` cr)
1QFY16E
1QFY15
y-o-y (%)
4QFY15
q-o-q (%)
Net sales
17,403
17,056
2.0
17,732
(1.9)
EBITDA
4,300
5,673
(24.2)
4,014
7.1
EBITDA margin (%)
24.7
33.3
22.6
Net profit
544
1,341
(59.5)
491
10.6
NHPC Ltd- July 29, 2015
Particulars (` cr)
1QFY16E
1QFY15
y-o-y (%)
4QFY15
q-o-q (%)
Net sales
2,168
2,034
6.6
1,450
49.5
EBITDA
1,467
1,317
11.3
872
68.2
EBITDA margin (%)
67.7
64.8
60.2
Net profit
763
616
23.9
645
18.4
Economic and Political News
Modi sounds Bihar poll bugle, inaugurates slew of projects
Govt. may Issue `15,000cr Sovereign Gold Bonds in Fiscal Second Half
Disinvestment Department Wants PF Body to Invest `6,000cr: Report
Govt approves `1,000cr for India-Bangladesh rail link
Corporate News
ONGC to invest $8.8bn in KG oil and gas finds
Tata JLR planning new plant in Poland
Reliance Jio spending `1,00,000cr on 4G rollout
JSW Steel to seek shareholders' nod to raise `14,000cr
Market Outlook
July 27, 2015
Top Picks
Large Cap
Market Cap
CMP
Target
Upside
Company
Sector
Rating
(` Mn)
(`)
(`)
(%)
Axis Bank
Financials
1,38,010
Buy
581
716
23.2
ICICI Bank
Financials
1,74,426
Buy
301
392
30.4
Infosys
IT
2,50,218
Buy
1,089
1,306
19.9
Power Grid
Power
74,289
Buy
142
170
19.7
TCS
IT
4,90,417
Buy
2,504
3,168
26.5
Tech Mahindra
IT
49,134
Buy
511
646
26.4
Yes Bank
Financials
33,810
Buy
809
1,006
24.4
Ashok Leyland
Auto
22,938 Accumulate
81
88
9.2
LIC Housing Fin.
Financials
24,966 Accumulate
495
553
11.8
MRF
Others
16,340 Accumulate
38,528
43,439
12.7
Source: Angel Research, Bloomberg
Mid Cap
Market
CMP
Target
Upside
Company
Sector
Rating
Cap (` Mn)
(`)
(`)
(%)
Action Const. Equip. Capital Goods
428
Buy
43
54
24.9
Bajaj Electricals
Others
2,789
Buy
277
341
23.3
Hindustan Media Ven. Media
1,790
Buy
244
292
19.7
JK Tyre
Auto Ancillary
2,349
Buy
104
127
22.6
MBL Infrastructures
Construction
1,218
Buy
588
789
34.2
Mangalam Cements Cement
721
Buy
270
349
29.3
MT Educare
Others
447
Buy
112
141
25.5
Radico Khaitan
Others
1,222
Buy
92
112
21.9
Setco Automotive
Auto Ancillary
626
Buy
234
286
22.1
Source: Angel Research, Bloomberg
Market Outlook
July 27, 2015
Result Calendar
Date
Company
July 27, 2015
Subros, KEC International, Ambuja Cements, Tech Mahindra, Jagran Prakashan, MRF
Maruti, Thermax, Blue Star, HDFC, Punjab Natl.Bank, Bank of India, Union Bank, IDBI Bank, Syndicate Bank, Tide
July 28, 2015
Water Oil India
United Phosphorus, Yes Bank, Allahabad Bank, Nestle, Dabur India, Godrej Consumer, Mphasis, Sesa Goa, JSW Steel
July 29, 2015
, Essar Oil, NHPC
Exide Industries, Kotak Mah. Bank, Bank of Baroda, IDFC, Oriental Bank, Vijaya Bank, Dena Bank, ITC, Colgate,
July 30, 2015
Electrosteel Castings, Petronet LNG, Jyothy Laboratories, HSIL, L G Balakrishnan & Bros, Dr Reddy's, Glenmark
Pharma., Ipca labs, Indoco Remedies, NTPC
July 31, 2015
Suzlon Energy, ICICI Bank, Shriram Trans., Sun TV Network, GSK Pharma, Alembic Pharma, CESC
August 1, 2015
Transport Corporation of India
August 2, 2015
August 3, 2015
Hero Motocorp, Bharat Forge, BGR Energy , HCL Tech, Styrolution, Vesuvius India
August 4, 2015
Britannia, Hexaware, Sterling Tools
Tata Chemicals, Automotive Axle, Siemens, Ramco Cements, GlaxoSmith Con, Indraprasth Gas, ITD Cementation,
August 5, 2015
PTC India
August 6, 2015
Tata Global, Motherson Sumi, Cummins India, Bajaj Electrical
August 7, 2015
Tata Motors, M&M, Rural Elec.Corp., GSPL, Kirloskar Engines India Ltd
Source: Bloomberg, Angel Research
Global economic events release calendar
Date
Time
Country Event Description
Unit
Period
Bloomberg Data
Last Reported Estimated
July 28, 2015
2:00PM UK
GDP (YoY)
% Change
2Q A
2.90
2.60
7:30PM US
Consumer Confidence
S.A./ 1985=100
Jul
101.40
100.00
July 29, 2015
11:30PM US
FOMC rate decision
%
Jul 29
0.25
0.25
July 30, 2015
1:25PM Germany Unemployment change (000's)
Thousands
Jul
(1.00)
(5.50)
6:00PM US
GDP Qoq (Annualised)
% Change
2Q A
(0.20)
2.50
August 1, 2015
6:30AM China PMI Manufacturing
Value
Jul
50.20
--
August 3, 2015
2:00PM UK
PMI Manufacturing
Value
Jul
51.40
--
August 4, 2015
11:00AM India
RBI Reverse Repo rate
%
Aug 4
6.25
--
11:00AM India
RBI Repo rate
%
Aug 4
7.25
--
11:00AM India
RBI Cash Reserve ratio
%
Aug 4
4.00
--
August 6, 2015
4:30PM UK
BOE Announces rates
% Ratio
Aug 6
0.50
0.50
2:00PM UK
Industrial Production (YoY)
% Change
Jun
2.10
--
August 7, 2015
6:00PM US
Change in Nonfarm payrolls
Thousands
Jul
223.00
--
6:00PM US
Unnemployment rate
%
Jul
5.30
--
August 8, 2015
China
Exports YoY%
% Change
Jul
2.80
--
August 9, 2015
7:00AM China Consumer Price Index (YoY)
% Change
Jul
1.40
--
August 10, 2015
India
Imports YoY%
% Change
Jul
(13.40)
--
India
Exports YoY%
% Change
Jul
(15.80)
--
August 12, 2015
2:00PM UK
Jobless claims change
% Change
Jul
7.00
--
11:00AM China Industrial Production (YoY)
% Change
Jul
6.80
--
5:30PM India
Industrial Production YoY
% Change
Jun
2.70
--
Source: Bloomberg, Angel Research
Market Outlook
July 27, 2015
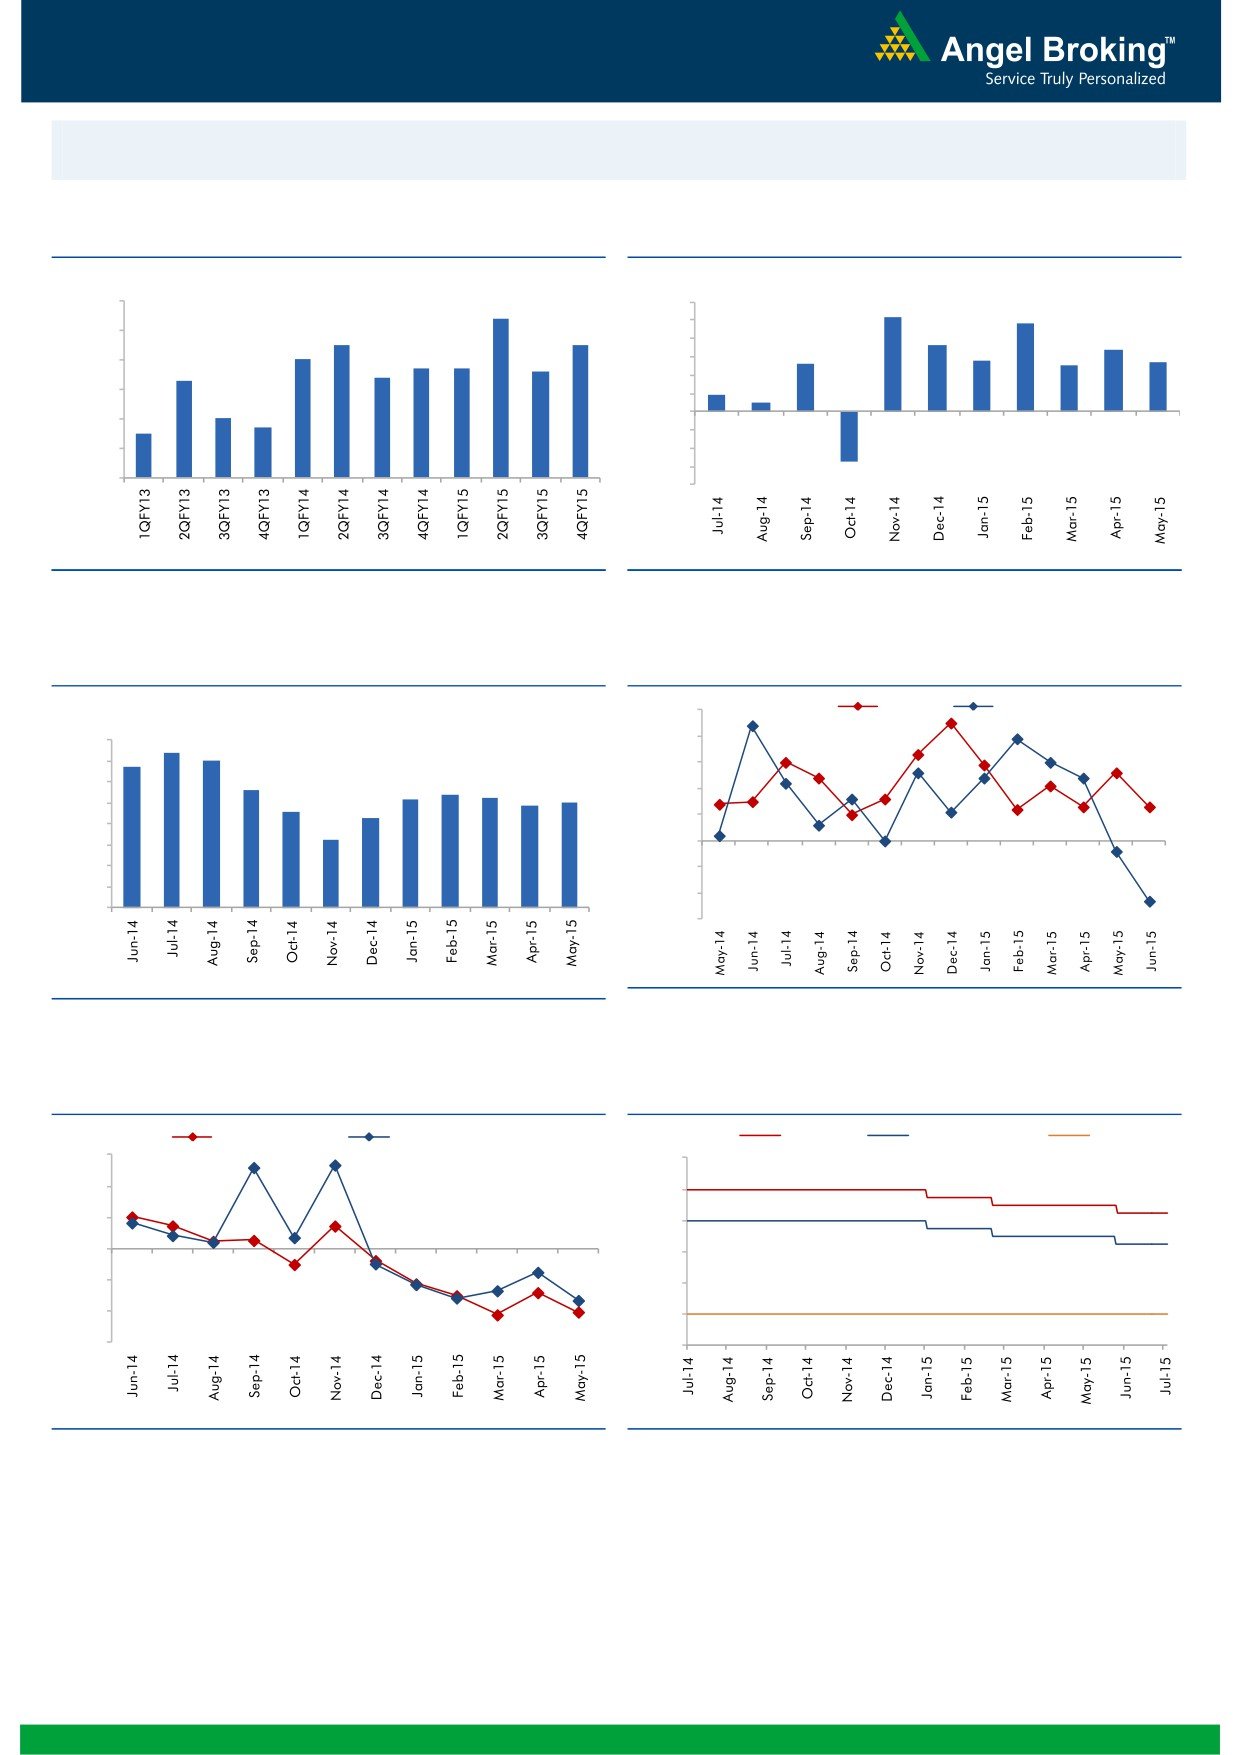
Macro watch
Exhibit 1: Quarterly GDP trends
Exhibit 2: IIP trends
(%)
(%)
9.0
8.4
6.0
5.2
4.8
5.0
8.0
7.5
7.5
3.6
3.4
7.0
4.0
2.8
2.7
6.7
6.7
2.6
2.5
6.6
3.0
7.0
6.3
6.4
2.0
0.9
6.0
0.5
1.0
5.0
4.7
-
5.0
4.5
(1.0)
4.0
(2.0)
(3.0)
3.0
(2.7)
(4.0)
Source: CSO, Angel Research
Source: MOSPI, Angel Research
Exhibit 3: Monthly CPI inflation trends
Exhibit 4: Manufacturing and services PMI
(%)
55.0
Mfg. PMI
Services PMI
8.0
7.4
54.0
6.8
7.0
7.0
53.0
5.6
5.4
6.0
5.2
5.3
4.9
5.0
52.0
4.6
5.0
4.3
51.0
4.0
3.3
50.0
3.0
2.0
49.0
1.0
48.0
-
47.0
Source: Market, Angel Research; Note: Level above 50 indicates expansion
Source: MOSPI, Angel Research
Exhibit 5: Exports and imports growth trends
Exhibit 6: Key policy rates
(%)
Exports yoy growth
Imports yoy growth
(%)
Repo rate
Reverse Repo rate
CRR
30.0
9.00
20.0
8.00
10.0
7.00
0.0
6.00
(10.0)
5.00
(20.0)
4.00
(30.0)
3.00
Source: Bloomberg, Angel Research
Source: RBI, Angel Research
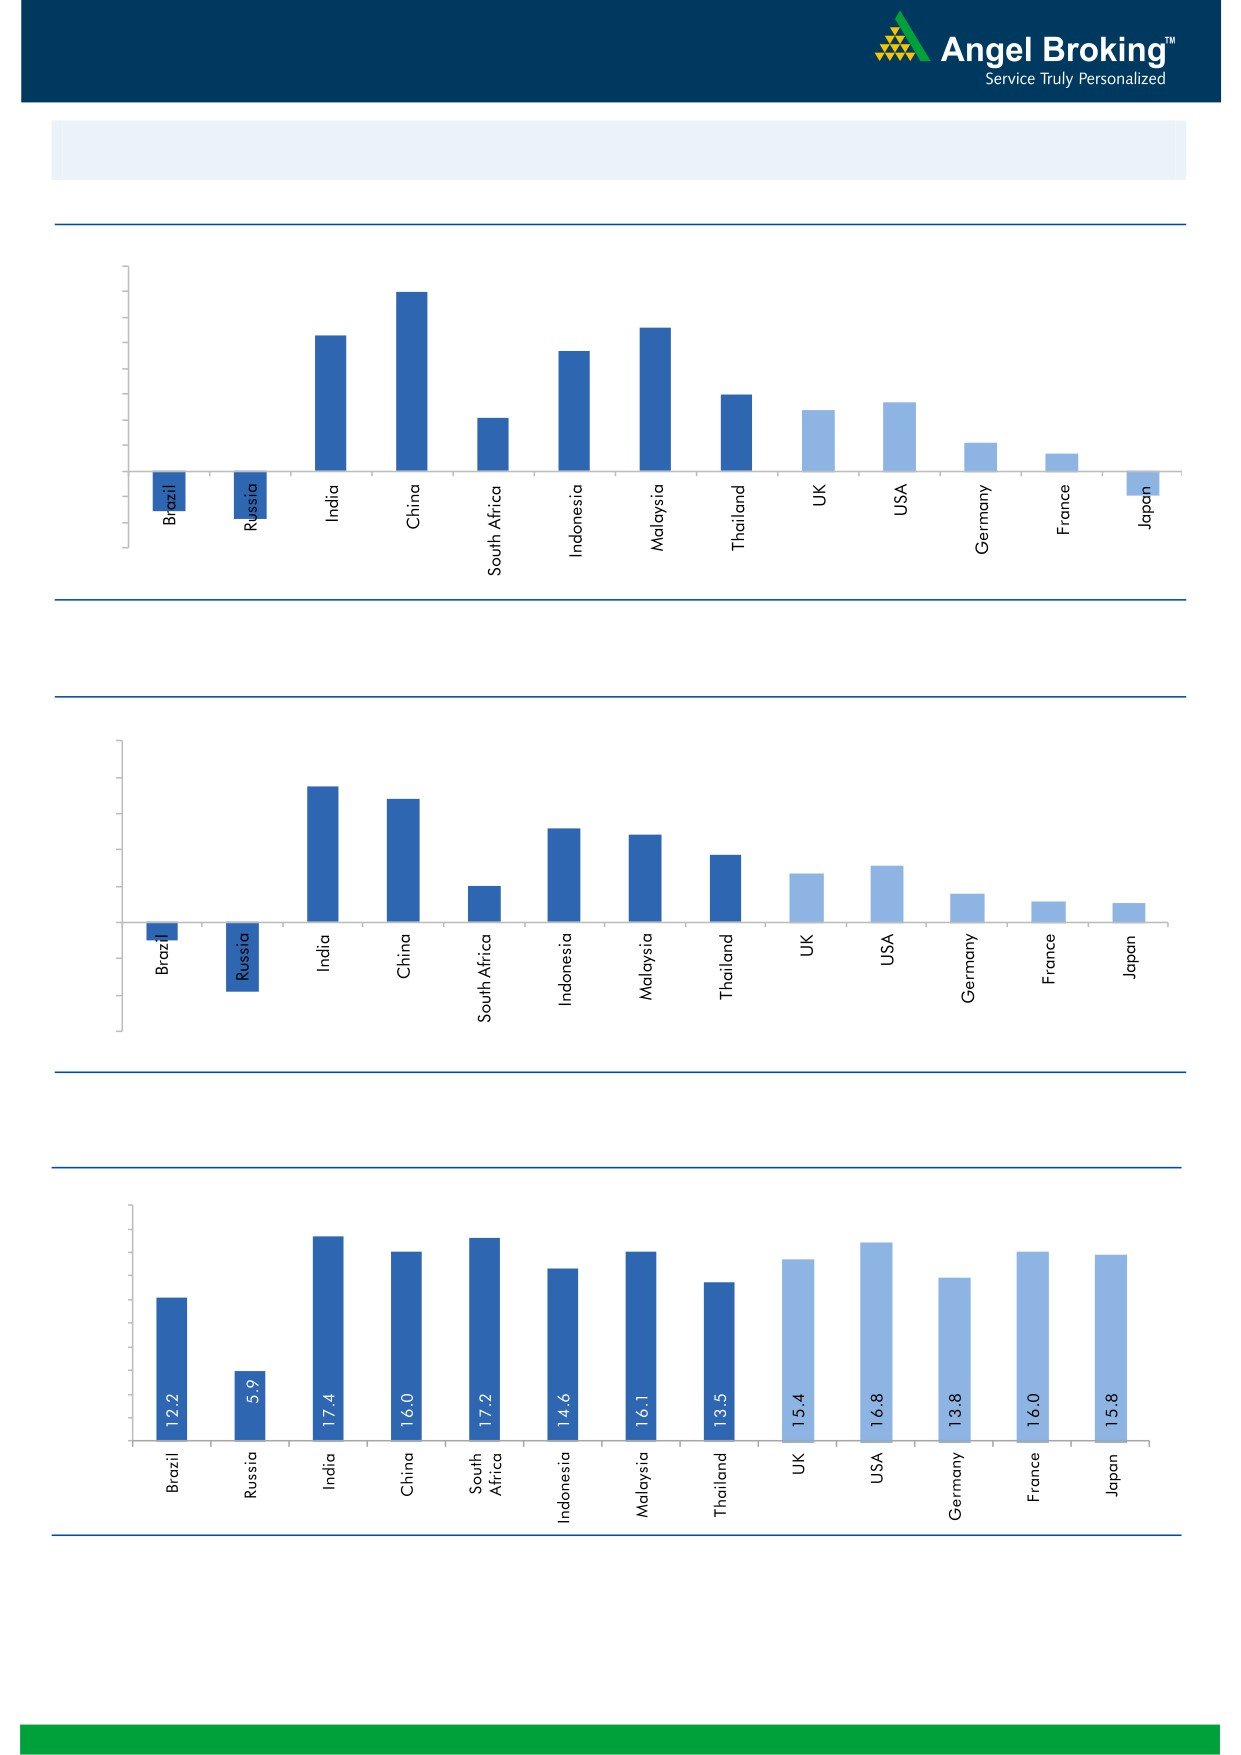
Market Outlook
July 27, 2015
Global watch
Exhibit 1: Latest quarterly GDP Growth (%, yoy) across select developing and developed countries
(%)
8.0
7.0
7.0
5.6
6.0
5.3
4.7
5.0
4.0
3.0
2.7
3.0
2.4
2.1
2.0
1.1
0.7
1.0
(1.6)
(1.9)
(0.9)
-
(1.0)
(2.0)
(3.0)
Source: Bloomberg, Angel Research
Exhibit 2: 2015 GDP Growth projection by IMF (%, yoy) across select developing and developed countries
(%)
10.0
7.5
8.0
6.8
6.0
5.2
4.8
3.7
4.0
3.1
2.7
2.0
1.6
2.0
1.2
1.0
(1.0)
(3.8)
-
(2.0)
(4.0)
(6.0)
Source: IMF, Angel Research
Exhibit 3: One year forward P-E ratio across select developing and developed countries
(x)
20.0
18.0
16.0
14.0
12.0
10.0
8.0
6.0
4.0
2.0
-
Source: Bloomberg, Angel Research
Market Outlook
July 27, 2015
Exhibit 4: Relative performance of indices across globe
Returns (%)
C ountry
Name of index
Closing price
1M
3M
1YR
Brazil
Bovespa
49,246
(8.4)
(9.8)
(15.1)
Russia
Micex
1,596
(3.4)
(6.7)
13.4
India
Nifty
8,522
1.9
2.6
13.2
China
Shanghai Composite
4,071
(13.2)
(7.8)
96.9
South Africa
Top 40
45,858
(2.9)
(4.5)
(1.3)
Mexico
Mexbol
44,249
(2.6)
(3.3)
(0.4)
Indonesia
LQ45
828
(2.6)
(12.1)
(3.7)
Malaysia
KLCI
1,721
(0.4)
(7.2)
(8.6)
Thailand
SET 50
943
(4.6)
(8.8)
(8.4)
USA
Dow Jones
17,569
(3.2)
(2.7)
3.6
UK
FTSE
6,580
(3.9)
(6.7)
(3.1)
Japan
Nikkei
20,545
(1.3)
4.6
33.4
Germany
DAX
11,347
(1.1)
(3.2)
15.9
France
CAC
5,057
0.2
(2.8)
17.3
Source: Bloomberg, Angel Research
Market Outlook
July 27, 2015
Stock Watch
Company Name
Reco
CMP
Target
Mkt Cap
Sales ( Čcr )
OPM(%)
EPS (Č)
PER(x)
P/BV(x)
RoE(%)
EV/Sales(x)
(Č)
Price ( Č)
( Č cr )
FY16E FY17E
FY16E
FY17E
FY16E
FY17E
FY16E
FY17E
FY16E
FY17E
FY16E
FY17E
FY16E
FY17E
Agri / Agri Chemical
Rallis
Neutral
235
-
4,564
2,075
2,394
14.4
14.4
9.5
11.0
24.7
21.3
4.9
4.2
21.1
21.3
2.2
1.9
United Phosphorus
Neutral
537
-
23,016
13,698
15,752
17.6
17.6
32.1
38.5
16.7
14.0
3.3
2.7
21.4
21.3
1.8
1.5
Auto & Auto Ancillary
Ashok Leyland
Accumulate
81
88
22,938
17,094
19,726
9.5
10.7
2.7
4.2
29.9
19.2
4.1
3.8
13.9
19.8
1.3
1.1
Bajaj Auto
Neutral
2,497
-
72,268
25,664
29,609
18.8
18.6
134.2
150.3
18.6
16.6
5.7
4.9
30.7
29.6
2.4
2.1
Eicher Motors
Accumulate
20,114
21,843
54,594
11,681
15,550
15.3
16.9
358.5
564.3
56.1
35.6
16.9
12.5
29.8
34.9
4.6
3.4
Hero Motocorp
Neutral
2,738
-
54,678
29,771
34,219
13.0
13.5
142.3
165.2
19.2
16.6
7.0
5.9
36.3
35.8
1.7
1.4
L G Balakrishnan & Bros Accumulate
498
541
781
1,254
1,394
11.6
11.8
35.9
41.7
13.9
12.0
1.9
1.7
13.5
13.8
0.7
0.7
Mahindra and Mahindra Neutral
1,328
-
82,506
41,078
46,473
11.5
12.0
51.4
62.7
25.8
21.2
3.8
3.4
14.7
15.9
1.7
1.5
Maruti
Neutral
4,234
-
127,890
57,615
68,166
15.6
15.5
180.2
220.0
23.5
19.2
4.6
4.0
19.7
20.6
2.0
1.6
Minda Industries
Buy
550
652
872
2,500
2,889
7.6
8.3
39.4
54.3
14.0
10.1
2.0
1.7
14.1
16.3
0.5
0.4
Rane Brake Lining
Accumulate
338
366
267
454
511
11.1
11.4
23.8
28.1
14.2
12.0
2.0
1.8
14.2
15.3
0.7
0.7
Setco Automotive
Buy
234
286
626
718
862
13.3
14.3
13.4
19.0
17.5
12.3
2.7
2.3
15.4
18.5
1.1
1.0
Tata Motors
Buy
391
489
112,933
260,543
278,575
13.3
13.7
31.7
38.0
12.3
10.3
1.4
1.3
12.2
13.0
0.6
0.7
TVS Motor
Neutral
251
-
11,946
11,839
13,985
7.0
8.1
10.8
16.2
23.3
15.5
5.9
4.7
25.5
30.1
1.0
0.8
Amara Raja Batteries
Neutral
858
-
14,663
5,355
6,641
17.4
17.8
31.8
40.9
27.0
21.0
6.8
5.4
25.2
25.5
2.7
2.1
Exide Industries
Accumulate
151
164
12,844
7,919
9,028
13.9
14.4
7.3
8.6
20.7
17.6
2.8
2.6
13.8
14.4
1.4
1.2
Apollo Tyres
Neutral
194
-
9,878
12,866
13,892
15.7
15.4
20.1
19.9
9.7
9.8
1.5
1.3
15.8
13.6
0.8
0.8
Ceat
Neutral
783
-
3,167
6,047
6,776
12.4
12.0
82.0
90.4
9.6
8.7
1.6
1.4
16.5
15.7
0.7
0.6
JK Tyres
Buy
104
127
2,349
7,774
8,456
13.3
12.9
17.3
18.1
6.0
5.7
1.4
1.1
22.8
19.7
0.6
0.6
Swaraj Engines
Neutral
872
-
1,083
604
689
14.3
14.5
51.4
60.7
17.0
14.4
4.0
3.6
23.4
24.7
1.7
1.4
Subros
Neutral
80
-
479
1,295
1,533
11.7
12.0
4.2
7.3
19.0
10.9
1.4
1.3
7.7
12.4
0.7
0.5
Indag Rubber
Buy
195
247
511
283
329
17.0
17.2
13.0
15.4
15.0
12.6
3.3
2.7
21.8
21.6
1.5
1.3
Capital Goods
ACE
Buy
43
54
428
660
839
4.7
8.2
1.0
3.9
43.3
11.1
1.4
1.2
3.2
11.3
0.8
0.6
BEML
Accumulate
1,482
1,607
6,171
3,277
4,006
6.0
8.9
29.2
64.3
50.8
23.1
5.7
11.7
2.0
1.6
BGR Energy
Neutral
126
-
911
3,615
3,181
9.5
9.4
16.7
12.4
7.6
10.2
0.7
0.7
10.0
7.0
0.7
0.8
BHEL
Neutral
280
-
68,618
33,722
35,272
10.8
11.7
10.5
14.2
26.7
19.7
2.0
1.9
7.0
9.0
2.1
2.0
Blue Star
Buy
333
391
2,998
3,649
4,209
4.8
5.7
8.5
14.0
39.4
23.8
6.3
5.4
16.3
24.4
0.9
0.8
Crompton Greaves
Buy
182
220
11,426
15,252
16,870
5.4
5.6
7.9
10.7
23.1
17.0
2.8
2.5
12.0
15.0
0.8
0.7
Inox Wind
Buy
422
505
9,373
4,980
5,943
17.0
17.5
26.6
31.6
15.9
13.4
35.0
30.0
2.0
1.7
Market Outlook
July 27, 2015
Stock Watch
Company Name
Reco
CMP
Target
Mkt Cap
Sales ( Čcr )
OPM(%)
EPS (Č)
PER(x)
P/BV(x)
RoE(%)
EV/Sales(x)
(Č)
Price ( Č)
( Č cr )
FY16E
FY17E
FY16E
FY17E
FY16E
FY17E
FY16E
FY17E
FY16E
FY17E
FY16E
FY17E
FY16E
FY17E
Capital Goods
KEC International
Neutral
151
-
3,869
8,791
9,716
6.1
6.8
5.4
8.2
27.9
18.4
2.8
2.6
10.0
14.0
0.7
0.6
Thermax
Neutral
1,059
-
12,622
6,413
7,525
7.4
8.5
30.5
39.3
34.7
27.0
5.4
4.7
15.0
17.0
1.9
1.6
Cement
ACC
Accumulate
1,407
1,548
26,406
11,856
14,092
14.5
17.8
47.6
76.2
29.6
18.5
3.0
2.8
10.6
15.7
2.1
1.7
Ambuja Cements
Neutral
240
-
37,300
10,930
12,022
22.2
23.2
9.7
11.2
24.7
21.4
3.4
3.1
14.3
15.2
3.0
2.7
India Cements
Buy
84
132
2,593
4,716
5,133
14.9
15.8
1.0
4.5
84.4
18.8
0.9
0.8
1.0
4.5
0.9
0.8
JK Cement
Buy
627
778
4,385
4,061
4,748
16.2
17.7
24.5
42.9
25.6
14.6
2.5
2.2
10.0
15.9
1.5
1.3
J K Lakshmi Cement
Buy
322
443
3,790
3,004
3,618
17.6
19.9
13.9
27.2
23.2
11.8
2.6
2.3
11.8
20.5
1.7
1.3
Mangalam Cements
Buy
270
349
721
1,111
1,336
12.2
15.1
16.3
34.6
16.6
7.8
1.3
1.2
8.2
16.0
0.9
0.7
Orient Cement
Neutral
186
-
3,813
2,039
2,573
22.7
24.5
9.3
13.3
20.0
14.0
3.4
2.9
18.3
22.6
2.5
1.9
Ramco Cements
Neutral
361
-
8,597
4,036
4,545
20.8
21.3
15.1
18.8
23.9
19.2
2.9
2.6
12.9
14.3
2.6
2.3
Shree Cement^
Neutral
10,914
-
38,021
7,150
8,742
26.7
28.6
228.0
345.5
47.9
31.6
7.1
5.9
15.7
20.3
5.1
4.1
UltraTech Cement
Neutral
3,209
-
88,050
27,562
31,548
20.3
22.0
111.0
145.0
28.9
22.1
4.1
3.5
15.1
17.0
3.3
2.8
Construction
ITNL
Buy
148
211
3,640
7,589
8,021
34.0
35.9
16.0
19.0
9.2
7.8
0.6
0.5
6.5
6.7
3.6
3.8
KNR Constructions
Neutral
585
-
1,645
915
1,479
14.3
13.9
20.3
37.2
28.8
15.7
2.7
2.3
9.6
15.6
1.9
1.2
Larsen & Toubro
Accumulate
1,803
2,013
167,719
68,920
82,446
10.9
11.5
57.0
73.0
31.6
24.7
2.9
2.7
13.6
15.5
2.7
2.2
Gujarat Pipavav Port
Neutral
220
-
10,628
793
694
53.0
50.9
9.0
8.0
24.4
27.5
5.3
4.3
25.9
18.4
13.0
14.8
MBL Infrastructures
Buy
588
789
1,218
2,507
2,986
12.4
14.4
43.0
41.0
13.7
14.3
1.6
1.5
12.6
12.7
1.3
1.1
PNC Infratech
Accumulate
431
445
2,210
1,719
2,003
13.0
13.5
21.0
28.0
20.5
15.4
1.8
1.6
11.0
10.9
1.4
1.2
Financials
Allahabad Bank
Neutral
88
-
5,022
8,859
9,817
3.0
3.0
23.7
30.1
3.7
2.9
0.4
0.4
10.6
12.3
-
-
Axis Bank
Buy
581
716
138,010
26,522
31,625
3.6
3.6
36.2
45.4
16.1
12.8
3.1
2.7
18.2
19.6
-
-
Bank of Baroda
Neutral
155
-
34,322
18,934
21,374
2.0
2.0
13.2
15.1
11.8
10.3
0.9
0.8
7.1
7.7
-
-
Bank of India
Neutral
171
-
11,387
17,402
20,003
2.0
2.1
40.3
50.7
4.3
3.4
0.4
0.4
9.0
10.4
-
-
Canara Bank
Accumulate
279
297
14,387
15,805
17,745
2.0
2.2
64.3
73.5
4.4
3.8
0.5
0.4
10.8
11.3
-
-
Dena Bank
Neutral
44
-
2,444
3,580
4,040
2.1
2.2
8.4
10.9
5.2
4.0
0.5
0.4
6.8
8.4
-
-
Federal Bank
Neutral
70
-
11,978
3,522
4,045
3.2
3.2
12.2
14.1
5.7
5.0
0.7
0.6
12.9
13.4
-
-
HDFC
Neutral
1,354
-
213,513
11,198
13,321
3.5
3.5
45.1
53.7
30.1
25.2
6.2
5.6
27.2
28.2
-
-
HDFC Bank
Accumulate
1,107
1,255
277,968
38,629
47,500
4.5
4.7
52.6
66.4
21.0
16.7
3.9
3.3
19.6
21.2
-
-
ICICI Bank
Buy
301
392
174,426
36,037
41,647
3.5
3.6
22.9
26.7
13.1
11.3
2.2
1.9
15.7
15.9
-
-
IDBI Bank
Neutral
63
-
10,049
9,806
11,371
1.7
1.9
10.0
16.3
6.3
3.9
0.5
0.4
6.8
10.4
-
-
Market Outlook
July 27, 2015
Stock Watch
Company Name
Reco
CMP
Target
Mkt Cap
Sales ( Čcr )
OPM(%)
EPS (Č)
PER(x)
P/BV(x)
RoE(%)
EV/Sales(x)
(Č)
Price ( Č)
( Č cr )
FY16E FY17E
FY16E
FY17E
FY16E
FY17E
FY16E
FY17E
FY16E
FY17E
FY16E
FY17E
FY16E
FY17E
Financials
Indian Bank
Neutral
139
-
6,671
6,454
7,321
2.5
2.6
26.4
33.3
5.3
4.2
0.5
0.4
8.1
9.6
-
-
LIC Housing Finance
Accumulate
495
553
24,966
2,934
3,511
2.3
2.3
30.9
36.8
16.0
13.4
2.6
2.2
16.8
17.5
-
-
Oriental Bank
Neutral
170
-
5,085
7,930
8,852
2.5
2.5
51.8
57.1
3.3
3.0
0.4
0.3
9.3
9.5
-
-
Punjab Natl.Bank
Neutral
139
-
25,815
24,160
27,777
2.9
3.0
18.5
24.6
7.5
5.7
0.7
0.6
8.8
10.8
-
-
South Ind.Bank
Neutral
23
-
3,119
1,999
2,249
2.4
2.4
3.5
4.0
6.7
5.8
0.8
0.8
12.6
13.1
-
-
St Bk of India
Accumulate
264
297
199,370
86,900
100,550
3.1
3.1
22.1
27.7
12.0
9.5
1.5
1.3
12.7
14.3
-
-
Union Bank
Neutral
159
-
10,134
12,995
14,782
2.4
2.4
32.3
40.9
4.9
3.9
0.6
0.5
10.7
12.3
-
-
Vijaya Bank
Neutral
40
-
3,462
3,474
3,932
1.8
1.9
5.9
7.2
6.9
5.6
0.6
0.5
8.1
9.3
-
-
Yes Bank
Buy
809
1,006
33,810
7,006
8,825
3.1
3.3
61.4
77.1
13.2
10.5
2.5
2.1
20.1
21.3
-
-
FMCG
Asian Paints
Neutral
847
-
81,268
16,553
19,160
16.0
16.2
17.7
21.5
47.9
39.4
12.7
11.5
29.4
31.2
4.7
4.1
Britannia
Neutral
2,898
-
34,770
8,065
9,395
9.6
10.2
47.2
65.5
61.4
44.3
20.4
19.3
38.3
41.2
4.2
3.6
Colgate
Neutral
2,058
-
27,989
4,836
5,490
19.5
19.7
48.5
53.2
42.4
38.7
31.1
27.1
99.8
97.5
5.7
5.0
Dabur India
Neutral
297
-
52,107
9,370
10,265
17.1
17.2
7.3
8.1
40.4
36.6
12.2
9.9
33.7
30.6
5.5
5.0
GlaxoSmith Con*
Neutral
6,228
-
26,193
4,919
5,742
17.2
17.4
168.3
191.2
37.0
32.6
10.5
8.9
28.8
28.9
4.9
4.1
Godrej Consumer
Neutral
1,226
-
41,749
10,168
12,886
16.1
16.1
32.1
38.4
38.2
31.9
7.8
7.2
19.7
21.0
4.2
3.3
HUL
Neutral
907
-
196,236
34,940
38,957
17.5
17.7
20.8
24.7
43.6
36.7
48.5
38.8
110.5
114.2
5.4
4.8
ITC
Buy
314
409
252,028
41,068
45,068
37.8
37.4
13.9
15.9
22.6
19.8
7.6
6.7
34.1
33.8
5.8
5.2
Marico
Neutral
434
-
28,026
6,551
7,766
15.7
16.0
10.4
12.5
41.9
34.8
12.2
10.1
33.2
32.4
4.2
3.5
Nestle*
Accumulate
6,026
6,646
58,099
11,291
12,847
22.2
22.3
158.9
184.6
37.9
32.6
19.8
17.8
55.0
57.3
5.0
4.3
Tata Global
Buy
141
186
8,879
8,735
9,182
9.8
9.9
8.5
9.3
16.6
15.1
2.2
2.1
7.9
8.1
1.0
0.9
IT
HCL Tech^
Buy
954
1,100
134,172
41,535
46,519
24.0
23.4
56.6
61.1
16.9
15.6
3.5
2.8
20.8
17.7
3.1
2.7
Infosys
Buy
1,089
1,306
250,218
60,250
66,999
28.0
28.0
58.3
63.7
18.7
17.1
3.9
3.4
20.9
19.7
3.5
3.0
TCS
Buy
2,504
3,168
490,417
108,420
123,559
28.8
28.7
127.2
143.9
19.7
17.4
7.9
7.3
39.9
41.8
4.1
3.6
Tech Mahindra
Buy
511
646
49,134
27,281
31,373
17.3
18.4
30.8
38.0
16.6
13.4
3.4
2.8
20.3
20.9
1.6
1.3
Wipro
Buy
566
753
139,883
54,050
61,617
23.7
23.8
39.4
44.1
14.4
12.8
2.9
2.6
19.9
18.8
2.2
1.8
Media
D B Corp
Accumulate
318
356
5,839
2,241
2,495
27.8
27.9
21.8
25.6
14.6
12.4
3.8
3.4
26.7
28.5
2.5
2.3
HT Media
Buy
89
129
2,066
2,495
2,703
13.5
13.6
9.4
10.7
9.4
8.3
1.0
0.9
10.4
10.6
0.4
0.2
Jagran Prakashan
Buy
135
156
4,402
1,939
2,122
26.0
26.0
8.3
9.2
16.2
14.6
2.8
2.5
17.5
17.1
2.2
2.0
Sun TV Network
Neutral
280
-
11,021
2,779
3,196
70.2
70.5
22.8
27.3
12.3
10.2
3.0
2.7
26.7
28.3
3.7
3.2
Market Outlook
July 27, 2015
Stock Watch
Company Name
Reco
CMP
Target
Mkt Cap
Sales ( Čcr )
OPM(%)
EPS (Č)
PER(x)
P/BV(x)
RoE(%)
EV/Sales(x)
(Č)
Price ( Č)
( Č cr )
FY16E FY17E
FY16E
FY17E
FY16E
FY17E
FY16E
FY17E
FY16E
FY17E
FY16E
FY17E
FY16E
FY17E
Media
Hindustan Media
Buy
244
292
1,790
920
1,031
20.0
20.0
19.2
20.9
12.7
11.7
2.1
1.8
16.4
15.3
1.5
1.3
Ventures
Metals & Mining
Coal India
Accumulate
426
450
269,014
77,595
89,628
22.9
24.4
27.6
30.0
15.4
14.2
6.7
6.7
33.9
33.2
2.8
2.4
Hind. Zinc
Neutral
164
-
69,274
15,546
16,821
47.5
49.0
19.7
20.3
8.3
8.1
1.4
1.2
17.2
16.6
2.2
1.7
Hindalco
Neutral
109
-
22,519
112,328
119,817
7.7
7.9
16.3
20.1
6.7
5.4
0.5
0.5
8.0
8.5
0.7
0.6
JSW Steel
Neutral
845
-
20,427
48,125
53,595
18.8
21.0
46.9
97.5
18.0
8.7
0.9
0.8
4.4
9.5
1.2
1.1
NMDC
Neutral
114
-
45,118
12,544
13,330
59.5
59.7
16.3
16.5
7.0
6.9
1.2
1.2
5.1
9.9
2.3
2.3
SAIL
Neutral
58
-
23,975
56,365
63,383
6.9
8.0
7.1
8.2
8.2
7.1
0.5
0.5
7.0
7.1
1.0
0.9
Vedanta
Neutral
132
-
39,267
81,842
88,430
30.6
32.8
20.2
25.7
6.6
5.2
0.5
0.4
7.5
8.5
0.9
0.6
Tata Steel
Neutral
265
-
25,747
136,805
149,228
11.3
11.9
26.4
36.8
10.0
7.2
0.8
0.7
6.0
8.0
0.7
0.7
Oil & Gas
Cairn India
Neutral
175
-
32,791
12,617
14,513
33.7
40.0
25.5
27.7
6.9
6.3
0.5
0.5
7.4
7.7
1.3
1.0
GAIL
Neutral
361
-
45,798
75,595
85,554
8.6
8.0
31.8
36.1
11.3
10.0
1.2
1.2
10.7
11.4
0.7
0.6
ONGC
Neutral
283
-
242,163
174,773
192,517
22.7
24.8
34.6
38.2
8.2
7.4
1.2
1.1
14.2
14.9
1.5
1.3
Petronet LNG
Neutral
196
-
14,708
45,759
49,386
3.7
4.0
12.6
14.9
15.6
13.2
2.4
2.1
16.1
16.7
0.4
0.3
Reliance Industries
Accumulate
1,025
1,100
331,880
339,083
384,014
7.8
9.5
75.7
94.5
13.6
10.9
1.3
1.3
10.7
12.2
1.3
1.2
Pharmaceuticals
Alembic Pharma
Neutral
751
-
14,158
2,405
2,859
19.9
20.4
17.7
22.0
42.4
34.1
12.2
9.3
32.6
30.9
5.9
4.9
Aurobindo Pharma
Accumulate
735
824
42,918
14,435
16,600
22.6
22.6
36.1
41.2
20.4
17.8
6.1
4.6
34.5
29.3
3.3
2.8
Aventis*
Neutral
3,736
-
8,603
2,156
2,455
15.1
16.8
109.7
133.9
34.1
27.9
4.7
3.8
18.4
22.5
3.7
3.1
Cadila Healthcare
Neutral
1,915
-
39,201
10,224
11,840
19.7
20.0
69.8
81.0
27.4
23.6
7.3
5.8
26.8
25.3
3.9
3.3
Cipla
Neutral
678
-
54,475
14,051
16,515
18.9
18.7
25.1
28.9
27.0
23.5
4.3
3.7
17.2
16.9
3.9
3.2
Dr Reddy's
Neutral
3,907
-
66,605
17,443
20,296
22.3
22.4
156.7
180.1
24.9
21.7
5.0
4.1
21.8
20.8
3.8
3.2
Dishman Pharma
Buy
178
250
1,438
1,716
1,888
20.2
20.2
16.3
21.6
10.9
8.3
1.0
0.9
9.7
11.7
1.0
0.8
GSK Pharma*
Neutral
3,390
-
28,711
2,818
3,044
18.9
18.9
56.2
58.6
60.3
57.8
17.1
18.5
27.1
30.7
9.7
9.1
Indoco Remedies
Neutral
363
-
3,346
1,088
1,262
18.2
18.2
13.1
15.5
27.7
23.4
5.4
4.5
21.2
21.1
3.1
2.7
Ipca labs
Accumulate
690
736
8,710
3,533
4,109
18.6
19.6
28.2
34.8
24.5
19.8
3.4
2.9
15.0
15.9
2.7
2.3
Lupin
Neutral
1,672
-
75,221
14,864
17,244
26.9
26.9
62.1
71.1
26.9
23.5
6.5
5.2
27.4
24.6
4.8
4.0
Sun Pharma
Accumulate
836
950
201,112
27,839
33,542
27.7
29.7
18.9
26.9
44.2
31.1
4.0
3.5
13.0
14.6
6.6
5.2
Power
Tata Power
Neutral
72
-
19,419
38,302
38,404
14.1
13.1
5.1
6.0
14.0
12.0
1.3
1.3
9.2
10.3
1.4
1.4
NTPC
Neutral
138
-
113,375
89,067
98,329
15.9
16.5
12.1
13.1
11.4
10.5
1.3
1.2
11.0
11.6
2.3
2.3
Power Grid
Buy
142
170
74,289
19,986
22,702
86.2
86.3
11.1
12.7
12.8
11.2
1.7
1.6
14.4
14.7
8.9
8.2
Market Outlook
July 27, 2015
Stock Watch
Company Name
Reco
CMP
Target
Mkt Cap
Sales ( Čcr )
OPM(%)
EPS (Č)
PER(x)
P/BV(x)
RoE(%)
EV/Sales(x)
(Č)
Price ( Č)
( Č cr )
FY16E FY17E
FY16E
FY17E
FY16E
FY17E
FY16E
FY17E
FY16E
FY17E
FY16E
FY17E
FY16E
FY17E
Telecom
Bharti Airtel
Neutral
434
-
173,587
101,748
109,191
32.1
31.7
12.0
12.5
36.2
34.7
2.5
2.3
6.9
6.7
2.3
2.1
Idea Cellular
Neutral
179
-
64,273
34,282
36,941
32.0
31.5
5.9
6.2
30.3
28.8
2.8
2.5
9.9
9.3
2.5
2.3
zOthers
Abbott India
Neutral
4,245
-
9,020
2,713
3,141
13.7
13.5
127.8
145.7
33.2
29.1
7.8
6.3
25.9
23.9
3.0
2.6
Bajaj Electricals
Buy
277
341
2,789
4,719
5,287
5.2
5.8
8.6
12.7
32.3
21.9
3.7
3.2
11.4
14.8
0.6
0.5
Finolex Cables
Neutral
265
-
4,049
2,728
3,036
10.8
11.0
14.4
16.8
18.4
15.8
2.8
2.4
15.2
15.3
1.2
1.0
Goodyear India*
Neutral
573
-
1,321
1,536
1,683
9.6
10.0
41.8
48.0
13.7
11.9
2.3
2.0
18.2
18.3
0.6
0.5
Hitachi
Neutral
1,518
-
4,127
1,801
2,051
8.9
9.3
31.0
38.8
48.9
39.1
10.5
8.4
23.9
23.8
2.3
2.0
Jyothy Laboratories
Neutral
313
-
5,662
1,620
1,847
11.5
11.5
7.3
8.5
42.9
36.9
5.5
5.1
13.3
14.4
3.4
2.9
MRF
Accumulate
38,528
43,439
16,340
13,524
14,440
18.6
18.2
2,999.2
3,102.8
12.9
12.4
2.8
2.3
24.7
20.5
1.2
1.0
Page Industries
Neutral
14,641
-
16,330
1,929
2,450
19.8
20.1
229.9
299.0
63.7
49.0
28.1
19.5
52.1
47.1
8.5
6.7
Relaxo Footwears
Neutral
569
-
6,830
1,767
2,152
12.3
12.5
19.3
25.1
29.6
22.7
7.3
5.6
27.7
27.8
3.9
3.2
Siyaram Silk Mills
Neutral
1,218
-
1,142
1,653
1,873
11.7
12.2
99.3
122.1
12.3
10.0
2.2
1.9
19.5
20.2
0.9
0.7
Styrolution ABS India*
Neutral
723
-
1,271
1,271
1,440
8.6
9.2
32.0
41.1
22.6
17.6
2.3
2.1
10.7
12.4
1.0
0.8
Tree House
Neutral
425
-
1,798
259
324
56.8
56.8
17.0
21.7
25.0
19.6
2.5
2.3
10.1
11.5
6.9
5.6
TVS Srichakra
Neutral
2,417
-
1,850
2,112
2,389
11.9
12.1
168.5
202.5
14.3
11.9
4.9
3.7
39.6
35.5
1.0
0.8
HSIL
Buy
339
434
2,449
2,085
2,436
18.5
18.6
21.7
28.9
15.7
11.7
1.6
1.4
10.0
12.1
1.3
1.0
Kirloskar Engines India
Accumulate
283
298
4,097
2,779
3,314
10.3
11.9
12.0
17.5
23.7
16.2
2.9
2.6
12.5
16.7
1.1
0.9
Ltd
M M Forgings
Buy
669
783
807
586
671
22.3
22.9
53.4
65.2
12.5
10.3
2.7
2.2
24.1
23.5
1.5
1.3
Banco Products (India)
Neutral
112
-
804
1,196
1,370
9.7
11.8
9.4
14.3
12.0
7.9
1.2
1.1
10.4
14.5
0.6
0.6
Competent Automobiles Neutral
156
-
96
1,007
1,114
3.1
3.1
23.7
28.2
6.6
5.5
0.9
0.8
13.9
14.6
0.1
0.1
Nilkamal
Neutral
818
-
1,220
1,947
2,131
8.1
8.3
35.7
45.9
22.9
17.8
2.3
2.0
10.3
12.1
0.7
0.6
Visaka Industries
Buy
143
166
228
1,158
1,272
8.6
9.5
23.7
32.7
6.1
4.4
0.6
0.6
10.1
12.5
0.4
0.3
Transport Corporation of
Accumulate
263
293
1,989
2,830
3,350
8.8
9.0
14.4
18.3
18.3
14.4
2.8
2.5
15.4
17.1
0.8
0.7
India
Elecon Engineering
Neutral
87
-
952
1,452
1,596
13.7
14.7
4.2
6.2
21.1
14.0
1.7
1.5
8.1
11.2
1.0
0.8
Surya Roshni
Accumulate
139
152
610
2,992
3,223
8.4
8.7
15.2
19.3
9.2
7.2
0.9
0.8
10.1
11.5
0.5
0.5
MT Educare
Buy
112
141
447
275
355
18.3
17.3
7.4
8.8
15.2
12.7
3.1
2.7
20.2
21.1
1.5
1.2
Radico Khaitan
Buy
92
112
1,222
1,565
1,687
11.9
12.4
5.4
6.6
17.0
13.9
1.4
1.3
8.0
9.0
1.3
1.2
Garware Wall Ropes
Neutral
302
-
661
875
983
10.4
10.5
23.1
27.5
13.1
11.0
1.9
1.6
14.1
14.6
0.8
0.6
Source: Company, Angel Research; Note: *December year end; #September year end; &October year end; Price as on July 24, 2015
Market Outlook
July 27, 2015
Research Team Tel: 022 - 39357800
DISCLAIMER
Angel Broking Private Limited (hereinafter referred to as “Angel”) is a registered Member of National Stock Exchange of India Limited,
Bombay Stock Exchange Limited and MCX Stock Exchange Limited. It is also registered as a Depository Participant with CDSL and
Portfolio Manager with SEBI. It also has registration with AMFI as a Mutual Fund Distributor. Angel Broking Private Limited is a registered
entity with SEBI for Research Analyst in terms of SEBI (Research Analyst) Regulations, 2014 vide registration number INH000000164.
Angel or its associates has not been debarred/ suspended by SEBI or any other regulatory authority for accessing /dealing in securities
Market. Angel or its associates including its relatives/analyst do not hold any financial interest/beneficial ownership of more than 1% in
the company covered by Analyst. Angel or its associates/analyst has not received any compensation / managed or co-managed public
offering of securities of the company covered by Analyst during the past twelve months. Angel/analyst has not served as an officer,
director or employee of company covered by Analyst and has not been engaged in market making activity of the company covered by
Analyst.
This document is solely for the personal information of the recipient, and must not be singularly used as the basis of any investment
decision. Nothing in this document should be construed as investment or financial advice. Each recipient of this document should make
such investigations as they deem necessary to arrive at an independent evaluation of an investment in the securities of the companies
referred to in this document (including the merits and risks involved), and should consult their own advisors to determine the merits and
risks of such an investment.
Reports based on technical and derivative analysis center on studying charts of a stock's price movement, outstanding positions and
trading volume, as opposed to focusing on a company's fundamentals and, as such, may not match with a report on a company's
fundamentals.
The information in this document has been printed on the basis of publicly available information, internal data and other reliable sources
believed to be true, but we do not represent that it is accurate or complete and it should not be relied on as such, as this document is for
general guidance only. Angel Broking Pvt. Limited or any of its affiliates/ group companies shall not be in any way responsible for any
loss or damage that may arise to any person from any inadvertent error in the information contained in this report. Angel Broking Pvt.
Limited has not independently verified all the information contained within this document. Accordingly, we cannot testify, nor make any
representation or warranty, express or implied, to the accuracy, contents or data contained within this document. While Angel Broking
Pvt. Limited endeavors to update on a reasonable basis the information discussed in this material, there may be regulatory, compliance,
or other reasons that prevent us from doing so.
This document is being supplied to you solely for your information, and its contents, information or data may not be reproduced,
redistributed or passed on, directly or indirectly.
Neither Angel Broking Pvt. Limited, nor its directors, employees or affiliates shall be liable for any loss or damage that may arise from or
in connection with the use of this information.
Note: Please refer to the important ‘Stock Holding Disclosure' report on the Angel website (Research Section). Also, please refer to the
latest update on respective stocks for the disclosure status in respect of those stocks. Angel Broking Pvt. Limited and its affiliates may have
investment positions in the stocks recommended in this report.