Market Outlook
June 27, 2016
Market Cues
Domestic Indices
Chg (%)
(Pts)
(Close)
Indian markets are expected to open on a Negative note tracing Global cues.
BSE Sensex
(2.2)
(605)
26,398
Nifty
(2.2)
(182)
8,089
US markets closed Friday’s trading session on a negative note as shockwaves from
the U.K.'s s surprise vote to leave the European Union (BREXIT) swept across global
Mid Cap
(1.1)
(123)
11,313
markets.
Small Cap
(1.5)
(168)
11,279
Bankex
(2.7)
(549)
19,911
European shares plunged on Friday on account of Britain’s exit from the EU as the
traders swiftly moved towards safe havens. Participants were expecting Britain to
remain as an EU member and the vote came as a major surprise.
Global Indices
Chg (%)
(Pts)
(Close)
Indian markets were first to witness the negative reaction of BREXIT as the vote tally,
Dow Jones
(3.4)
(610)
17,401
which was in its last stages, indicated that BREXIT was inevitable. The markets
Nasdaq
(4.1)
(202)
4,708
recovered from its lows after the Finance Minister and the RBI Governor addressed
FTSE
(3.1)
(199)
6,139
that India’s sound fundamentals and reforms would enable the country to deal with
Nikkei
(7.9)
(1,286)
14,952
any fallout from the BREXIT.
Hang Seng
(2.9)
(609)
20,259
News Analysis
Shanghai Com
(1.3)
(38)
2,854
BREXIT’s Impact on UK and EU
Detailed analysis on Pg2
Advances / Declines
BSE
NSE
Investor’s Ready Reckoner
Advances
665
337
Declines
1,874
1,241
Key Domestic & Global Indicators
Unchanged
157
52
Stock Watch: Latest investment recommendations on 150+ stocks
Refer Pg5 onwards
Volumes (` Cr)
Top Picks
BSE
3,968
CMP
Target
Upside
Company
Sector
Rating
(`)
(`)
(%)
NSE
24,652
Amara Raja
Auto/Auto Ancillary
Buy
849
1,076
26.7
HCL Tech
IT
Buy
742
1,000
34.8
Net Inflows (` Cr)
Net
Mtd
Ytd
LIC Housing
Financials
Buy
478
592
23.9
FII
228
4,410
18,778
Bharat Electronics
Capital Goods
Accumulate
1,248
1,414
13.3
MFs
298
633
10,064
Navkar Corporation Others
Buy
203
265
30.5
More Top Picks on Pg4
Top Gainers
Price (`)
Chg (%)
Key Upcoming Events
Mfsl
535
5.4
Previous
Consensus
Date
Region
Event Description
Reading
Expectations
Natcopharm
575
4.5
June 28 US
Cosumer Confidence
92.6
93.1
Muthootfin
282
4.3
June 28 US
GDP QoQ (Annualised)
0.8
1.0
Manappuram
66
3.9
June 29 US
Initial Jobless claims
259.0
--
Kajariacer
1,195
3.9
June 30 UK
PMI Manufacturing
50.1
--
6.(
More Events on Pg5
Top Losers
Price (`)
Chg (%)
Mothersumi
276
(8.5)
Tatamotors
449
(8.0)
Jpassociat
7
(7.6)
Vedl
118
(6.8)
Ibrealest
86
(6.6)
As on June 24, 2016
Market Outlook
June 27, 2016
BREXIT’s Impact on UK and EU
People of UK have voiced their opinion and voted for exit from the European
Union. This move comes despite of warning shots fired by various organizations
like the IMF and OECD about the repercussions of such move. Needless to say, the
move leaves UK, European and the Global economy in a vulnerable position and
will have a significant impact. In its earlier outlook for Britain, the IMF had cut its
forecast for economic growth this year from 2.2% to 1.9%. OECD too had lowered
its forecast for UK GDP to 1.75% in 2016 from 2.1% and indicated that the growth
would lower to 1.5% in case the result of the referendum is a vote to leave.
How does it Impact UK and Europe?
Trade: EU membership provides an open access to the single market in the
Europe. By exiting the EU, Britain has two year period to negotiate trade terms with
EU members as well as other European countries and the countries that have an
existing trading relations with the EU. The move means that UK will lose its exports
to the EU which currently account to ~45% of its total Exports. Although the
BREXITTERs feel that they have an upper hand in negotiating trading terms, this
move will make it easier said than done. The negotiations are estimated to last
longer than the two year period as the EU would like to send a message to other
Member nations to deter such moves in the future.
The exit will bring in tariffs that will make the cost of goods more expensive for its
citizens in the UK and also make goods ands and services from UK uncompetitive.
Higher tariffs by EU will result in tit for tat move by UK which will impact EU exports
to the UK. Even if UK were to be able to negotiate trade terms that are similar to
that of Norway and Switzerland, as per analysis by the Centre for Economic
Performance, the sum of the static and dynamic trade losses would be almost
2.2% of GDP for UK. The Center had estimated that in an pessimistic scenario,
there would be income falls of 6.3% to 9.5% of GDP.
Employment: UK was seen as a gateway to the EU and has housed several MNC
headquarters which created jobs in the country. As per media sources, nearly 3mn
jobs in the UK are linked to trade with the EU and many financial institutions and
manufacturing companies will likely move their offices from London to EU as a
result of barriers. This will cause an increase in unemployment in UK to some
extend as it will be able to add some jobs back owing to higher spends arising
from savings from contribution to the EU budget.
How does it Impact India?
Though India’s trade with UK is only limited to ~3.4% of exports and ~5.2% of
imports, EU is a significant trade partner for Indian and accounted for ~13.5% of
the exports and ~11.6% of the imports. The UK and EU economy which was
already under pressure might see further slowdown in trading activities which will
impact the Indian exporters. In FY16 Indian exports to UK stood at $8.83bn while
imports were to the tune of $5.19bn. Textiles and Auto components have
increased their exports to the EU in the last few years and slow down in the EU
zone including UK might result in no fresh capex by the companies back home.
Market Outlook
June 27, 2016
Sector wise Impact
Pharmaceuticals: The Brexit will have some short term impact on the currency
markets more profoundly and hence will be reflected in the financials of the
pharmaceuticals companies. Besides currency market, the impact of UK removing
from EU, should not have major impact on the financials, as UK standalone is not
a very big market for the Indian Pharma Industry. UK Pharma Industry is
estimated to reach US$ 27-37bn market by 2018, a 4-7% CAGR growth of 2014-
18. The company’s exposure to the EU under our overage is lower except for
Aurobindo Pharmaceuticals and IPCA Labs (where it’s around 25% of sales). Thus
these companies are more exposed to volatility arising out of the development,
both in currency terms and possible some impact on the approvals in the region
(especially UK), though fundamentally the UK pharmaceutical market should not
see major change. Currently we are not changing our estimates and maintain our
buy on Aurobindo Pharma, IPCA Labs, Sun Pharma and Lupin.
IT Services: The BREXIT, will have some short term impact on the currency markets
more profoundly and hence will be reflected in the financials of the IT Service
companies. Besides currency market, the impact of UK removing from EU, should
not have major impact on the financials, as UK standalone is not a very big
market for the Indian IT Industry. Moreover on a macro view, about 3.5% of
India’s exports are to the UK, and 1.5% of total imports are from the UK; thus,
Brexit is not likely to have a significant impact on India’s trade. Thus, while many IT
companies have around 20% of their sales to the EU region, we believe the move
will unlikely to impact the business prospects of the Industry and the only near term
impact could be on back of the currency movements. The EU currency exposure of
our IT coverage is Wipro (~ 8%), Tech Mahindra (11.3%), Infosys (9%), and TCS
(8%). Currently we are not factoring any changes in our estimates and hence our
Top picks remain TCS, Infosys and HCL Tech.
Capital Goods: We expect Capital-Goods companies which either derive their
business or have exposure (through subsidiaries and JV agreements) to European
continent to be affected on account of the ‘BREXIT’. Companies like Crompton, VA
Tech Wabag, Elecon, Thermax, Centum Electronics (derive 10-40% of the revenues
from European operations), which have European subsidiaries, of JV
arrangements could see slow-down in their European operations, thereby
restricting their consol. entity’s growth prospects. Further, companies like ABB
India, Siemens, Alstom (derive less than 10% of total revenues), which do exports
to European Sub-continent could see adverse impact of ‘BREXIT’. Lastly, companies
like Inox Wind which have 40% of their raw materials imported from International
markets (mainly from Europe) should see impact of currency movement on their
financials, going forward. On a whole, the BREXIT development is negative for the
broader Capital Goods sector, as one key market could see sharp slow-down and
accordingly restrict the growth prospects of some of the key Indian players.
Currently we are not factoring any changes in to our estimates and hence maintain
BUY rating on Wabag, Inox, Voltas and Blue Star.
Metals: Tata Steel exports ~30% of its UK’s production to the European Union and
change in tariff structure could impact the sales volume going ahead. Commodity
prices also are likely to be under pressure in the near term and this would put
further pressure on the valuations of the assets when Tata Steel wants to exit its UK
operations. Silver prices have started rising and this could be beneficial to
Hindustan Zinc. However, further Zinc and Lead which has direct co relation to the
Market Outlook
June 27, 2016
industrial and automotive industry could see pricing pressure in the near term.
Overall we believe the impact on the Indian metal companies to be negative.
Auto & Auto Components: Indian Auto OEMs except Tata Motors don’t get
impacted directly due to BREXIT. However, among the OEMs Tata Motors would
have one of the highest negative impacts among the Indian corporate. Its UK
subsidiary JLR had earlier indicated that it may lose an estimated 1 billion Pound
by 2020 if Britain Exits EU. Exit from EU would result in 10% levy on exports to EU
and on other hand 4% import duty on the components for manufacturing of Auto.
JLR derives ~24% of its volumes from EU while sources ~35% of components
imports. Bharat Forge derives ~64% of the revenues from exports with 39% of the
revenues coming from EU and 23% from USA. The commercial vehicle market and
High end passenger vehicle market in EU has seen some recovery in the recent
quarters. But now can see pressure on growth with likely hood contagion effect of
the BREXIT. We have NEUTRAL Rating on Tata Motors and BUY rating on Bharat
Forge.
Banks: ICICI Bank has one of the highest exposure to Europe via UK amongst the
Indian banks. The Banks overseas exposure is much higher than other pvt sector
banks with ~21% of the loans book comprising of international markets. However,
the bank of late has been not in an expansion mode in the overseas operations.
Though early to quantify the banks UK business is likely to see some impact in the
near term. Among other banks Bank of India and Bank of Baroda has meaningful
overseas operations. We maintain ACCUMULATE rating on ICICI Bank and
NEUTRAL on BoB and BoI.
Economic and Political News
Ban on import of milk items from China extended till June 2017
GST coming in 6-8 months, J&K must participate: Arun Jaitley
SIDBI targets `1,80,000cr disbursal under Mudra ecosystem
Corporate News
Vijaya Bank gets shareholders' nod to raise `900cr
Essar Group company sells entire stake in Kenya Petroleum Refineries
Brexit spells trouble for Tatas, IT giants
Suzlon commissions 4.2 MW wind project in Gujarat
Aban's subsidiary bags order worth `592cr from ONGC
Market Outlook
June 27, 2016
Top Picks ★★★★★
Large Cap
Market Cap
CMP
Target
Upside
Company
Rationale
(` Cr)
(`)
(`)
(%)
To outpace battery industry growth due to better technological
Amara Raja Batteries
14,507
849
1,076
26.7
products leading to market share gains in both the automotive
OEM and replacement segments.
Uptick in defense capex by government, coupled with BELs
Bharat Electronics
29,957
1,248
1,414
13.3
strong market positioning, indicate good times ahead for BEL.
HCL Tech
1,04,671
742
1,000
34.8
Stock is trading at attractive valuations & factors all bad news.
Strong visibility for a robust 20% earnings trajectory, coupled
HDFC Bank
2,94,125
1,162
1,262
8.6
with high quality of earnings on account of high quality retail
business and strategic focus on highly rated corporates.
Back on the growth trend, expect a long term growth of 14% to
Infosys
2,74,370
1,195
1,374
15.0
be a US$20bn in FY2020.
Continues to grow its retail loan book at healthy pace with
LIC Housing Finance
24,108
478
592
23.9
improvement in asset quality. Expect LICHF to post a healthy
loan book which is likely to reflect in a strong earnings growth.
Huge bid pipeline of re-development works at Delhi and other
NBCC
11,151
186
220
18.4
State Governments and opportunity from Smart City, positions
NBCC to report strong growth, going forward.
Strong market positioning within the domestic AC markets to
Voltas
10,236
309
407
31.6
continue, EMP business set to revive
Source: Company, Angel Research
Mid Cap
Market Cap
CMP
Target
Upside
Company
Rationale
(` Cr)
(`)
(`)
(%)
Among the top 4 players in the consumer durables segment.
Bajaj Electricals
2,245
222
268
20.6
Improved profitability backed by turn around in E&P segment.
Strong order book lends earnings visibility.
Favourable outlook for AC industry to augur well for Cooling
Blue Star
3,773
419
495
18.0
products business. EMPPAC division's profitability to improve
once operating environment turns around.
With a focus on the low and medium income (LMI) consumer
Dewan Housing
5,686
195
270
38.6
segment, the company has increased its presence in tier-II & III
cities where the growth opportunity is immense.
Strong loan growth backed by diversified loan portfolio and
Equitas Holdings
5,864
175
235
34.4
adequate CAR. ROE & ROA likely to remain decent as risk of
dilution remains low. Attractive valuations considering growth.
Commencement of new projects, downtrend in the interest rate
IL&FS Transport
2,395
73
93
27.7
cycle, to lead to stock re-rating
Economic recovery to have favourable impact on advertising &
circulation revenue growth. Further, the acquisition of a radio
Jagran Prakashan
5,523
169
205
21.3
business (Radio City) would also boost the company's revenue
growth.
Speedier execution and speedier sales, strong revenue visibility
Mahindra Lifespace
1,854
452
554
22.6
in short-to-long run, attractive valuations
Massive capacity expansion along with rail advantage at ICD
Navkar Corporation
2,896
203
265
30.5
as well CFS augurs well for the company
Earnings boost on back of stable material prices and
Radico Khaitan
1,199
90
125
38.7
favourable pricing environment. Valuation discount to peers
provides additional comfort
Strong brands and distribution network would boost growth
Siyaram Silk Mills
999
1,065
1,347
26.4
going ahead. Stock currently trades at an inexpensive
valuation.
Source: Company, Angel Research
Market Outlook
June 27, 2016
Key Upcoming Events
Global economic events release calendar
Bloomberg Data
Date
Time
Country
Event Description
Unit
Period
Last Reported
Estimated
Jun 28, 2016
7:30 PM
US
Consumer Confidence
S.A./ 1985=100
Jun
92.60
93.05
6:00 PM
US
GDP Qoq (Annualised)
% Change
1Q T
0.80
1.00
Jun 29, 2016
6:00 PM
US
Initial Jobless claims
Thousands
Jun 25
259.00
Jun 30, 2016
2:30 PM Euro Zone Euro-Zone Consumer Confidence
Value
Jun F
-7.30
(7.30)
1:25 PM Germany Unemployment change (000's)
Thousands
Jun
-11.00
(5.00)
2:00 PM
UK PMI Manufacturing
Value
Jun
50.10
July 01, 2016
2:00 PM
UK GDP (YoY)
% Change
1Q F
2.10
1:25 PM Germany PMI Manufacturing
Value
Jun F
54.40
54.40
6:30 AM
China PMI Manufacturing
Value
Jun
50.10
12:00 AM
Jul 05, 2016
1:25 PM Germany PMI Services
Value
Jun F
53.20
Jul 07, 2016
2:00 PM
UK Industrial Production (YoY)
% Change
May
1.60
Jul 08, 2016
India
Imports YoY%
% Change
Jun
(13.20)
India
Exports YoY%
% Change
Jun
(0.80)
6:00 PM
US
Change in Nonfarm payrolls
Thousands
Jun
38.00
190.00
6:00 PM
US
Unnemployment rate
%
Jun
4.70
4.70
Jul 10, 2016
7:00 AM
China Consumer Price Index (YoY)
% Change
Jun
2.00
Jul 12, 2016
5:30 PM
India
Industrial Production YoY
% Change
May
(0.80)
Jul 13, 2016
4:30 PM
UK BOE Announces rates
% Ratio
Jul 14
0.50
Jul 14, 2016
China Exports YoY%
% Change
Jun
(4.10)
Source: Bloomberg, Angel Research
Market Outlook
June 27, 2016
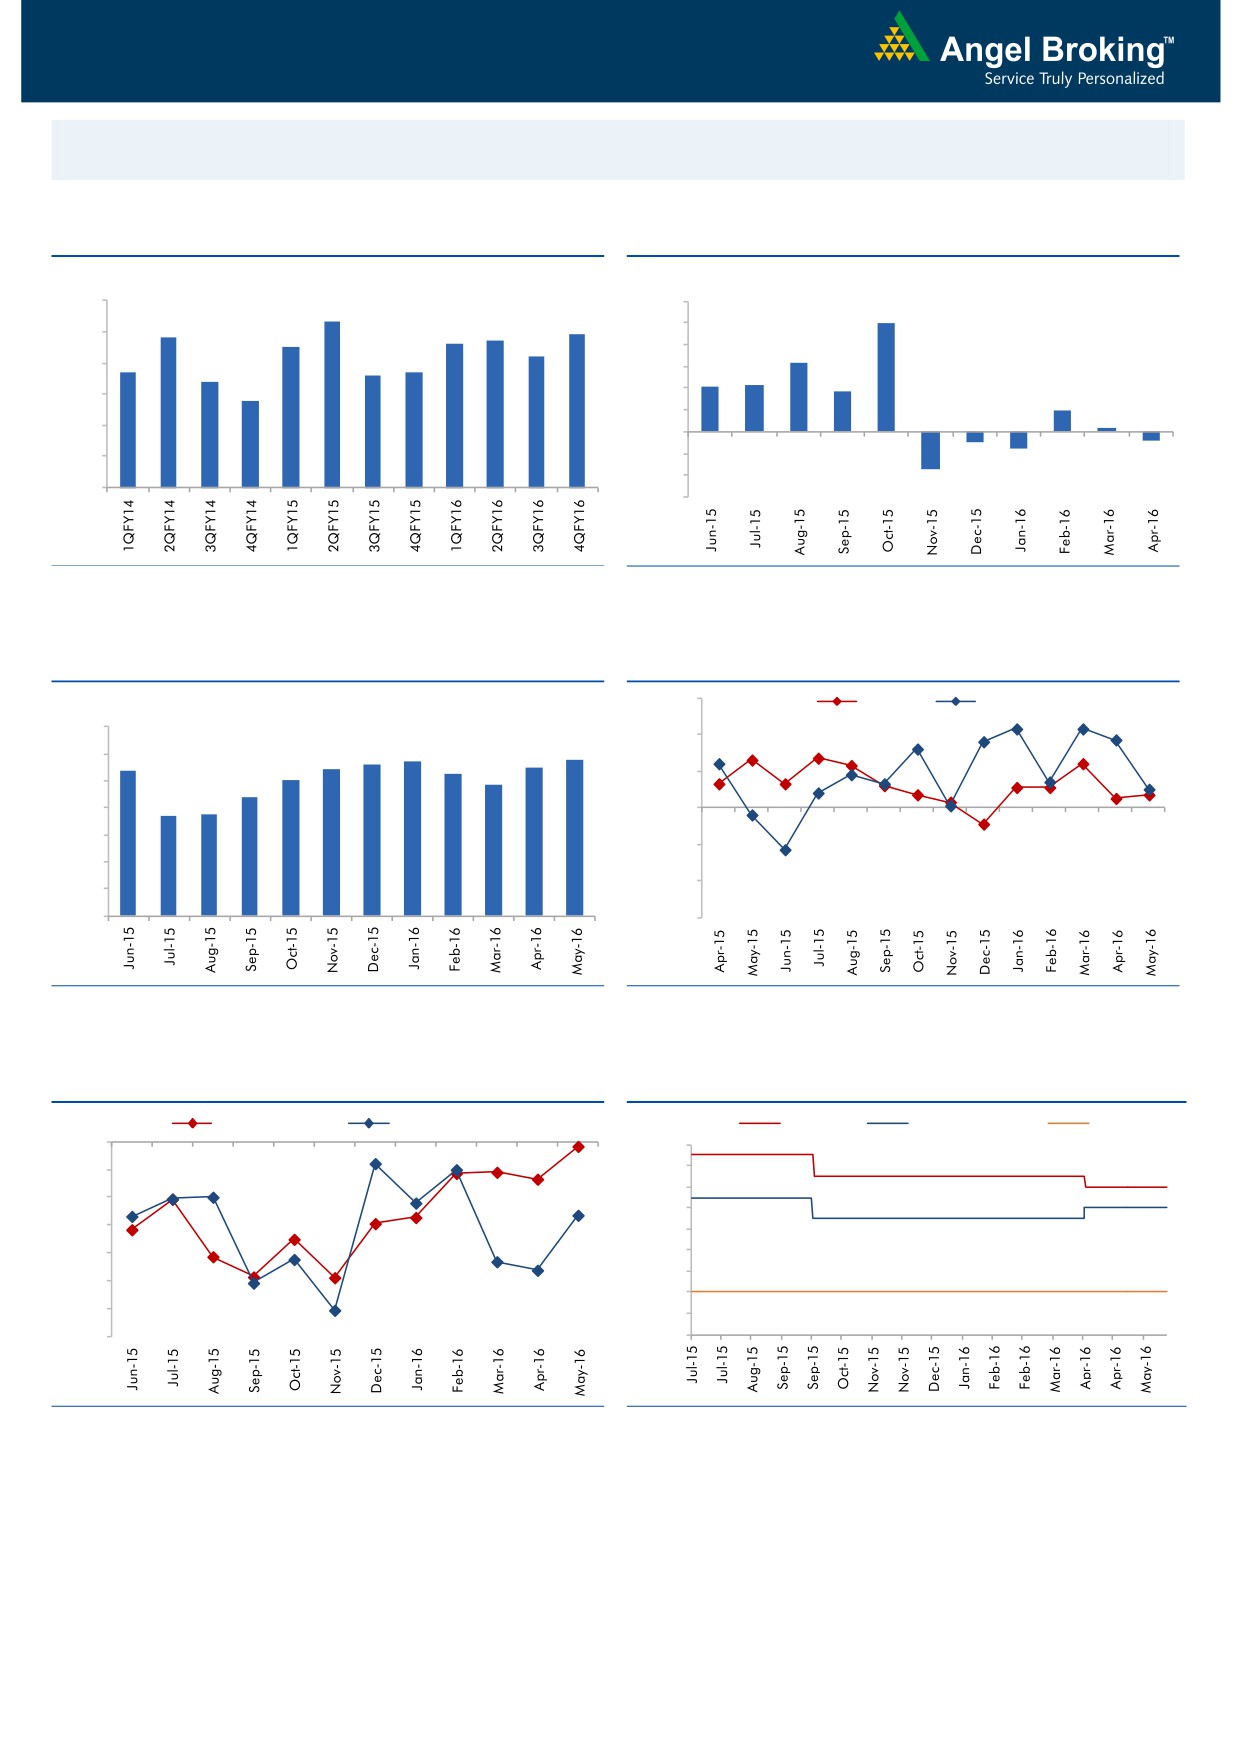
Macro watch
Exhibit 1: Quarterly GDP trends
Exhibit 2: IIP trends
(%)
(%)
9.0
12.0
8.3
9.9
7.8
7.7
7.9
10.0
8.0
7.5
7.6
7.2
8.0
6.3
6.7
6.6
6.7
7.0
6.4
6.0
4.2
4.3
3.7
5.8
4.0
6.0
2.0
2.0
0.3
5.0
-
4.0
(2.0)
(0.9)
(0.8)
(1.6)
(4.0)
3.0
(3.4)
(6.0)
Source: CSO, Angel Research
Source: MOSPI, Angel Research
Exhibit 3: Monthly CPI inflation trends
Exhibit 4: Manufacturing and services PMI
56.0
Mfg. PMI
Services PMI
(%)
7.0
54.0
5.6
5.7
5.8
5.4
5.4
5.5
6.0
5.3
5.0
4.8
52.0
5.0
4.4
3.7
3.7
4.0
50.0
3.0
48.0
2.0
46.0
1.0
-
44.0
Source: MOSPI, Angel Research
Source: Market, Angel Research; Note: Level above 50 indicates expansion
Exhibit 5: Exports and imports growth trends
Exhibit 6: Key policy rates
(%)
Exports yoy growth
Imports yoy growth
(%)
Repo rate
Reverse Repo rate
CRR
0.0
7.50
(5.0)
7.00
6.50
(10.0)
6.00
(15.0)
5.50
(20.0)
5.00
4.50
(25.0)
4.00
(30.0)
3.50
(35.0)
3.00
Source: Bloomberg, Angel Research
Source: RBI, Angel Research
Market Outlook
June 27, 2016
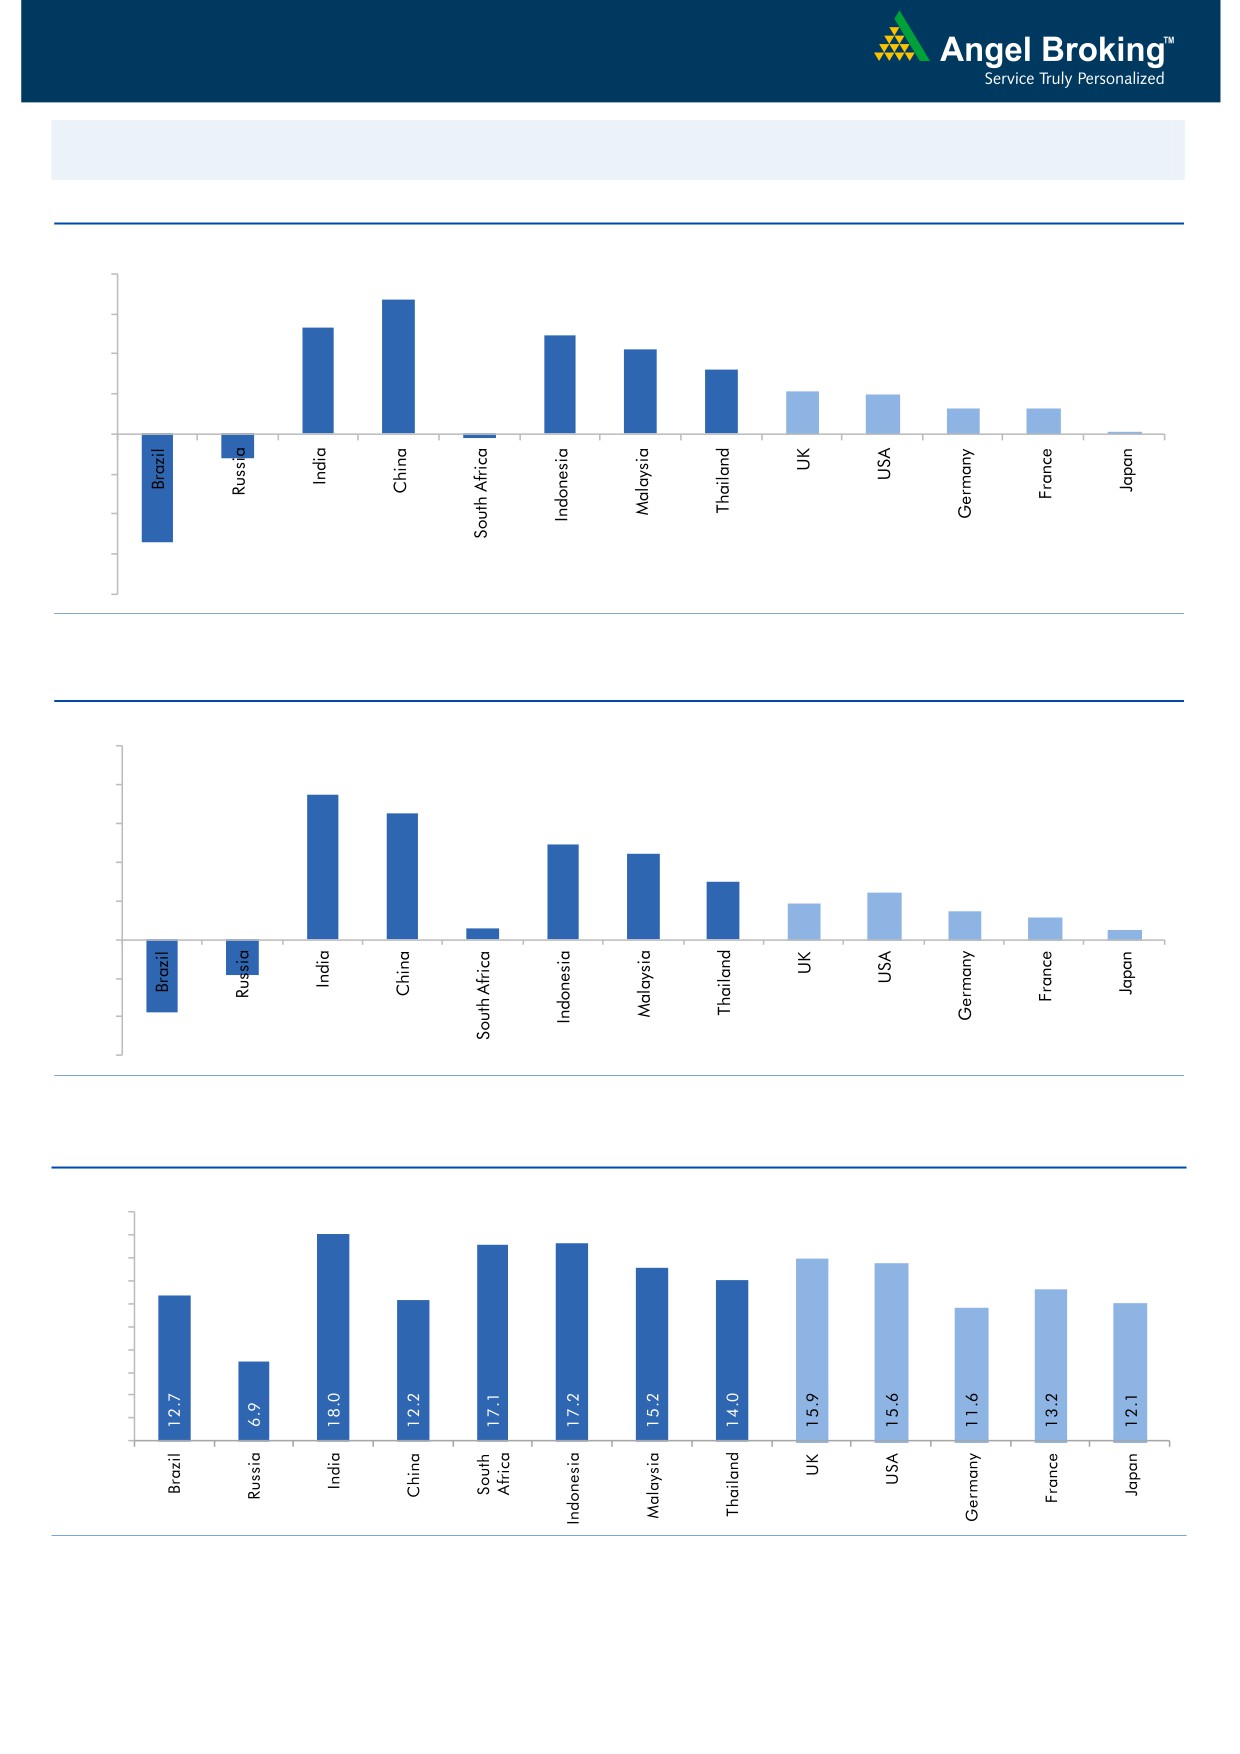
Global watch
Exhibit 1: Latest quarterly GDP Growth (%, yoy) across select developing and developed countries
(%)
8.0
6.7
6.0
5.3
4.9
4.2
4.0
3.2
2.1
2.0
2.0
1.3
1.3
0.1
-
(2.0)
(4.0)
(1.2)
(6.0)
(0.2)
(5.4)
(8.0)
Source: Bloomberg, Angel Research
Exhibit 2: 2016 GDP Growth projection by IMF (%, yoy) across select developing and developed countries
(%)
10.0
7.5
8.0
6.5
6.0
4.9
4.4
4.0
3.0
2.4
1.9
1.5
2.0
1.1
0.6
0.5
(3.8)
(1.8)
-
(2.0)
(4.0)
(6.0)
Source: IMF, Angel Research
Exhibit 3: One year forward P-E ratio across select developing and developed countries
(x)
20.0
18.0
16.0
14.0
12.0
10.0
8.0
6.0
4.0
2.0
-
Source: IMF, Angel Research
Market Outlook
June 27, 2016
Exhibit 4: Relative performance of indices across globe
Returns (%)
Country
Name of index
Closing price
1M
3M
1YR
Brazil
Bovespa
50,105
1.5
0.8
(7.6)
Russia
Micex
1,884
0.0
(1.0)
14.1
India
Nifty
8,089
1.9
5.0
(1.7)
China
Shanghai Composite
2,854
0.4
(4.8)
(43.6)
South Africa
Top 40
45,570
(3.1)
(4.7)
(3.5)
Mexico
Mexbol
44,886
(1.8)
(1.6)
(1.5)
Indonesia
LQ45
825
0.7
(2.3)
(1.2)
Malaysia
KLCI
1,634
0.5
(4.7)
(4.9)
Thailand
SET 50
893
0.1
1.1
(9.6)
USA
Dow Jones
17,401
(1.7)
(0.7)
(3.0)
UK
FTSE
6,139
(1.3)
(0.9)
(7.3)
Japan
Nikkei
14,952
(10.8)
(12.3)
(26.2)
Germany
DAX
9,557
(6.4)
(4.6)
(12.7)
France
CAC
4,107
(8.4)
(5.1)
(14.6)
Source: Bloomberg, Angel Research
Stock Watch
June 27, 2016
Company Name
Reco
CMP
Target
Mkt Cap
Sales ( Čcr )
OPM(%)
EPS (Č)
PER(x)
P/BV(x)
RoE(%)
EV/Sales(x)
(Č)
Price ( Č)
( Č cr )
FY16E FY17E
FY16E
FY17E
FY16E
FY17E
FY16E
FY17E
FY16E
FY17E
FY16E
FY17E
FY16E
FY17E
Agri / Agri Chemical
Rallis
Neutral
214
-
4,154
1,612
1,911
13.3
13.3
7.4
9.5
28.9
22.5
4.6
4.1
16.7
18.4
2.6
2.2
United Phosphorus
Accumulate
540
684
23,145
13,083
15,176
18.5
18.5
31.5
37.4
17.1
14.4
3.4
2.8
21.4
21.4
2.2
1.8
Auto & Auto Ancillary
Ashok Leyland
Neutral
96
-
27,406
17,995
21,544
11.4
11.6
3.4
4.7
28.3
20.5
5.0
4.6
17.7
22.2
1.6
1.3
Bajaj Auto
Neutral
2,679
-
77,521
22,709
25,860
20.9
20.1
129.0
143.6
20.8
18.7
6.4
5.5
30.7
29.4
2.9
2.5
Bharat Forge
Buy
750
875
17,462
7,351
8,318
19.9
19.7
31.2
36.5
24.0
20.6
4.3
3.6
19.3
19.2
2.5
2.2
Eicher Motors
Accumulate
18,638
20,044
50,623
15,556
16,747
15.5
17.3
464.8
597.5
40.1
31.2
14.6
10.8
36.2
34.3
3.2
2.9
Gabriel India
Accumulate
90
101
1,289
1,415
1,544
8.7
9.0
4.6
5.4
19.5
16.6
3.5
3.1
18.1
18.9
0.9
0.8
Hero Motocorp
Neutral
3,056
-
61,024
28,244
30,532
15.5
15.9
156.7
168.5
19.5
18.1
7.8
6.6
39.9
36.4
2.1
1.9
Jamna Auto Industries Neutral
169
-
1,350
1,281
1,473
11.2
11.5
7.6
9.2
22.2
18.4
5.6
4.6
25.4
25.2
1.1
0.9
L G Balakrishnan & Bros Neutral
445
-
698
1,254
1,394
11.6
11.8
35.9
41.7
12.4
10.7
1.7
1.5
13.5
13.8
0.7
0.6
Mahindra and Mahindra Neutral
1,390
-
86,313
38,416
42,904
13.7
13.9
54.8
63.4
25.4
21.9
3.9
3.5
15.4
15.8
1.8
1.6
Maruti
Neutral
4,069
-
122,921
57,865
68,104
16.4
16.7
176.3
225.5
23.1
18.1
4.5
3.8
19.4
21.2
2.0
1.6
Minda Industries
Neutral
1,160
-
1,840
2,523
2,890
8.7
9.0
55.0
65.4
21.1
17.7
4.1
3.3
19.3
18.7
0.8
0.7
Motherson Sumi
Accumulate
276
313
36,541
39,343
45,100
8.8
9.1
10.1
12.5
27.4
22.1
8.7
6.8
35.3
34.4
1.0
0.9
Rane Brake Lining
Buy
366
465
290
454
511
11.5
12.0
25.2
31.0
14.5
11.8
2.2
2.0
14.9
16.6
0.8
0.7
Setco Automotive
Neutral
46
-
618
594
741
12.7
13.7
1.7
3.2
27.2
14.5
2.9
2.5
10.4
16.9
1.3
1.1
Tata Motors
Neutral
449
-
129,635
259,686
273,957
13.0
13.4
25.9
29.5
17.3
15.2
2.3
2.0
8.0
9.0
0.7
0.7
TVS Motor
Accumulate
297
330
14,120
11,263
13,122
6.9
8.5
9.2
15.0
32.3
19.8
7.4
5.9
22.7
29.6
1.2
1.0
Amara Raja Batteries
Buy
849
1,076
14,507
4,690
5,429
17.5
17.5
28.5
35.3
29.9
24.0
6.9
5.7
23.1
25.9
3.0
2.6
Exide Industries
Neutral
166
-
14,102
6,950
7,784
14.4
14.8
6.6
7.3
25.1
22.7
3.2
2.9
12.6
12.8
1.6
1.5
Apollo Tyres
Buy
148
183
7,516
12,056
12,714
17.2
16.4
23.0
20.3
6.4
7.3
1.1
1.0
17.7
13.6
0.7
0.7
Ceat
Buy
773
1,119
3,127
6,041
6,597
14.1
13.7
99.5
111.9
7.8
6.9
1.5
1.3
19.6
18.5
0.8
0.6
JK Tyres
Neutral
85
-
1,925
7,446
7,669
15.2
14.0
19.6
18.4
4.3
4.6
1.1
0.9
25.2
19.5
0.7
0.6
Swaraj Engines
Neutral
1,162
-
1,444
552
630
14.2
14.7
44.6
54.1
26.1
21.5
6.1
5.5
23.2
25.6
2.3
2.0
Subros
Neutral
85
-
508
1,293
1,527
11.8
11.9
4.2
6.7
20.2
12.7
1.5
1.4
7.7
11.5
0.7
0.6
Indag Rubber
Neutral
174
-
456
283
329
17.0
17.2
13.0
15.4
13.4
11.3
2.9
2.4
21.8
21.6
1.5
1.2
Capital Goods
ACE
Neutral
39
-
390
660
839
4.7
8.2
1.0
3.9
39.4
10.1
1.2
1.1
3.2
11.3
0.8
0.6
BEML
Buy
830
1,157
3,455
3,277
4,006
6.0
8.9
36.2
64.3
22.9
12.9
1.6
1.4
5.7
11.7
1.1
0.9
Bharat Electronics
Buy
1,248
1,414
29,957
7,295
8,137
20.0
16.8
56.5
58.7
22.1
21.3
3.3
2.9
42.1
44.6
3.0
2.5
Stock Watch
June 27, 2016
Company Name
Reco
CMP
Target
Mkt Cap
Sales ( Čcr )
OPM(%)
EPS (Č)
PER(x)
P/BV(x)
RoE(%)
EV/Sales(x)
(Č)
Price ( Č)
( Č cr )
FY16E
FY17E
FY16E
FY17E
FY16E
FY17E
FY16E
FY17E
FY16E
FY17E
FY16E
FY17E
FY16E
FY17E
Capital Goods
Voltas
Buy
309
407
10,236
5,857
6,511
7.5
7.9
11.7
12.9
26.4
24.0
4.3
3.8
17.1
16.7
1.9
1.7
BGR Energy
Neutral
107
-
774
3,615
3,181
9.5
9.4
16.7
12.4
6.4
8.7
0.6
0.6
10.0
7.0
0.6
0.8
BHEL
Neutral
118
-
28,943
33,722
35,272
10.8
11.7
10.5
14.2
11.3
8.3
0.8
0.8
7.0
9.0
0.9
0.9
Blue Star
Buy
419
495
3,773
3,770
4,351
5.7
6.4
11.4
17.2
36.7
24.4
5.7
5.3
18.4
23.1
1.0
0.9
Crompton Greaves
Neutral
71
-
4,466
13,484
14,687
4.9
6.2
4.5
7.1
15.8
10.0
1.1
1.0
7.2
10.8
0.5
0.4
Greaves Cotton
Neutral
132
-
3,230
1,655
1,755
16.6
16.8
7.4
7.8
17.9
17.0
3.6
3.4
21.1
20.6
2.0
1.9
Inox Wind
Buy
225
286
5,003
4,406
5,605
15.5
15.7
20.4
24.8
11.1
9.1
2.5
1.9
27.9
25.9
1.3
1.0
KEC International
Neutral
136
-
3,504
8,791
9,716
6.1
6.8
5.4
8.2
25.2
16.6
2.5
2.3
10.0
14.0
0.6
0.6
Thermax
Neutral
802
-
9,559
6,413
7,525
7.4
8.5
30.5
39.3
26.3
20.4
4.1
3.5
15.0
17.0
1.4
1.1
VATech Wabag
Neutral
553
-
3,016
2,722
3,336
7.9
8.1
19.5
24.6
28.4
22.5
3.0
2.6
11.1
12.4
1.3
1.1
Cement
ACC
Neutral
1,564
-
29,371
13,151
14,757
16.4
18.3
63.9
83.4
24.5
18.8
3.2
2.9
13.3
16.1
2.0
1.7
Ambuja Cements
Neutral
248
-
38,534
11,564
12,556
19.4
20.7
8.9
10.1
27.9
24.6
3.5
3.3
12.8
13.8
2.7
2.5
HeidelbergCement
Neutral
104
-
2,353
1,772
1,926
13.3
15.4
1.0
3.0
103.9
34.6
2.6
2.4
2.6
7.9
1.9
1.7
India Cements
Neutral
100
-
3,072
4,216
4,840
18.0
19.5
4.0
9.9
25.0
10.1
1.0
0.9
4.0
9.5
1.0
0.8
JK Cement
Neutral
639
-
4,466
3,661
4,742
10.1
15.8
7.5
28.5
85.2
22.4
2.6
2.3
7.5
22.9
1.6
1.2
J K Lakshmi Cement
Neutral
384
-
4,516
2,947
3,616
16.7
19.9
11.5
27.2
33.4
14.1
3.2
2.7
9.8
20.8
1.8
1.4
Mangalam Cements
Neutral
281
-
750
1,053
1,347
10.5
13.3
8.4
26.0
33.5
10.8
1.4
1.3
4.3
12.5
1.1
0.8
Orient Cement
Neutral
158
-
3,235
1,854
2,524
21.2
22.2
7.7
11.1
20.5
14.2
3.0
2.5
13.3
15.7
2.6
1.8
Ramco Cements
Neutral
544
-
12,955
4,036
4,545
20.8
21.3
15.1
18.8
36.0
28.9
4.4
3.9
12.9
14.3
3.5
3.0
Shree Cement^
Neutral
14,228
-
49,566
7,150
8,742
26.7
28.6
228.0
345.5
62.4
41.2
9.2
7.7
15.7
20.3
6.4
5.1
UltraTech Cement
Neutral
3,295
-
90,430
24,669
29,265
18.2
20.6
82.0
120.0
40.2
27.5
4.3
3.8
11.3
14.7
3.6
3.1
Construction
ITNL
Buy
73
93
2,395
7,360
8,682
34.0
32.2
7.0
8.6
10.4
8.5
0.4
0.4
3.2
2.5
3.7
3.5
KNR Constructions
Neutral
540
-
1,519
937
1,470
14.3
14.0
44.2
38.6
12.2
14.0
2.4
2.1
15.4
15.4
1.8
1.2
Larsen & Toubro
Buy
1,434
1,700
133,613
58,870
65,708
8.3
10.3
42.0
53.0
34.1
27.1
2.4
2.2
8.8
11.2
2.5
2.3
Gujarat Pipavav Port
Neutral
163
-
7,890
629
684
51.0
52.2
6.4
5.9
25.5
27.7
3.4
3.1
15.9
12.7
11.8
10.7
MBL Infrastructures
Buy
110
285
454
2,313
2,797
12.2
14.6
19.0
20.0
5.8
5.5
0.6
0.6
11.3
10.6
0.9
0.8
Nagarjuna Const.
Neutral
71
-
3,936
7,892
8,842
8.8
9.1
3.0
5.3
23.6
13.4
1.2
1.1
5.0
8.5
0.7
0.6
PNC Infratech
Neutral
558
-
2,861
1,873
2,288
13.2
13.5
24.0
32.0
23.2
17.4
2.3
2.0
12.1
12.3
1.6
1.3
Simplex Infra
Neutral
271
-
1,342
5,955
6,829
10.3
10.5
16.0
31.0
17.0
8.8
0.9
0.8
5.3
9.9
0.7
0.6
Stock Watch
June 27, 2016
Company Name
Reco
CMP
Target
Mkt Cap
Sales ( Čcr )
OPM(%)
EPS (Č)
PER(x)
P/BV(x)
RoE(%)
EV/Sales(x)
(Č)
Price ( Č)
( Č cr )
FY16E
FY17E
FY16E
FY17E
FY16E
FY17E
FY16E
FY17E
FY16E
FY17E
FY16E
FY17E
FY16E
FY17E
Construction
Power Mech Projects
Neutral
541
-
795
1,539
1,801
12.8
12.7
59.0
72.1
9.2
7.5
1.4
1.2
18.6
16.8
0.6
0.5
Sadbhav Engineering
Accumulate
274
298
4,699
3,186
3,598
10.2
10.3
8.0
9.0
34.2
30.4
3.2
2.8
9.4
9.9
1.8
1.6
NBCC
Accumulate
186
220
11,151
5,838
7,428
6.0
7.9
5.2
8.2
35.7
22.7
1.1
0.9
21.9
28.2
1.8
1.3
MEP Infra
Neutral
36
-
589
1,956
1,876
28.1
30.5
1.3
3.0
27.9
12.1
5.9
3.9
21.2
32.8
1.7
1.7
SIPL
Neutral
99
-
3,487
675
1,042
62.4
64.7
-
-
3.7
4.2
-
-
16.7
11.3
Engineers India
Neutral
197
-
6,641
1,667
1,725
13.5
16.0
9.7
11.4
20.3
17.3
2.4
2.3
11.7
13.4
2.7
2.7
Financials
Allahabad Bank
Neutral
65
-
4,707
8,569
9,392
2.8
2.9
16.3
27.5
4.0
2.4
0.4
0.3
7.6
11.9
-
-
Axis Bank
Neutral
510
-
121,791
26,204
29,738
3.6
3.5
34.5
35.4
14.8
14.4
2.3
2.1
16.8
14.9
-
-
Bank of Baroda
Neutral
147
-
33,860
18,802
21,088
2.0
2.2
(7.4)
13.0
11.3
1.2
0.9
(4.2)
7.3
-
-
Bank of India
Neutral
95
-
8,864
15,972
17,271
1.9
2.0
15.3
33.4
6.2
2.9
0.3
0.2
3.6
7.6
-
-
Canara Bank
Neutral
210
-
11,392
15,441
16,945
2.0
2.1
46.6
70.4
4.5
3.0
0.4
0.3
8.0
11.2
-
-
Dena Bank
Neutral
36
-
2,371
3,440
3,840
2.1
2.3
7.3
10.0
4.9
3.5
0.4
0.3
6.1
7.9
-
-
Dewan Housing Finance Buy
195
270
5,686
1,828
2,225
2.9
3.0
24.9
29.7
7.8
6.6
1.2
1.1
15.1
16.1
-
-
Equitas Holdings
Buy
175
235
5,864
679
1,076
12.4
11.7
6.2
6.7
28.2
26.1
3.5
2.6
13.3
12.5
-
-
Federal Bank
Neutral
55
-
9,467
3,279
3,787
2.8
2.9
3.9
5.5
14.0
10.0
1.1
1.0
8.4
10.8
-
-
HDFC
Neutral
1,224
-
193,455
10,358
11,852
3.3
3.3
41.1
47.0
29.8
26.0
5.7
5.2
24.7
24.9
-
-
HDFC Bank
Accumulate
1,162
1,262
294,125
38,606
47,696
4.4
4.5
48.8
61.4
23.8
18.9
4.0
3.5
18.7
20.0
-
-
ICICI Bank
Neutral
231
-
134,400
34,279
39,262
3.3
3.3
21.0
24.4
11.0
9.5
1.9
1.6
14.4
14.7
-
-
IDBI Bank
Neutral
66
-
13,609
9,625
10,455
1.8
1.8
8.5
14.2
7.8
4.7
0.5
0.4
5.9
9.3
-
-
Indian Bank
Neutral
134
-
6,417
6,160
6,858
2.5
2.5
24.5
29.8
5.5
4.5
0.4
0.4
7.7
8.6
-
-
LIC Housing Finance
Buy
478
592
24,108
3,179
3,758
2.6
2.6
32.9
40.6
14.5
11.8
2.7
2.3
19.6
20.7
-
-
Oriental Bank
Neutral
100
-
3,455
7,643
8,373
2.4
2.4
37.2
45.4
2.7
2.2
0.2
0.2
8.2
9.4
-
-
Punjab Natl.Bank
Neutral
102
-
20,058
23,122
26,022
2.8
2.8
7.0
21.6
14.6
4.7
0.7
0.7
3.4
10.0
-
-
South Ind.Bank
Neutral
20
-
2,653
1,965
2,185
2.5
2.5
2.5
3.3
7.9
6.0
0.8
0.7
9.5
11.7
-
-
St Bk of India
Neutral
211
-
163,989
79,958
86,061
2.6
2.6
13.4
20.7
15.8
10.2
1.3
1.2
11.5
12.8
-
-
Union Bank
Neutral
122
-
8,390
12,646
14,129
2.3
2.4
31.0
39.1
3.9
3.1
0.4
0.4
9.8
11.4
-
-
Vijaya Bank
Neutral
36
-
3,561
3,536
3,827
1.9
1.9
5.5
6.7
6.5
5.4
0.5
0.5
7.8
8.8
-
-
Yes Bank
Neutral
1,080
-
45,466
7,190
9,011
3.2
3.3
58.2
69.7
18.6
15.5
3.3
2.8
19.2
19.6
-
-
FMCG
Asian Paints
Neutral
989
-
94,836
15,534
17,445
17.7
16.8
18.4
19.6
53.8
50.4
19.0
17.9
34.6
35.6
6.2
5.5
Stock Watch
June 27, 2016
Company Name
Reco
CMP
Target
Mkt Cap
Sales ( Čcr )
OPM(%)
EPS (Č)
PER(x)
P/BV(x)
RoE(%)
EV/Sales(x)
(Č)
Price ( Č)
( Č cr )
FY16E FY17E
FY16E
FY17E
FY16E
FY17E
FY16E
FY17E
FY16E
FY17E
FY16E
FY17E
FY16E
FY17E
FMCG
Britannia
Neutral
2,633
-
31,585
8,481
9,795
14.0
14.1
65.5
78.3
40.2
33.6
19.0
15.6
38.3
41.2
3.8
3.3
Colgate
Neutral
883
-
24,007
4,136
4,632
22.5
23.3
22.2
25.3
39.8
34.9
24.2
21.5
68.6
67.5
5.6
5.0
Dabur India
Neutral
311
-
54,709
9,370
10,265
17.6
17.3
7.3
8.1
42.4
38.4
11.0
10.1
31.7
30.6
5.6
5.1
GlaxoSmith Con*
Accumulate
5,991
6,118
25,194
4,519
5,142
19.6
19.8
164.3
191.2
36.5
31.3
10.1
8.6
30.8
29.9
4.7
4.1
Godrej Consumer
Neutral
1,512
-
51,494
9,003
10,335
18.1
18.7
34.1
41.8
44.4
36.2
9.6
8.2
23.9
24.8
6.1
5.3
HUL
Neutral
859
-
185,907
33,299
35,497
17.1
17.1
18.9
20.0
45.5
43.0
39.8
34.7
87.6
80.8
5.6
5.2
ITC
Accumulate
353
380
284,388
36,837
39,726
38.8
38.7
12.2
13.5
28.9
26.2
8.1
7.1
27.8
26.9
7.2
6.7
Marico
Neutral
256
-
33,022
6,151
6,966
17.2
17.3
5.4
6.4
47.4
40.0
14.9
11.7
33.2
32.4
5.2
4.6
Nestle*
Neutral
6,478
-
62,454
9,393
10,507
22.2
22.3
106.8
121.8
60.7
53.2
21.3
19.2
34.8
36.7
6.2
5.6
Tata Global
Accumulate
124
137
7,842
8,635
9,072
9.8
9.9
5.8
7.2
21.4
17.3
1.9
1.8
6.8
7.4
0.9
0.9
Procter & Gamble
Buy
6,211
7,369
20,161
2,588
2,939
23.3
23.2
130.2
146.2
47.7
42.5
95.1
91.2
27.6
25.3
7.4
6.4
Hygiene
IT
HCL Tech^
Buy
742
1,000
104,671
37,061
30,781
21.5
20.5
51.4
40.0
14.4
18.6
3.7
2.7
20.1
20.3
2.5
2.7
Infosys
Accumulate
1,195
1,374
274,370
62,441
70,558
27.5
27.5
59.0
65.3
20.3
18.3
4.1
3.7
22.2
22.4
4.1
3.5
TCS
Accumulate
2,571
3,004
506,538
108,646
122,770
28.3
28.3
123.7
141.0
20.8
18.2
6.9
6.3
33.1
34.6
4.3
3.7
Tech Mahindra
Buy
507
700
49,205
26,494
30,347
16.3
17.0
32.2
37.5
15.7
13.5
3.4
3.0
21.7
21.8
1.8
1.5
Wipro
Buy
556
680
137,359
50,808
56,189
23.7
23.8
37.3
40.7
14.9
13.7
2.8
2.6
19.2
17.7
2.1
1.7
Media
D B Corp
Neutral
378
-
6,943
2,025
2,187
27.4
27.4
17.4
18.9
21.7
20.0
4.9
4.5
22.9
23.7
3.4
3.1
HT Media
Neutral
77
-
1,789
2,495
2,673
12.9
13.2
6.8
7.2
11.3
10.7
0.9
0.8
7.5
7.8
0.3
0.3
Jagran Prakashan
Buy
169
205
5,523
2,107
2,355
33.5
28.0
10.1
10.8
16.8
15.6
3.9
3.4
23.3
21.7
2.7
2.4
Sun TV Network
Neutral
350
-
13,791
2,510
2,763
71.8
71.5
21.9
24.8
16.0
14.1
3.8
3.4
22.8
24.3
5.2
4.7
Hindustan Media
Neutral
270
-
1,983
914
1,016
21.7
21.5
21.9
23.3
12.3
11.6
2.2
1.9
18.0
16.2
1.6
1.4
Ventures
Metals & Mining
Coal India
Buy
312
380
196,849
76,167
84,130
19.9
22.3
22.4
25.8
13.9
12.1
5.0
4.9
35.5
41.0
1.9
1.7
Hind. Zinc
Neutral
170
-
71,704
14,641
14,026
50.4
50.4
17.7
16.0
9.6
10.6
1.5
1.3
16.2
13.2
2.5
2.3
Hindalco
Neutral
117
-
24,253
104,356
111,186
8.7
9.5
6.7
11.1
17.5
10.6
0.6
0.6
3.5
5.9
0.7
0.7
JSW Steel
Neutral
1,382
-
33,410
42,308
45,147
16.4
20.7
(10.3)
49.5
27.9
1.5
1.5
(1.0)
5.6
1.8
1.7
NMDC
Neutral
91
-
35,881
8,237
10,893
46.6
44.5
10.0
11.7
9.1
7.8
1.0
0.9
12.5
13.0
4.1
3.1
SAIL
Neutral
42
-
17,512
45,915
53,954
7.2
10.5
1.5
4.4
28.2
9.7
0.4
0.4
2.3
4.1
1.0
0.9
Vedanta
Neutral
118
-
34,939
71,445
81,910
26.2
26.3
12.9
19.2
9.2
6.1
0.6
0.6
7.2
8.9
0.9
0.7
Tata Steel
Neutral
313
-
30,350
126,760
137,307
8.9
11.3
6.4
23.1
49.1
13.5
1.0
1.0
2.0
7.1
0.8
0.8
Stock Watch
June 27, 2016
Company Name
Reco
CMP
Target
Mkt Cap
Sales ( Čcr )
OPM(%)
EPS (Č)
PER(x)
P/BV(x)
RoE(%)
EV/Sales(x)
(Č)
Price ( Č)
( Č cr )
FY16E FY17E
FY16E
FY17E
FY16E
FY17E
FY16E
FY17E
FY16E
FY17E
FY16E
FY17E
FY16E
FY17E
Oil & Gas
Cairn India
Neutral
133
-
24,945
11,323
12,490
49.4
51.0
20.7
20.7
6.4
6.4
0.4
0.4
6.4
6.1
1.4
0.8
GAIL
Neutral
377
-
47,777
64,856
70,933
9.1
9.6
24.0
28.9
15.7
13.0
1.3
1.3
8.8
9.6
0.9
0.8
ONGC
Neutral
210
-
179,280
154,564
145,998
36.8
37.4
20.8
22.6
10.1
9.3
0.9
0.9
10.1
9.7
1.4
1.5
Petronet LNG
Neutral
290
-
21,731
29,691
31,188
5.8
6.2
12.8
13.4
22.7
21.6
3.4
3.0
15.8
14.8
0.8
0.7
Indian Oil Corp
Accumulate
419
455
101,743
359,607
402,760
5.9
6.1
42.5
48.7
9.9
8.6
1.3
1.2
14.1
14.4
0.4
0.3
Reliance Industries
Buy
952
1,150
308,519
304,775
344,392
12.6
13.4
91.3
102.6
10.4
9.3
1.2
1.1
11.8
12.0
0.9
0.8
Pharmaceuticals
Alembic Pharma
Neutral
545
-
10,265
3,274
3,802
26.9
19.4
35.0
28.7
15.6
19.0
6.9
5.2
55.6
31.2
3.2
2.7
Aurobindo Pharma
Accumulate
700
856
40,977
14,923
17,162
22.0
23.0
35.7
42.8
19.6
16.4
5.8
4.3
34.0
30.2
3.5
3.0
Aventis*
Accumulate
4,141
4,738
9,538
2,049
2,375
15.4
17.3
115.4
153.5
35.9
27.0
5.9
4.6
19.3
25.8
4.6
3.9
Cadila Healthcare
Buy
312
400
31,966
9,469
11,246
21.2
22.0
14.9
17.1
21.0
18.3
6.0
4.7
28.8
26.6
3.4
2.9
Cipla
Buy
477
605
38,290
13,979
16,447
20.2
18.6
25.7
27.5
18.5
17.3
3.0
2.6
17.6
16.1
2.7
2.2
Dr Reddy's
Accumulate
3,150
3,476
53,725
15,471
17,479
24.6
24.6
138.2
152.4
22.8
20.7
4.2
3.6
19.7
18.7
3.4
3.0
Dishman Pharma
Neutral
132
-
2,132
1,733
1,906
21.5
21.5
10.1
10.0
13.1
13.2
1.5
1.4
10.5
11.2
1.9
1.7
GSK Pharma*
Neutral
3,464
-
29,345
2,870
3,158
20.0
22.1
59.5
68.3
58.2
50.7
17.2
17.7
28.5
34.3
9.9
9.1
Indoco Remedies
Neutral
272
-
2,508
1,033
1,199
15.9
18.2
9.4
13.6
29.0
20.0
4.3
3.7
15.7
19.7
2.6
2.3
Ipca labs
Buy
460
750
5,800
3,363
3,909
12.9
18.6
13.4
28.0
34.3
16.4
2.5
2.2
7.4
14.0
1.9
1.6
Lupin
Buy
1,463
1,809
65,953
13,702
15,912
23.7
26.4
50.5
58.1
29.0
25.2
6.0
4.9
22.9
21.4
5.2
4.2
Sun Pharma
Buy
754
950
181,405
28,163
32,610
25.8
30.7
17.4
26.9
43.3
28.0
4.1
3.6
13.0
16.6
5.8
4.8
Power
Tata Power
Neutral
73
-
19,663
35,923
37,402
22.6
22.8
4.1
5.2
17.9
14.1
1.4
1.3
7.5
9.3
1.5
1.4
NTPC
Neutral
149
-
122,940
87,271
99,297
23.5
23.5
11.8
13.3
12.7
11.2
1.4
1.3
11.5
12.2
2.4
2.2
Power Grid
Accumulate
156
170
81,456
20,702
23,361
86.7
86.4
12.1
13.2
12.9
11.8
1.9
1.7
15.6
15.1
8.7
8.1
Real Estate
MLIFE
Buy
452
554
1,854
826
1,011
20.1
21.9
22.7
30.7
19.9
14.7
1.2
1.1
6.0
7.4
4.1
3.1
Telecom
Bharti Airtel
Neutral
355
-
141,708
101,748
109,191
32.1
31.7
12.0
12.5
29.5
28.4
2.0
1.9
6.9
6.7
2.0
1.9
Idea Cellular
Neutral
99
-
35,808
34,282
36,941
32.0
31.5
5.9
6.2
16.9
16.0
1.5
1.4
9.9
9.3
1.7
1.6
zOthers
Abbott India
Neutral
4,492
-
9,545
2,715
3,153
14.5
14.1
134.3
152.2
33.5
29.5
8.4
6.9
27.4
25.6
3.3
2.8
Bajaj Electricals
Buy
222
268
2,245
4,612
5,351
5.6
5.7
23.4
18.0
9.5
12.4
2.9
2.6
12.5
14.4
0.5
0.4
Finolex Cables
Neutral
346
-
5,285
2,520
2,883
12.2
12.0
12.7
14.2
27.3
24.3
3.7
3.3
13.6
13.5
1.9
1.6
Goodyear India*
Accumulate
517
582
1,193
1,800
1,600
11.7
11.5
58.7
52.9
8.8
9.8
2.0
1.7
24.6
18.7
0.4
0.4
Hitachi
Neutral
1,262
-
3,431
1,779
2,081
7.8
8.8
21.8
33.4
57.9
37.7
9.3
7.6
17.4
22.1
2.0
1.7
Stock Watch
June 27, 2016
Company Name
Reco
CMP
Target
Mkt Cap
Sales ( Čcr )
OPM(%)
EPS (Č)
PER(x)
P/BV(x)
RoE(%)
EV/Sales(x)
(Č)
Price ( Č)
( Č cr )
FY16E
FY17E
FY16E
FY17E
FY16E
FY17E
FY16E
FY17E
FY16E
FY17E
FY16E
FY17E
FY16E
FY17E
zOthers
Jyothy Laboratories
Neutral
296
-
5,355
1,620
1,847
11.5
11.5
7.3
8.5
40.6
34.9
5.2
4.9
13.3
14.4
3.1
2.7
MRF
Buy
31,361
45,575
13,301
20,316
14,488
21.4
21.1
5,488.0
3,798.0
5.7
8.3
2.0
1.6
41.1
21.2
0.6
0.9
Page Industries
Neutral
13,554
-
15,118
1,929
2,450
19.8
20.1
229.9
299.0
59.0
45.3
26.0
18.1
52.1
47.1
8.2
6.4
Relaxo Footwears
Neutral
490
-
5,879
1,767
2,152
12.3
12.5
19.3
25.1
25.5
19.5
6.2
4.8
27.7
27.8
3.0
2.5
Siyaram Silk Mills
Buy
1,065
1,347
999
1,619
1,799
11.6
11.6
93.5
104.9
11.4
10.2
2.0
1.7
17.1
16.4
0.8
0.8
Styrolution ABS India* Neutral
608
-
1,069
1,271
1,440
8.6
9.2
32.0
41.1
19.0
14.8
1.9
1.7
10.7
12.4
0.8
0.7
TVS Srichakra
Buy
2,324
2,932
1,779
2,035
2,252
15.9
15.3
248.6
268.1
9.4
8.7
4.1
2.9
43.6
33.9
0.9
0.8
HSIL
Accumulate
276
310
1,995
2,123
2,384
16.1
16.5
15.0
18.9
18.4
14.6
1.4
1.3
8.0
9.4
1.3
1.1
Kirloskar Engines India
Neutral
265
-
3,832
2,403
2,554
8.6
9.9
9.2
10.5
28.9
25.3
2.8
2.6
9.7
10.7
1.2
1.1
Ltd
M M Forgings
Buy
437
546
527
511
615
21.7
21.6
43.1
55.8
10.1
7.8
1.9
1.5
19.9
21.2
1.3
1.0
Banco Products (India) Neutral
137
-
983
1,208
1,353
11.0
12.3
10.8
14.5
12.8
9.5
1.5
1.3
11.9
14.5
0.8
0.7
Competent Automobiles Neutral
140
-
86
1,040
1,137
3.2
3.1
25.7
28.0
5.4
5.0
0.8
0.7
15.0
14.3
0.1
0.1
Nilkamal
Neutral
1,117
-
1,667
1,871
2,031
10.7
10.5
63.2
69.8
17.7
16.0
2.9
2.5
17.6
16.6
1.0
0.9
Visaka Industries
Buy
144
162
228
1,020
1,120
8.7
9.1
13.9
20.1
10.3
7.1
0.7
0.6
6.4
8.7
0.4
0.4
Transport Corporation of
Neutral
305
-
2,333
2,830
3,350
8.8
9.0
14.4
18.3
21.2
16.6
3.3
2.8
15.4
17.1
0.9
0.8
India
Elecon Engineering
Neutral
59
-
644
1,359
1,482
10.3
13.7
0.8
3.9
73.6
15.2
1.2
1.2
1.6
7.8
0.8
0.7
Surya Roshni
Buy
158
201
692
2,992
3,223
8.1
8.4
14.7
18.3
10.8
8.6
1.0
0.9
9.7
11.0
0.5
0.5
MT Educare
Neutral
161
-
640
286
366
18.3
17.7
7.7
9.4
20.8
17.2
4.4
3.8
20.2
21.1
2.4
1.8
Radico Khaitan
Buy
90
125
1,199
1,543
1,659
12.6
13.0
5.8
6.3
15.6
14.2
1.3
1.2
8.5
8.6
1.3
1.2
Garware Wall Ropes
Buy
356
460
779
828
898
11.2
10.3
28.3
29.0
12.6
12.3
2.1
1.8
16.8
14.9
0.9
0.8
Wonderla Holidays
Neutral
387
-
2,185
206
308
44.0
43.6
9.0
12.9
43.0
30.0
5.9
5.3
13.7
17.8
10.4
6.9
Linc Pen & Plastics
Accumulate
230
235
340
344
382
9.1
9.1
12.4
13.1
18.6
17.6
3.3
2.9
18.0
16.7
1.0
0.9
The Byke Hospitality
Neutral
153
-
615
222
287
20.5
20.5
5.6
7.6
27.2
20.3
5.1
4.2
18.9
20.8
3.1
2.4
Interglobe Aviation
Neutral
1,005
-
36,198
17,022
21,122
20.7
14.5
63.9
53.7
15.7
18.7
23.6
19.3
149.9
103.2
2.1
1.7
Coffee Day Enterprises
Neutral
244
-
5,019
2,692
2,964
17.0
18.6
-
4.7
-
51.4
3.0
2.8
0.2
5.5
2.4
2.2
Ltd
Navneet Education
Neutral
91
-
2,174
998
1,062
24.1
24.0
5.8
6.1
15.9
15.0
3.5
3.1
22.0
20.6
2.1
2.0
Navkar Corporation
Buy
203
265
2,896
347
408
43.2
42.9
6.7
6.8
30.5
30.0
2.2
2.1
7.3
6.9
8.7
7.9
UFO Moviez
Neutral
516
-
1,424
558
619
32.0
33.2
22.5
30.0
22.9
17.2
2.8
2.4
12.0
13.8
2.5
2.1
VRL Logistics
Neutral
308
-
2,810
1,725
1,902
16.5
16.7
12.2
14.6
25.3
21.1
5.3
4.6
20.8
21.9
1.6
1.4
Stock Watch
June 27, 2016
Company Name
Reco
CMP
Target Mkt Cap
Sales ( Čcr )
OPM(%)
EPS (Č)
PER(x)
P/BV(x)
RoE(%)
EV/Sales(x)
(Č)
Price ( Č)
( Č cr )
FY16E FY17E FY16E FY17E FY16E FY17E FY16E FY17E FY16E FY17E FY16E FY17E FY16E FY17E
zOthers
Team Lease Serv.
Neutral
908
-
1,552
2,565
3,229
1.3
1.5
15.2
22.8
59.8
39.9
4.8
4.3
8.0
10.7
0.5
0.4
S H Kelkar & Co.
Neutral
214
-
3,090
928
1,036
15.3
15.1
4.9
6.1
43.3
35.0
4.1
3.7
9.4
10.7
3.2
2.8
Quick Heal
Neutral
263
-
1,841
339
408
27.8
27.3
7.1
7.7
37.2
34.0
3.1
3.2
8.5
9.3
3.8
3.2
Narayana Hrudaya
Neutral
314
-
6,414
1,603
1,873
10.9
11.5
1.0
2.6
329.5
118.7
7.9
7.3
2.4
6.1
4.1
3.5
Manpasand Bever.
Neutral
520
-
2,603
540
836
19.9
19.6
10.2
16.9
50.8
30.8
4.1
3.7
8.1
12.0
4.7
3.0
Source: Company, Angel Research; Note: *December year end; #September year end; &October year end; Price as on June 24, 2016
Market Outlook
June 27, 2016
Research Team Tel: 022 - 39357800
DISCLAIMER
Angel Broking Private Limited (hereinafter referred to as “Angel”) is a registered Member of National Stock Exchange of India Limited,
Bombay Stock Exchange Limited and Metropolitian Stock Exchange of India Limited. It is also registered as a Depository Participant with
CDSL and Portfolio Manager with SEBI. It also has registration with AMFI as a Mutual Fund Distributor. Angel Broking Private Limited is a
registered entity with SEBI for Research Analyst in terms of SEBI (Research Analyst) Regulations, 2014 vide registration number
INH000000164. Angel or its associates has not been debarred/ suspended by SEBI or any other regulatory authority for accessing
/dealing in securities Market. Angel or its associates including its relatives/analyst do not hold any financial interest/beneficial ownership
of more than 1% in the company covered by Analyst. Angel or its associates/analyst has not received any compensation / managed or co
-managed public offering of securities of the company covered by Analyst during the past twelve months. Angel/analyst has not served as
an officer, director or employee of company covered by Analyst and has not been engaged in market making activity of the company
covered by Analyst.
This document is solely for the personal information of the recipient, and must not be singularly used as the basis of any investment
decision. Nothing in this document should be construed as investment or financial advice. Each recipient of this document should make
such investigations as they deem necessary to arrive at an independent evaluation of an investment in the securities of the companies
referred to in this document (including the merits and risks involved), and should consult their own advisors to determine the merits and
risks of such an investment.
Reports based on technical and derivative analysis center on studying charts of a stock's price movement, outstanding positions and
trading volume, as opposed to focusing on a company's fundamentals and, as such, may not match with a report on a company's
fundamentals.
The information in this document has been printed on the basis of publicly available information, internal data and other reliable sources
believed to be true, but we do not represent that it is accurate or complete and it should not be relied on as such, as this document is for
general guidance only. Angel Broking Pvt. Limited or any of its affiliates/ group companies shall not be in any way responsible for any
loss or damage that may arise to any person from any inadvertent error in the information contained in this report. Angel Broking Pvt.
Limited has not independently verified all the information contained within this document. Accordingly, we cannot testify, nor make any
representation or warranty, express or implied, to the accuracy, contents or data contained within this document. While Angel Broking
Pvt. Limited endeavors to update on a reasonable basis the information discussed in this material, there may be regulatory, compliance,
or other reasons that prevent us from doing so.
This document is being supplied to you solely for your information, and its contents, information or data may not be reproduced,
redistributed or passed on, directly or indirectly.
Neither Angel Broking Pvt. Limited, nor its directors, employees or affiliates shall be liable for any loss or damage that may arise from or
in connection with the use of this information.
Note: Please refer to the important ‘Stock Holding Disclosure' report on the Angel website (Research Section). Also, please refer to the
latest update on respective stocks for the disclosure status in respect of those stocks. Angel Broking Pvt. Limited and its affiliates may have
investment positions in the stocks recommended in this report.