Market Outlook
February 25, 2016
Market Cues
Domestic Indices
Chg (%)
(Pts)
(Close)
Indian markets are expected to open on a flat note tracking the SGX Nifty.
BSE Sensex
(1.4)
(321)
23,089
Nifty
(1.3)
(91)
7,019
U.S. markets closed in the green as the oil prices stabilised helping the index to
recover from an intraday decline of about 2%.
Mid Cap
(0.8)
(77)
9,655
Small Cap
(1.1)
(112)
9,686
European markets ended with steep decline of about
2% led by dip in the
Bankex
(1.4)
(216)
15,676
commodity stocks.
Indian markets declined for the second consecutive session on back of weak global
Global Indices
Chg (%)
(Pts)
(Close)
cues and investor caution ahead of the upcoming Union Budget.
Dow Jones
0.3
53
16,485
News & Result Analysis
Nasdaq
0.9
39
4,543
Tata Motors reclaims top slot in LCV segment from M&M
FTSE
(1.6)
(95)
5,867
Detailed analysis on Pg2
Nikkei
(0.8)
(136)
15,916
Investor’s Ready Reckoner
Hang Seng
(1.1)
(222)
19,192
Key Domestic & Global Indicators
Shanghai Com
0.9
26
2,929
Stock Watch: Latest investment recommendations on 150+ stocks
Refer Pg4 onwards
Advances / Declines
BSE
NSE
Advances
776
415
Top Picks
CMP
Target
Upside
Declines
1,802
1,124
Company
Sector
Rating
(`)
(`)
(%)
Unchanged
139
68
Amara Raja Batteries Auto & Auto Ancillary
Buy
883
1,040
17.8
HCL Tech
IT
Buy
810
1,038
28.1
Volumes (` Cr)
LIC Housing Finance Financials
Buy
399
592
48.2
BSE
2,192
Bharat Electronics
Capital Goods
Buy
1,091
1,414
29.6
NSE
13,096
Navkar Corporation Others
Buy
156
265
69.8
More Top Picks on Pg3
Net Inflows (` Cr)
Net
Mtd
Ytd
Key Upcoming Events
Previous
Consensus
FII
(282)
(4,925)
(18,031)
Date
Region
Event Description
Reading
Expectations
MFs
25
2,806
78,650
Feb 25 US
Initial Jobless claims (Thousands)
262.0
-
Feb 25 UK
GDP (YoY) (%)
1.9
1.9
Top Gainers
Price (`)
Chg (%)
Feb 25 Euro Zone
Euro-Zone CPI (YoY) (%)
0.4
0.4
Renuka
12
4.7
Feb 26 US
GDP QoQ (Annualised) (%)
0.7
0.4
6.(
Kpit
129
4.7
Bpcl
769
4.3
Vakrangee
209
4.2
Gmrinfra
12
3.6
Top Losers
Price (`)
Chg (%)
Nmdc
81
(13.6)
Mmtc
31
(7.6)
Neyvelilig
68
(6.6)
Auropharma
618
(5.6)
Aban
162
(5.5)
As on February 24, 2016
Market Outlook
February 25, 2016
Tata Motors reclaims top slot in LCV segment from M&M
Tata Motors, which lost its pole position in the light commercial vehicle segment to
Mahindra & Mahindra (M&M) in the first eight months of the fiscal year, has
reclaimed its place over the past two months. On a cumulative basis, however,
M&M remains the segment leader for the April-January period of the ongoing
financial year.
A decline in demand due to slowing economy and defaults in financed vehicles
had impacted the overall LCV demand. M&M, which launched products like Jeeto,
a mini truck in June last year and Supro Maxitruck passenger LCV in October,
succeeded in expanding share even as the market was declining. Tata Motors was
not ready with a product line up and M&M managed to take away the share. Tata
Motors had product gaps in the pick up segment which forms about half of the
LCV volumes. With the company launching the Ace Mega recently, Tata Motors
has seen its market share increase in the overall LCV space.
The LCV market is significant with a size of 382,206 units in FY15. These small
trucks are used for intra-city transport of goods. The fight for a greater share in the
LCV space which has just started growing after a long phase of decline is set to
pick up. LCV is a highly price sensitive segment since buyers, mostly individuals,
need to make a business out of it. Bulk of sales happen through financing and
financing activity had declined owing to a number of defaults in recent times due
to a subdued economy. However, improvement in MHCV demand over the last six
quarters, boom in e-commerce, retail and increase in urbanisation coupled with
easy finance options is likely to result into improvement in LCV demand in
FY2017. With Tata Motors fulfilling the product gaps it is likely to further regain
market share in LCV space. We currently have Buy rating on the stock.
Economic and Political News
Uday scheme to reboot coal demand in six months: Coal Secretary
States get `1,233 cr as upfront payment for coal mines
Gold imports surge 85% as consumers look to beat economic slowdown
Corporate News
Piramal Enterprises plans to raise `1,000 cr through NCDs
Godrej Appliances seeks to increase market share by 3%
Tata Steel loses iron ore mine in Chhattisgarh
ONGC's $500 million San Cristobal investment deal imminent
Market Outlook
February 25, 2016
Top Picks ★★★★★
Large Cap
Market Cap
CMP
Target
Upside
Company
Rationale
(` Cr)
(`)
(`)
(%)
To outpace battery industry growth due to better technological
Amara Raja Batteries
15,085
883
1,040
17.8
products leading to market share gains in both the automotive
OEM and replacement segments.
Earnings to grow strongly given the MHCV cyclical upturn.
Ashok Leyland
24,901
88
111
26.9
Focus on exports and LCV's provides additional growth
avenue.
Uptick in defense capex by government when coupled with
Bharat Electronics
26,184
1,091
1,414
29.6
BELs strong market positioning, indicate that good times are
ahead for BEL.
The stock is trading at attractive valuations and is factoring all
HCL Tech
114,248
810
1,038
28.1
the bad news.
Strong visibility for a robust 20% earnings trajectory, coupled
HDFC Bank
239,853
950
1,262
32.9
with high quality of earnings on account of high quality retail
business and strategic focus on highly rated corporates.
Back on the growth trend, expect a long term growth of 14%
Infosys
258,498
1,125
1,347
19.7
to be a US$20bn in FY2020.
LICHF continues to grow its retail loan book at a healthy pace
with improvement in asset quality. We expect the company to
LIC Housing Finance
20,146
399
592
48.2
post a healthy loan book which is likely to reflect in a strong
earnings growth.
Huge bid pipeline of re-development works at Delhi and other
NBCC
10,462
872
1,089
24.9
State Governments and opportunity from Smart City, positions
NBCC to report strong growth, going forward.
New launches to enable outpace industry growth; margins
TVS Motors
12,844
270
330
22.1
expansion to boost earnings.
Source: Company, Angel Research
Mid Cap
Market Cap
CMP
Target
Upside
Company
Rationale
(` Cr)
(`)
(`)
(%)
Favourable outlook for the AC industry to augur well for
Cooling products business which is out pacing the market
Blue Star
2,872
319
439
37.5
growth. EMPPAC division's profitability to improve once
operating environment turns around.
Economic recovery to have favourable impact on advertising &
circulation revenue growth. Further, the acquisition of a radio
Jagran Prakashan
4,909
150
189
25.9
business (Radio City) would also boost the company's revenue
growth.
Massive capacity expansion along with rail advantage at ICD
Navkar Corporation
2,226
156
265
69.8
as well CFS augurs well for the company
Earnings boost on back of stable material prices and
Radico Khaitan
1,306
98
156
58.9
favourable pricing environment. Valuation discount to peers
provides additional comfort
Strong brands and distribution network would boost growth
Siyaram Silk Mills
917
978
1,354
38.4
going ahead. Stock currently trades at an inexpensive
valuation.
Source: Company, Angel Research
Market Outlook
February 25, 2016
Key Upcoming Events
Global economic events release calendar
Date
Time
Country
Event Description
Unit
Period
Bloomberg Data
Last Reported Estimated
Feb 25, 2016
7:00PM
US
Initial Jobless claims
Thousands
Feb 20
262.00
270.00
3:00PM
UK
GDP (YoY)
% Change
4Q P
1.90
1.90
3:30PM
Euro Zone
Euro-Zone CPI (YoY)
%
Jan F
0.40
0.40
Feb 26, 2016
3:30PM
Euro Zone
Euro-Zone Consumer Confidence
Value
Feb F
(8.80)
--
7:00PM
US
GDP Qoq (Annualised)
% Change
4Q S
0.70
0.40
Mar 1, 2016
2:25PM
Germany
PMI Manufacturing
Value
Feb F
50.20
--
3:00PM
UK
PMI Manufacturing
Value
Feb
52.90
--
6:30AM
China
PMI Manufacturing
Value
Feb
49.40
49.50
2:25PM
Germany
Unemployment change (000's)
Thousands
Feb
(20.00)
--
Mar 3, 2016
2:25PM
Germany
PMI Services
Value
Feb F
55.10
--
Mar 4, 2016
7:00PM
US
Change in Nonfarm payrolls
Thousands
Feb
151.00
195.00
7:00PM
US
Unnemployment rate
%
Feb
4.90
4.90
Mar 8, 2016
China
Exports YoY%
% Change
Feb
(11.20)
--
3:30PM
Euro Zone
Euro-Zone GDP s.a. (QoQ)
% Change
4Q P
0.30
--
Mar 9, 2016
3:00PM
UK
Industrial Production (YoY)
% Change
Jan
(0.40)
--
Mar 10, 2016 7:00AM
China
Consumer Price Index (YoY)
% Change
Feb
1.80
--
India
Imports YoY%
% Change
Feb
(11.00)
--
India
Exports YoY%
% Change
Feb
(13.60)
--
6:15PM
Euro Zone
ECB announces interest rates
%
Mar 10
0.05
--
Source: Bloomberg, Angel Research
Market Outlook
February 25, 2016
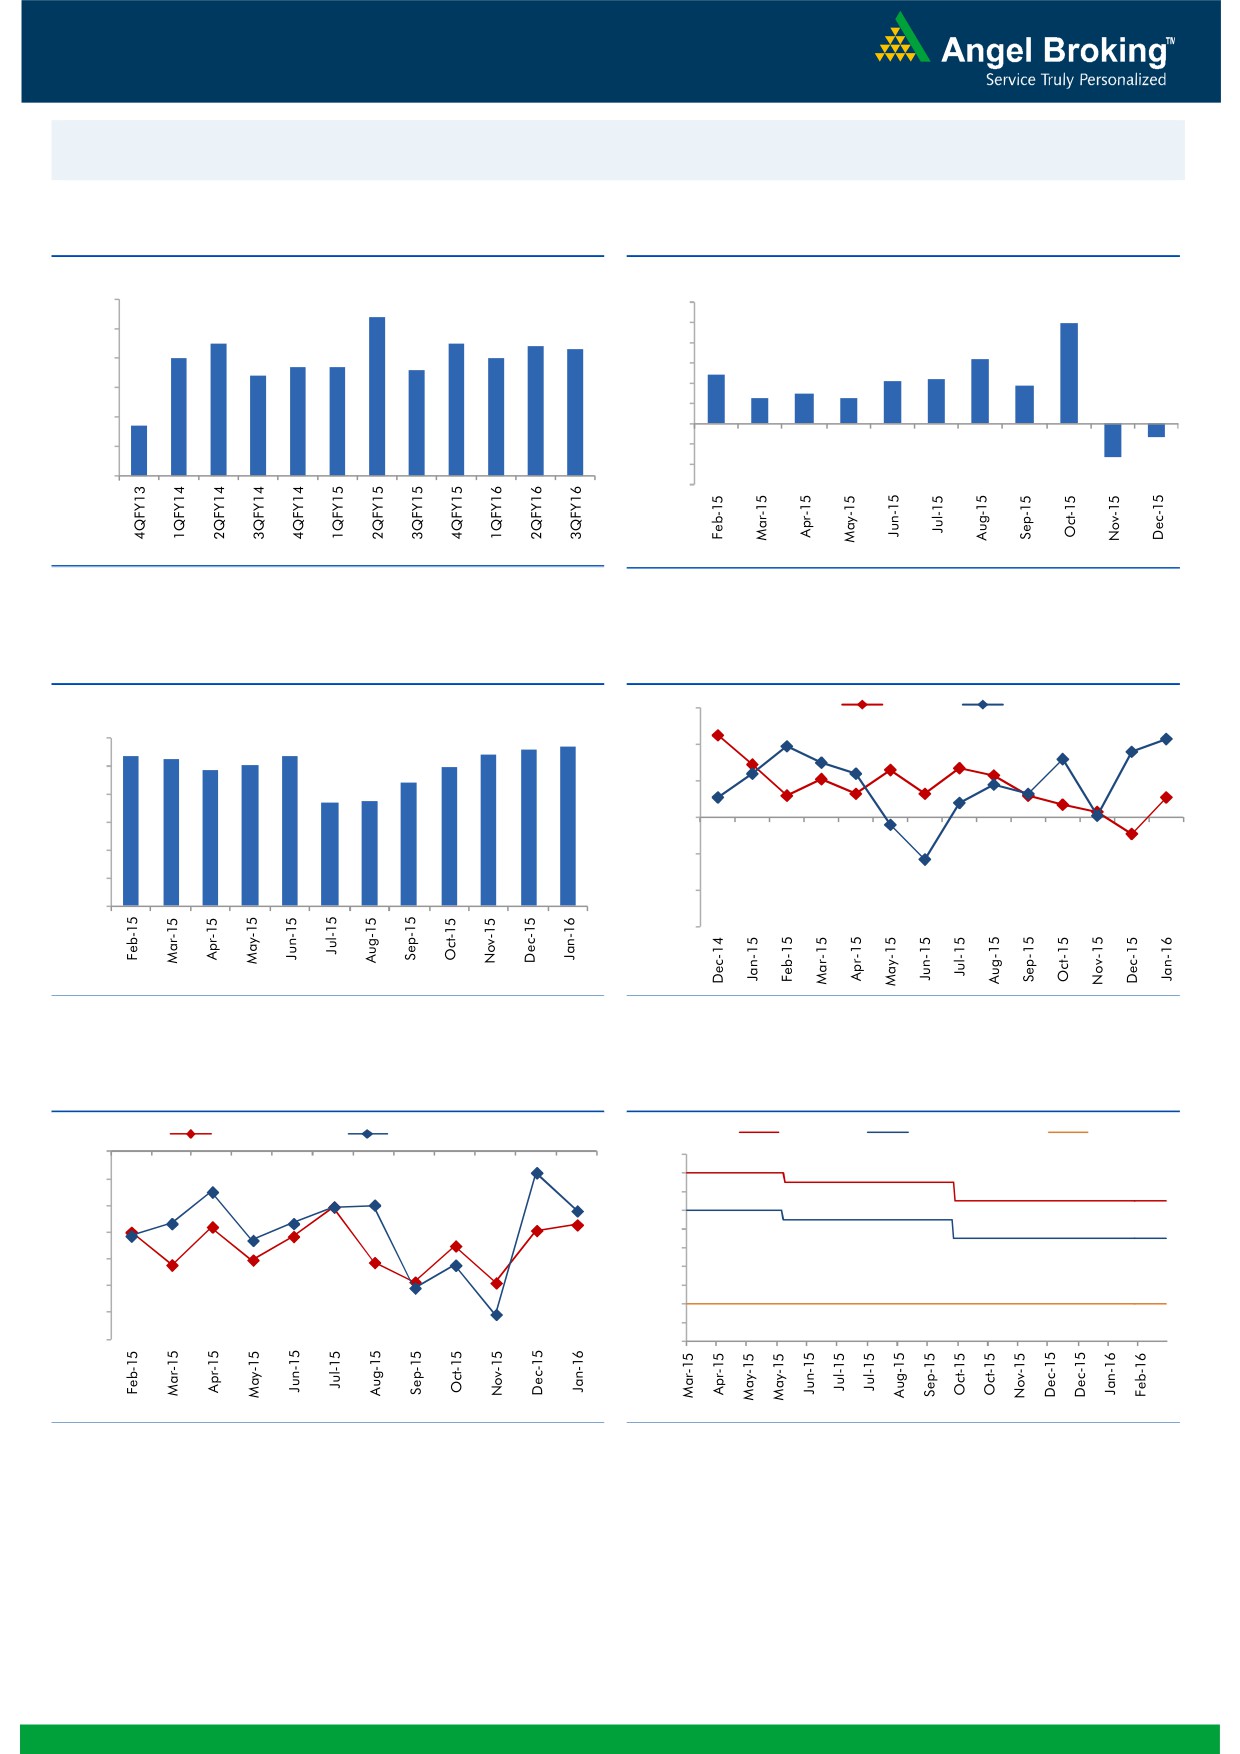
Macro watch
Exhibit 1: Quarterly GDP trends
Exhibit 2: IIP trends
(%)
(%)
9.0
8.4
12.0
9.9
7.5
7.5
10.0
8.0
7.4
7.3
7.0
7.0
8.0
6.3
6.7
6.7
6.6
7.0
6.4
6.0
4.8
4.2
4.3
3.7
3.0
4.0
2.5
2.5
6.0
2.0
4.7
5.0
-
4.0
(2.0)
(1.3)
(4.0)
3.0
(3.4)
(6.0)
Source: CSO, Angel Research
Source: MOSPI, Angel Research
Exhibit 3: Monthly CPI inflation trends
Exhibit 4: Manufacturing and services PMI
(%)
56.0
Mfg. PMI
Services PMI
5.6
5.7
6.0
5.4
5.4
5.4
5.3
54.0
4.9
5.0
5.0
5.0
4.4
52.0
3.7
3.7
4.0
50.0
3.0
2.0
48.0
1.0
46.0
-
44.0
Source: MOSPI, Angel Research
Source: Market, Angel Research; Note: Level above 50 indicates expansion
Exhibit 5: Exports and imports growth trends
Exhibit 6: Key policy rates
(%)
Exports yoy growth
Imports yoy growth
(%)
Repo rate
Reverse Repo rate
CRR
0.0
8.00
7.50
(5.0)
7.00
(10.0)
6.50
(15.0)
6.00
5.50
(20.0)
5.00
(25.0)
4.50
4.00
(30.0)
3.50
(35.0)
3.00
Source: Bloomberg, Angel Research
Source: RBI, Angel Research
Market Outlook
February 25, 2016
Global watch
Exhibit 1: Latest quarterly GDP Growth (%, yoy) across select developing and developed countries
(%)
8.0
6.8
5.3
6.0
5.0
4.7
4.0
2.9
1.9
1.8
1.8
1.3
1.6
2.0
1.0
(4.5)
(4.1)
-
(2.0)
(4.0)
(6.0)
Source: Bloomberg, Angel Research
Exhibit 2: 2015 GDP Growth projection by IMF (%, yoy) across select developing and developed countries
(%)
7.3
8.0
6.8
6.0
4.7
4.7
4.0
2.5
2.5
2.6
1.4
1.5
2.0
1.2
0.6
(3.0)
(3.8)
-
(2.0)
(4.0)
(6.0)
Source: IMF, Angel Research
Exhibit 3: One year forward P-E ratio across select developing and developed countries
(x)
20.0
18.0
16.0
14.0
12.0
10.0
8.0
6.0
4.0
2.0
-
Source: IMF, Angel Research
Market Outlook
February 25, 2016
Exhibit 4: Relative performance of indices across globe
Returns (%)
Country
Name of index
Closing price
1M
3M
1YR
Brazil
Bovespa
42,085
11.8
(10.2)
(15.0)
Russia
Micex
1,797
4.6
(0.8)
0.3
India
Nifty
7,019
(5.4)
(10.6)
(20.5)
China
Shanghai Composite
2,929
(3.8)
(20.0)
(7.9)
South Africa
Top 40
42,453
0.1
(9.5)
(10.0)
Mexico
Mexbol
43,174
3.7
(3.6)
(1.7)
Indonesia
LQ45
811
3.5
4.6
(13.3)
Malaysia
KLCI
1,664
2.1
0.2
(7.6)
Thailand
SET 50
851
7.3
(4.2)
(20.5)
USA
Dow Jones
16,485
2.4
(7.0)
(9.5)
UK
FTSE
5,867
(0.2)
(7.0)
(15.6)
Japan
Nikkei
15,916
(6.1)
(19.0)
(11.6)
Germany
DAX
9,168
(5.8)
(17.6)
(19.1)
France
CAC
4,155
(3.6)
(13.8)
(14.7)
Source: Bloomberg, Angel Research
Stock Watch
February 25, 2016
Company Name
Reco
CMP
Target
Mkt Cap
Sales ( Čcr )
OPM(%)
EPS (Č)
PER(x)
P/BV(x)
RoE(%)
EV/Sales(x)
(Č)
Price ( Č)
( Č cr )
FY16E FY17E
FY16E
FY17E
FY16E
FY17E
FY16E
FY17E
FY16E
FY17E
FY16E
FY17E
FY16E
FY17E
Agri / Agri Chemical
Rallis
Neutral
148
-
2,872
2,097
2,415
14.4
14.4
9.5
11.0
15.6
13.4
3.1
2.7
21.1
21.3
1.4
1.2
United Phosphorus
Buy
379
480
16,240
12,500
14,375
18.3
18.3
29.8
35.9
12.7
10.6
2.4
2.0
20.0
20.3
1.4
1.1
Auto & Auto Ancillary
Ashok Leyland
Buy
88
111
24,901
17,995
21,544
11.4
11.6
3.4
4.7
25.7
18.6
4.5
4.2
17.7
22.2
1.3
1.1
Bajaj Auto
Accumulate
2,345
2,585
67,846
22,709
25,860
20.9
20.1
129.0
143.6
18.2
16.3
5.6
4.8
30.7
29.4
2.5
2.2
Bharat Forge
Buy
760
943
17,689
7,867
8,881
20.0
20.3
34.4
41.0
22.1
18.5
4.3
3.6
21.1
20.9
2.4
2.1
Eicher Motors
Neutral
19,095
-
51,863
15,556
16,747
15.5
17.3
464.8
597.5
41.1
32.0
15.0
11.0
36.2
34.3
3.3
3.0
Gabriel India
Buy
79
101
1,135
1,415
1,544
8.7
9.0
4.6
5.4
17.2
14.6
3.1
2.8
18.1
18.9
0.8
0.7
Hero Motocorp
Accumulate
2,623
2,864
52,387
28,244
30,532
15.5
15.9
156.7
168.5
16.7
15.6
6.7
5.7
39.9
36.4
1.7
1.5
Jamna Auto Industries Buy
124
160
992
1,281
1,473
11.2
11.5
7.6
9.2
16.4
13.5
4.1
3.4
25.4
25.2
0.8
0.7
L G Balakrishnan & Bros Neutral
416
-
653
1,254
1,394
11.6
11.8
35.9
41.7
11.6
10.0
1.6
1.4
13.5
13.8
0.6
0.6
Mahindra and Mahindra Accumulate
1,218
1,364
75,677
38,416
42,904
13.7
13.9
54.8
63.4
22.2
19.2
3.4
3.0
15.4
15.8
1.6
1.4
Maruti
Neutral
3,490
-
105,421
57,865
68,104
16.4
16.7
176.3
225.5
19.8
15.5
3.8
3.3
19.4
21.2
1.6
1.3
Minda Industries
Buy
749
1,047
1,188
2,523
2,890
8.7
9.0
55.0
65.4
13.6
11.5
2.6
2.1
19.3
18.7
0.6
0.5
Motherson Sumi
Buy
212
313
28,042
39,343
45,100
8.8
9.1
10.1
12.5
21.0
17.0
6.7
5.2
35.3
34.4
0.8
0.7
Rane Brake Lining
Buy
351
465
277
454
511
11.5
12.0
25.2
31.0
13.9
11.3
2.1
1.9
14.9
16.6
0.7
0.7
Setco Automotive
Neutral
31
-
410
594
741
12.7
13.7
1.7
3.2
18.1
9.6
1.9
1.6
10.4
16.9
1.1
0.9
Tata Motors
Buy
307
371
88,608
259,686
273,957
13.0
13.4
25.9
29.5
11.9
10.4
1.6
1.4
8.0
9.0
0.5
0.5
TVS Motor
Buy
270
330
12,844
11,263
13,122
6.9
8.5
9.2
15.0
29.4
18.0
6.7
5.3
22.7
29.6
1.1
0.9
Amara Raja Batteries
Buy
883
1,040
15,085
4,892
5,871
17.4
17.6
28.8
37.1
30.7
23.8
7.2
5.7
23.4
24.1
3.0
2.5
Exide Industries
Buy
128
162
10,893
6,950
7,784
14.4
14.8
6.6
7.3
19.4
17.6
2.5
2.2
12.6
12.8
1.3
1.2
Apollo Tyres
Accumulate
162
183
8,223
12,056
12,714
17.2
16.4
23.0
20.3
7.0
8.0
1.2
1.1
17.7
13.6
0.7
0.8
Ceat
Buy
930
1,119
3,762
6,041
6,597
14.1
13.7
99.5
111.9
9.4
8.3
1.8
1.5
19.6
18.5
0.8
0.7
JK Tyres
Neutral
77
-
1,748
7,446
7,669
15.2
14.0
19.6
18.4
3.9
4.2
1.0
0.8
25.2
19.5
0.6
0.5
Swaraj Engines
Accumulate
807
919
1,002
552
630
14.2
14.7
44.6
54.1
18.1
14.9
4.2
3.8
23.2
25.6
1.7
1.4
Subros
Neutral
81
-
484
1,293
1,527
11.8
11.9
4.2
6.7
19.2
12.0
1.5
1.3
7.7
11.5
0.7
0.6
Indag Rubber
Neutral
150
-
394
283
329
17.0
17.2
13.0
15.4
11.6
9.7
2.5
2.1
21.8
21.6
1.1
0.9
Capital Goods
ACE
Neutral
37
-
367
660
839
4.7
8.2
1.0
3.9
37.1
9.5
1.2
1.0
3.2
11.3
0.7
0.6
BEML
Accumulate
1,018
1,157
4,239
3,277
4,006
6.0
8.9
36.2
64.3
28.1
15.8
2.0
1.8
5.7
11.7
1.4
1.1
Bharat Electronics
Buy
1,091
1,414
26,184
7,737
8,634
16.8
17.2
54.0
61.5
20.2
17.7
2.9
2.6
39.3
45.6
2.5
2.1
Stock Watch
February 25, 2016
Company Name
Reco
CMP
Target
Mkt Cap
Sales ( Čcr )
OPM(%)
EPS (Č)
PER(x)
P/BV(x)
RoE(%)
EV/Sales(x)
(Č)
Price ( Č)
( Č cr )
FY16E
FY17E
FY16E
FY17E
FY16E
FY17E
FY16E
FY17E
FY16E
FY17E
FY16E
FY17E
FY16E
FY17E
Capital Goods
Voltas
Buy
233
353
7,715
5,363
5,963
8.0
9.1
11.0
13.8
21.2
16.9
3.3
2.9
16.2
17.9
1.4
1.2
BGR Energy
Neutral
95
-
688
3,615
3,181
9.5
9.4
16.7
12.4
5.7
7.7
0.5
0.5
10.0
7.0
0.6
0.8
BHEL
Neutral
94
-
22,910
33,722
35,272
10.8
11.7
10.5
14.2
8.9
6.6
0.7
0.6
7.0
9.0
0.8
0.7
Blue Star
Buy
319
439
2,872
3,548
3,977
6.3
6.9
13.7
17.2
23.3
18.6
5.9
3.8
26.1
25.4
0.9
0.8
Crompton Greaves
Neutral
135
-
8,445
13,484
14,687
4.9
6.2
4.5
7.1
29.9
19.0
2.1
2.0
7.2
10.8
0.8
0.7
Greaves Cotton
Neutral
118
-
2,885
1,655
1,755
16.6
16.8
7.4
7.8
16.0
15.2
3.2
3.0
21.1
20.6
1.7
1.6
Inox Wind
Buy
227
458
5,042
4,980
5,943
17.0
17.5
26.6
31.6
8.5
7.2
2.6
1.9
35.0
30.0
1.2
0.9
KEC International
Neutral
103
-
2,651
8,791
9,716
6.1
6.8
5.4
8.2
19.1
12.6
1.9
1.8
10.0
14.0
0.5
0.5
Thermax
Neutral
749
-
8,924
6,413
7,525
7.4
8.5
30.5
39.3
24.6
19.1
3.8
3.3
15.0
17.0
1.4
1.1
Cement
ACC
Neutral
1,234
-
23,160
13,151
14,757
16.4
18.3
63.9
83.4
19.3
14.8
2.5
2.3
13.3
16.1
1.6
1.3
Ambuja Cements
Neutral
191
-
29,649
11,564
12,556
19.4
20.7
8.9
10.1
21.5
18.9
2.7
2.6
12.8
13.8
2.2
2.0
HeidelbergCement
Neutral
64
-
1,449
1,772
1,926
13.3
15.4
1.0
3.0
64.0
21.3
1.6
1.5
2.6
7.9
1.4
1.2
India Cements
Neutral
71
-
2,167
4,216
4,840
18.0
19.5
4.0
9.9
17.6
7.1
0.7
0.7
4.0
9.5
0.8
0.7
JK Cement
Buy
484
605
3,383
3,661
4,742
10.1
15.8
7.5
28.5
64.5
17.0
1.9
1.7
7.5
22.9
1.4
1.0
J K Lakshmi Cement
Neutral
264
-
3,107
2,947
3,616
16.7
19.9
11.5
27.2
23.0
9.7
2.2
1.9
9.8
20.8
1.5
1.2
Mangalam Cements
Neutral
162
-
431
1,053
1,347
10.5
13.3
8.4
26.0
19.2
6.2
0.8
0.8
4.3
12.5
0.8
0.6
Orient Cement
Neutral
136
-
2,785
1,854
2,524
21.2
22.2
7.7
11.1
17.7
12.3
2.5
2.2
13.3
15.7
2.2
1.6
Ramco Cements
Neutral
363
-
8,649
4,036
4,545
20.8
21.3
15.1
18.8
24.1
19.3
2.9
2.6
12.9
14.3
2.7
2.3
Shree Cement^
Neutral
10,465
-
36,456
7,150
8,742
26.7
28.6
228.0
345.5
45.9
30.3
6.8
5.7
15.7
20.3
4.9
3.9
UltraTech Cement
Accumulate
2,796
3,107
76,722
24,669
29,265
18.2
20.6
82.0
120.0
34.1
23.3
3.7
3.2
11.3
14.7
3.2
2.7
Construction
ITNL
Neutral
66
-
2,179
7,360
8,825
34.0
35.9
7.0
9.0
9.5
7.4
0.3
0.3
3.2
3.7
3.7
3.6
KNR Constructions
Buy
453
603
1,275
937
1,470
14.3
14.0
44.2
38.6
10.3
11.7
2.1
1.8
15.4
15.4
1.4
0.9
Larsen & Toubro
Buy
1,113
1,310
103,697
58,870
65,708
8.3
10.3
42.0
53.0
26.5
21.0
1.8
1.7
8.8
11.2
2.0
1.8
Gujarat Pipavav Port
Neutral
154
-
7,452
629
684
51.0
52.2
6.4
5.9
24.1
26.1
3.2
2.9
15.9
12.7
11.5
10.4
MBL Infrastructures
Buy
124
285
515
2,313
2,797
12.2
14.6
19.0
20.0
6.5
6.2
0.7
0.6
11.3
10.6
0.9
0.8
Nagarjuna Const.
Neutral
64
-
3,555
7,892
8,842
8.8
9.1
3.0
5.3
21.3
12.1
1.1
1.0
5.0
8.5
0.7
0.6
PNC Infratech
Accumulate
494
558
2,532
1,873
2,288
13.2
13.5
24.0
32.0
20.6
15.4
2.0
1.8
12.1
12.3
1.5
1.2
Simplex Infra
Neutral
216
-
1,070
5,955
6,829
10.3
10.5
16.0
31.0
13.5
7.0
0.7
0.7
5.3
9.9
0.7
0.6
Power Mech Projects
Neutral
568
-
836
1,539
1,801
12.8
12.7
59.0
72.1
9.6
7.9
1.5
1.2
18.6
16.8
0.6
0.5
Stock Watch
February 25, 2016
Company Name
Reco
CMP
Target
Mkt Cap
Sales ( Čcr )
OPM(%)
EPS (Č)
PER(x)
P/BV(x)
RoE(%)
EV/Sales(x)
(Č)
Price ( Č)
( Č cr )
FY16E
FY17E
FY16E
FY17E
FY16E
FY17E
FY16E
FY17E
FY16E
FY17E
FY16E
FY17E
FY16E
FY17E
Construction
Sadbhav Engineering
Buy
217
289
3,724
3,481
4,219
10.7
10.8
8.2
11.7
26.5
18.6
2.5
2.2
10.3
13.5
1.3
1.1
NBCC
Buy
872
1,089
10,462
5,816
7,382
6.9
7.7
29.6
39.8
29.5
21.9
5.3
4.2
24.1
26.7
1.5
1.2
MEP Infra
Neutral
39
-
628
1,956
1,876
28.1
30.5
1.3
3.0
29.7
12.9
6.2
4.2
21.2
32.8
1.7
1.7
SIPL
Neutral
80
-
2,818
675
1,042
62.4
64.7
-
-
3.0
3.4
-
-
15.8
10.7
Financials
Allahabad Bank
Neutral
44
-
2,612
8,569
9,392
2.8
2.9
16.3
27.5
2.7
1.6
0.3
0.2
7.6
11.9
-
-
Axis Bank
Buy
387
494
92,019
26,473
31,527
3.5
3.6
35.7
43.5
10.8
8.9
1.8
1.6
17.9
18.9
-
-
Bank of Baroda
Neutral
134
-
30,818
18,485
21,025
1.9
2.0
13.5
21.1
9.9
6.3
0.8
0.7
7.3
10.6
-
-
Bank of India
Neutral
86
-
6,958
15,972
17,271
1.9
2.0
15.3
33.4
5.6
2.6
0.3
0.2
3.6
7.6
-
-
Canara Bank
Neutral
163
-
8,864
15,441
16,945
2.0
2.1
46.6
70.4
3.5
2.3
0.3
0.3
8.0
11.2
-
-
Dena Bank
Neutral
27
-
1,739
3,440
3,840
2.1
2.3
7.3
10.0
3.7
2.7
0.3
0.2
6.1
7.9
-
-
Federal Bank
Neutral
46
-
7,953
3,477
3,999
3.0
3.0
5.0
6.2
9.2
7.4
0.9
0.8
10.6
11.9
-
-
HDFC
Neutral
1,023
-
161,512
10,358
11,852
3.3
3.3
41.1
47.0
24.9
21.8
4.7
4.3
24.7
24.9
-
-
HDFC Bank
Buy
950
1,262
239,853
38,309
47,302
4.3
4.3
49.3
61.1
19.3
15.6
3.3
2.9
18.5
19.7
-
-
ICICI Bank
Buy
187
254
108,729
34,279
39,262
3.3
3.3
21.0
24.4
8.9
7.7
1.5
1.3
14.4
14.7
-
-
IDBI Bank
Neutral
56
-
10,716
9,625
10,455
1.8
1.8
8.5
14.2
6.6
4.0
0.4
0.4
5.9
9.3
-
-
Indian Bank
Neutral
81
-
3,898
6,160
6,858
2.5
2.5
24.5
29.8
3.3
2.7
0.3
0.2
7.7
8.6
-
-
LIC Housing Finance
Buy
399
592
20,146
3,101
3,745
2.5
2.5
33.0
40.2
12.1
9.9
2.3
1.9
19.7
20.5
-
-
Oriental Bank
Neutral
81
-
2,430
7,643
8,373
2.4
2.4
37.2
45.4
2.2
1.8
0.2
0.2
8.2
9.4
-
-
Punjab Natl.Bank
Neutral
72
-
14,177
23,638
26,557
2.8
2.8
17.9
27.2
4.0
2.7
0.4
0.3
8.5
12.0
-
-
South Ind.Bank
Neutral
17
-
2,255
1,965
2,185
2.5
2.5
2.5
3.3
6.7
5.1
0.7
0.6
9.5
11.7
-
-
St Bk of India
Accumulate
157
177
121,643
79,958
86,061
2.6
2.6
13.4
20.7
11.7
7.6
1.0
0.9
11.5
12.8
-
-
Union Bank
Neutral
112
-
7,717
12,646
14,129
2.3
2.4
31.0
39.1
3.6
2.9
0.4
0.3
9.8
11.4
-
-
Vijaya Bank
Neutral
30
-
2,612
3,536
3,827
1.9
1.9
5.5
6.7
5.5
4.6
0.5
0.4
7.8
8.8
-
-
Yes Bank
Accumulate
690
767
28,975
7,190
9,011
3.2
3.3
58.2
69.7
11.8
9.9
2.1
1.8
19.2
19.6
-
-
FMCG
Asian Paints
Neutral
879
-
84,313
16,553
19,160
16.0
16.2
17.7
21.5
49.7
40.9
13.2
11.9
29.4
31.2
4.9
4.3
Britannia
Neutral
2,753
-
33,026
8,481
9,795
14.0
14.1
65.5
78.3
42.0
35.2
19.9
16.3
38.3
41.2
3.8
3.3
Colgate
Neutral
817
-
22,219
4,836
5,490
19.5
19.7
48.5
53.2
16.8
15.4
12.4
10.8
99.8
97.5
4.5
3.9
Dabur India
Accumulate
236
267
41,577
9,370
10,265
17.1
17.2
7.3
8.1
32.2
29.2
9.7
7.9
33.7
30.6
4.3
4.0
GlaxoSmith Con*
Accumulate
5,600
6,118
23,553
4,919
5,742
17.2
17.4
168.3
191.2
33.3
29.3
9.4
8.0
28.8
28.9
4.4
3.7
Stock Watch
February 25, 2016
Company Name
Reco
CMP
Target
Mkt Cap
Sales ( Čcr )
OPM(%)
EPS (Č)
PER(x)
P/BV(x)
RoE(%)
EV/Sales(x)
(Č)
Price ( Č)
( Č cr )
FY16E FY17E
FY16E
FY17E
FY16E
FY17E
FY16E
FY17E
FY16E
FY17E
FY16E
FY17E
FY16E
FY17E
FMCG
Godrej Consumer
Neutral
1,177
-
40,071
10,168
12,886
16.1
16.1
32.1
38.4
36.7
30.6
7.5
6.9
19.7
21.0
4.0
3.2
HUL
Neutral
837
-
181,084
34,940
38,957
17.5
17.7
20.8
24.7
40.2
33.9
44.8
35.8
110.5
114.2
5.0
4.5
ITC
Buy
287
359
230,859
36,804
38,776
37.9
37.9
12.2
12.9
23.5
22.3
6.5
5.8
27.7
25.8
5.8
5.5
Marico
Neutral
237
-
30,545
6,551
7,766
15.7
16.0
10.4
12.5
22.8
18.9
6.6
5.5
33.2
32.4
4.6
3.9
Nestle*
Buy
5,200
6,646
50,136
11,291
12,847
22.2
22.3
158.9
184.6
32.7
28.2
17.1
15.4
55.0
57.3
4.3
3.7
Tata Global
Buy
107
144
6,734
8,635
9,072
9.8
9.9
6.5
7.6
16.4
14.0
1.6
1.6
6.8
7.4
0.7
0.7
IT
HCL Tech^
Buy
810
1,038
114,248
42,038
47,503
21.2
21.5
51.5
57.7
15.7
14.0
3.4
2.6
21.5
18.8
2.3
1.9
Infosys
Buy
1,125
1,347
258,498
61,850
69,981
27.5
27.5
59.4
65.7
19.0
17.1
4.0
3.4
21.2
20.1
3.5
2.9
TCS
Buy
2,219
2,854
437,169
108,487
122,590
28.3
28.5
122.8
138.4
18.1
16.0
6.9
6.2
38.0
38.9
3.6
3.2
Tech Mahindra
Buy
421
530
40,758
26,524
29,177
16.2
17.0
28.8
33.6
14.6
12.5
2.8
2.4
19.3
19.1
1.3
1.1
Wipro
Buy
534
680
131,953
50,808
56,189
23.7
23.8
37.3
40.7
14.3
13.1
2.7
2.5
19.2
17.7
2.1
1.7
Media
D B Corp
Buy
306
356
5,624
2,241
2,495
27.8
27.9
21.8
25.6
14.1
12.0
3.7
3.2
26.7
28.5
2.5
2.2
HT Media
Neutral
80
-
1,868
2,495
2,603
11.2
11.2
7.3
8.6
11.0
9.3
0.9
0.8
7.4
8.1
0.3
0.2
Jagran Prakashan
Buy
150
189
4,909
2,170
2,355
27.2
26.2
8.9
9.9
16.9
15.2
3.5
3.1
20.9
20.5
2.2
2.0
Sun TV Network
Neutral
324
-
12,757
2,779
3,196
70.2
70.5
22.8
27.3
14.2
11.9
3.5
3.2
26.7
28.3
4.3
3.8
Hindustan Media
Neutral
260
-
1,908
920
1,031
20.0
20.0
19.2
20.9
13.5
12.5
2.2
1.9
16.4
15.3
1.6
1.4
Ventures
Metals & Mining
Coal India
Buy
296
380
186,712
76,167
84,130
19.9
22.3
22.4
25.8
13.2
11.5
4.8
4.6
35.5
41.0
1.8
1.6
Hind. Zinc
Accumulate
164
175
69,190
14,641
14,026
50.4
50.4
17.7
16.0
9.3
10.2
1.4
1.3
16.2
13.2
2.3
2.2
Hindalco
Neutral
66
-
13,712
104,356
111,186
8.7
9.5
6.7
11.1
9.9
6.0
0.4
0.3
3.5
5.9
0.7
0.6
JSW Steel
Neutral
1,109
-
26,805
42,308
45,147
16.4
20.7
(10.3)
49.5
22.4
1.2
1.2
(1.0)
5.6
1.7
1.6
NMDC
Neutral
81
-
31,916
8,237
10,893
46.6
44.5
10.0
11.7
8.1
6.9
0.9
0.8
12.5
13.0
3.7
2.8
SAIL
Neutral
35
-
14,621
45,915
53,954
7.2
10.5
1.5
4.4
23.5
8.1
0.3
0.3
2.3
4.1
1.0
0.9
Vedanta
Neutral
71
-
21,020
71,445
81,910
26.2
26.3
12.9
19.2
5.5
3.7
0.4
0.3
7.2
8.9
0.7
0.6
Tata Steel
Neutral
248
-
24,072
126,760
137,307
8.9
11.3
6.4
23.1
39.0
10.7
0.8
0.8
2.0
7.1
0.8
0.7
Oil & Gas
Cairn India
Neutral
123
-
23,023
11,323
12,490
49.4
51.0
20.7
20.7
5.9
6.0
0.4
0.4
6.4
6.1
1.1
0.5
GAIL
Neutral
314
-
39,862
64,856
70,933
9.1
9.6
24.0
28.9
13.1
10.9
1.1
1.1
8.8
9.6
0.8
0.7
ONGC
Neutral
210
-
179,537
154,564
167,321
36.8
37.4
28.6
32.5
7.3
6.5
0.9
0.9
12.7
13.5
1.4
1.3
Petronet LNG
Neutral
240
-
17,966
29,691
31,188
5.8
6.2
12.8
13.4
18.7
17.8
2.8
2.5
15.8
14.8
0.7
0.6
Indian Oil Corp
Buy
371
455
90,041
359,607
402,760
5.9
6.1
42.5
48.7
8.7
7.6
1.2
1.0
14.1
14.4
0.4
0.3
Stock Watch
February 25, 2016
Company Name
Reco
CMP
Target
Mkt Cap
Sales ( Čcr )
OPM(%)
EPS (Č)
PER(x)
P/BV(x)
RoE(%)
EV/Sales(x)
(Č)
Price ( Č)
( Č cr )
FY16E FY17E
FY16E
FY17E
FY16E
FY17E
FY16E
FY17E
FY16E
FY17E
FY16E
FY17E
FY16E
FY17E
Oil & Gas
Reliance Industries
Buy
953
1,150
308,569
304,775
344,392
12.6
13.4
91.3
102.6
10.4
9.3
1.2
1.1
11.8
12.0
0.9
0.8
Pharmaceuticals
Alembic Pharma
Neutral
614
-
11,576
3,274
3,802
26.9
19.4
35.0
28.7
17.5
21.4
7.8
5.9
55.6
31.2
3.5
2.9
Aurobindo Pharma
Buy
618
856
36,159
14,923
17,162
22.0
23.0
35.7
42.8
17.3
14.5
5.1
3.8
34.0
30.2
2.8
2.4
Aventis*
Neutral
4,280
-
9,858
2,082
2,371
17.4
20.8
118.2
151.5
36.2
28.3
5.3
4.3
19.9
25.5
4.4
3.7
Cadila Healthcare
Accumulate
322
352
32,965
10,224
11,840
21.0
22.0
14.6
17.6
22.1
18.3
6.0
4.7
30.8
29.0
3.3
2.8
Cipla
Buy
514
605
41,277
13,979
16,447
20.2
18.6
25.7
27.5
20.0
18.7
3.3
2.8
17.6
16.1
2.9
2.4
Dr Reddy's
Buy
3,013
3,933
51,390
16,838
19,575
25.0
23.1
167.5
178.8
18.0
16.9
3.8
3.2
23.1
20.4
3.0
2.5
Dishman Pharma
Neutral
305
-
2,464
1,733
1,906
21.5
21.5
17.0
19.9
18.0
15.3
1.8
1.6
10.5
11.2
1.9
1.7
GSK Pharma*
Neutral
3,205
-
27,149
2,870
3,158
20.0
22.1
59.5
68.3
53.9
46.9
15.9
16.3
28.5
34.3
9.0
8.2
Indoco Remedies
Neutral
254
-
2,338
1,033
1,199
15.9
18.2
9.4
13.6
27.0
18.7
4.0
3.4
15.7
19.7
2.3
2.0
Ipca labs
Buy
610
900
7,694
3,363
3,909
12.9
18.6
13.4
28.0
45.5
21.8
3.3
2.9
7.4
14.0
2.6
2.2
Lupin
Neutral
1,762
-
79,391
13,092
16,561
25.0
27.0
50.4
68.3
35.0
25.8
7.2
5.7
22.8
24.7
5.8
4.5
Sun Pharma
Accumulate
855
950
205,644
28,163
32,610
25.8
30.7
17.4
26.9
49.1
31.8
4.7
4.0
13.0
16.6
6.8
5.6
Power
Tata Power
Neutral
58
-
15,633
35,923
37,402
22.6
22.8
4.1
5.2
14.3
11.2
1.1
1.0
7.5
9.3
1.4
1.3
NTPC
Buy
119
146
97,874
87,271
99,297
23.5
23.5
11.8
13.3
10.1
8.9
1.1
1.1
11.5
12.2
2.1
1.9
Power Grid
Buy
140
170
73,085
20,702
23,361
86.7
86.4
12.1
13.2
11.6
10.6
1.7
1.5
15.6
15.1
8.5
7.9
Telecom
Bharti Airtel
Neutral
324
-
129,516
101,748
109,191
32.1
31.7
12.0
12.5
27.0
25.9
1.9
1.7
6.9
6.7
1.9
1.7
Idea Cellular
Neutral
105
-
37,643
34,282
36,941
32.0
31.5
5.9
6.2
17.7
16.9
1.6
1.5
9.9
9.3
1.7
1.6
zOthers
Abbott India
Neutral
4,853
-
10,313
2,715
3,153
14.5
14.1
134.3
152.2
36.2
31.9
9.0
7.4
27.4
25.6
3.5
3.0
Bajaj Electricals
Buy
162
237
1,638
4,719
5,287
5.2
5.8
8.6
12.7
19.0
12.8
2.2
1.9
11.4
14.8
0.3
0.3
Finolex Cables
Neutral
237
-
3,628
2,520
2,883
12.2
12.0
12.7
14.2
18.7
16.7
2.6
2.3
13.6
13.5
1.2
1.0
Goodyear India*
Buy
461
582
1,062
1,800
1,600
11.7
11.5
58.7
52.9
7.8
8.7
1.8
1.5
24.6
18.7
0.4
0.3
Hitachi
Neutral
1,021
-
2,777
1,779
2,081
7.8
8.8
21.8
33.4
46.8
30.6
7.6
6.1
17.4
22.1
1.6
1.4
Jyothy Laboratories
Neutral
264
-
4,780
1,620
1,847
11.5
11.5
7.3
8.5
36.2
31.2
4.7
4.3
13.3
14.4
2.8
2.4
MRF
Buy
32,714
45,575
13,875
20,316
14,488
21.4
21.1
5,488.0
3,798.0
6.0
8.6
2.0
1.7
41.1
21.2
0.6
0.8
Page Industries
Neutral
10,233
-
11,413
1,929
2,450
19.8
20.1
229.9
299.0
44.5
34.2
19.6
13.7
52.1
47.1
5.9
4.7
Relaxo Footwears
Neutral
389
-
4,671
1,767
2,152
12.3
12.5
19.3
25.1
20.2
15.5
5.0
3.8
27.7
27.8
2.7
2.2
Siyaram Silk Mills
Buy
978
1,354
917
1,636
1,815
11.5
11.5
89.9
104.1
10.9
9.4
1.8
1.6
17.9
17.8
0.7
0.6
Styrolution ABS India*
Neutral
490
-
862
1,271
1,440
8.6
9.2
32.0
41.1
15.3
11.9
1.6
1.4
10.7
12.4
0.6
0.6
Stock Watch
February 25, 2016
Company Name
Reco
CMP
Target
Mkt Cap
Sales ( Čcr )
OPM(%)
EPS (Č)
PER(x)
P/BV(x)
RoE(%)
EV/Sales(x)
(Č)
Price ( Č)
( Č cr )
FY16E
FY17E
FY16E
FY17E
FY16E
FY17E
FY16E
FY17E
FY16E
FY17E
FY16E
FY17E
FY16E
FY17E
zOthers
TVS Srichakra
Buy
2,029
3,217
1,554
2,035
2,252
15.9
15.3
248.6
268.1
8.2
7.6
3.6
2.6
43.6
33.9
0.8
0.7
HSIL
Buy
231
302
1,666
2,123
2,384
16.1
16.5
15.0
18.9
15.3
12.2
1.2
1.1
8.0
9.4
1.1
1.0
Kirloskar Engines India
Neutral
205
-
2,967
2,403
2,554
8.6
9.9
9.2
10.5
22.3
19.6
2.1
2.0
9.7
10.7
0.9
0.8
Ltd
M M Forgings
Buy
393
614
474
511
615
21.7
21.6
43.1
55.8
9.1
7.0
1.7
1.4
19.9
21.2
1.1
0.9
Banco Products (India) Neutral
93
-
663
1,208
1,353
11.0
12.3
10.8
14.5
8.6
6.4
1.0
0.9
11.9
14.5
0.5
0.4
Competent Automobiles Neutral
124
-
76
1,040
1,137
3.2
3.1
25.7
28.0
4.8
4.4
0.7
0.6
15.0
14.3
0.1
-
Nilkamal
Neutral
969
-
1,446
1,871
2,031
10.7
10.5
63.2
69.8
15.3
13.9
2.5
2.1
17.6
16.6
0.8
0.7
Visaka Industries
Buy
96
144
153
1,086
1,197
9.9
10.3
21.5
28.8
4.5
3.3
0.4
0.4
9.6
11.6
0.4
0.3
Transport Corporation of
Neutral
234
-
1,783
2,830
3,350
8.8
9.0
14.4
18.3
16.3
12.8
2.5
2.2
15.4
17.1
0.8
0.7
India
Elecon Engineering
Neutral
49
-
531
1,359
1,482
10.3
13.7
0.8
3.9
60.7
12.5
1.0
1.0
1.6
7.8
0.7
0.7
Surya Roshni
Buy
124
201
544
2,992
3,223
8.1
8.4
14.7
18.3
8.5
6.8
0.8
0.7
9.7
11.0
0.5
0.4
MT Educare
Neutral
141
-
561
286
366
18.3
17.7
7.7
9.4
18.2
15.0
3.8
3.4
20.2
21.1
1.9
1.4
Radico Khaitan
Buy
98
156
1,306
1,517
1,635
12.7
13.4
5.8
7.1
16.9
13.8
1.4
1.3
8.6
9.6
1.3
1.2
Garware Wall Ropes
Buy
288
473
631
862
974
11.2
11.2
24.9
29.6
11.6
9.8
1.8
1.5
15.1
15.4
0.7
0.6
Wonderla Holidays
Neutral
360
-
2,034
206
308
44.0
43.6
9.0
12.9
40.0
27.9
5.5
5.0
13.7
17.8
9.8
6.5
Linc Pen & Plastics
Accumulate
175
185
258
340
371
8.3
8.9
10.8
13.2
16.2
13.2
2.6
2.3
16.0
17.1
0.8
0.7
The Byke Hospitality
Neutral
152
-
609
222
287
20.5
20.5
5.6
7.6
27.0
20.1
5.1
4.2
18.9
20.8
2.8
2.1
Interglobe Aviation
Neutral
808
-
29,133
17,022
21,122
20.7
14.5
63.9
53.7
12.7
15.1
19.0
15.5
149.9
103.2
1.7
1.4
Coffee Day Enterprises
Neutral
225
-
4,637
2,692
2,964
17.0
18.6
-
4.7
-
47.5
2.8
2.6
0.2
5.5
2.1
2.0
Ltd
Navneet Education
Neutral
83
-
1,981
998
1,062
24.1
24.0
5.8
6.1
14.5
13.7
3.2
2.8
22.0
20.6
2.1
1.9
Navkar Corporation
Buy
156
265
2,226
365
436
38.3
37.5
5.6
5.9
27.7
26.6
1.7
1.6
6.3
6.1
6.9
6.0
Source: Company, Angel Research; Note: *December year end; #September year end; &October year end; Price as on February 24, 2016
Market Outlook
February 25, 2016
Research Team Tel: 022 - 39357800
DISCLAIMER
Angel Broking Private Limited (hereinafter referred to as “Angel”) is a registered Member of National Stock Exchange of India Limited,
Bombay Stock Exchange Limited and Metropolitian Stock Exchange of India Limited. It is also registered as a Depository Participant with
CDSL and Portfolio Manager with SEBI. It also has registration with AMFI as a Mutual Fund Distributor. Angel Broking Private Limited is a
registered entity with SEBI for Research Analyst in terms of SEBI (Research Analyst) Regulations, 2014 vide registration number
INH000000164. Angel or its associates has not been debarred/ suspended by SEBI or any other regulatory authority for accessing
/dealing in securities Market. Angel or its associates including its relatives/analyst do not hold any financial interest/beneficial ownership
of more than 1% in the company covered by Analyst. Angel or its associates/analyst has not received any compensation / managed or co
-managed public offering of securities of the company covered by Analyst during the past twelve months. Angel/analyst has not served as
an officer, director or employee of company covered by Analyst and has not been engaged in market making activity of the company
covered by Analyst.
This document is solely for the personal information of the recipient, and must not be singularly used as the basis of any investment
decision. Nothing in this document should be construed as investment or financial advice. Each recipient of this document should make
such investigations as they deem necessary to arrive at an independent evaluation of an investment in the securities of the companies
referred to in this document (including the merits and risks involved), and should consult their own advisors to determine the merits and
risks of such an investment.
Reports based on technical and derivative analysis center on studying charts of a stock's price movement, outstanding positions and
trading volume, as opposed to focusing on a company's fundamentals and, as such, may not match with a report on a company's
fundamentals.
The information in this document has been printed on the basis of publicly available information, internal data and other reliable sources
believed to be true, but we do not represent that it is accurate or complete and it should not be relied on as such, as this document is for
general guidance only. Angel Broking Pvt. Limited or any of its affiliates/ group companies shall not be in any way responsible for any
loss or damage that may arise to any person from any inadvertent error in the information contained in this report. Angel Broking Pvt.
Limited has not independently verified all the information contained within this document. Accordingly, we cannot testify, nor make any
representation or warranty, express or implied, to the accuracy, contents or data contained within this document. While Angel Broking
Pvt. Limited endeavors to update on a reasonable basis the information discussed in this material, there may be regulatory, compliance,
or other reasons that prevent us from doing so.
This document is being supplied to you solely for your information, and its contents, information or data may not be reproduced,
redistributed or passed on, directly or indirectly.
Neither Angel Broking Pvt. Limited, nor its directors, employees or affiliates shall be liable for any loss or damage that may arise from or
in connection with the use of this information.
Note: Please refer to the important ‘Stock Holding Disclosure' report on the Angel website (Research Section). Also, please refer to the
latest update on respective stocks for the disclosure status in respect of those stocks. Angel Broking Pvt. Limited and its affiliates may have
investment positions in the stocks recommended in this report.