Market Outlook
January 25, 2016
Market Cues
Domestic Indices
Chg (%)
(Pts)
(Close)
BSE Sensex
2.0
473
24,436
Indian markets are expected to open in the green tracking the SGX Nifty.
Nifty
2.0
146
7,422
Oil prices rallied 10% as frigid weather across U.S.A and Europe boosted the energy
Mid Cap
1.9
190
10,193
demand. Bounce back in the oil prices led to 2% rally in benchmark S&P 500, which
registered its first positive week in 2016. Energy stocks led the rally, with Exxon Mobil
Small Cap
2.2
233
10,598
ending up 3.3%. Also, S&P Energy Index .SPNY was up 4.3%. Index rally was
Bankex
2.8
482
17,625
supported by 5.3% run-up in Apple stock, ahead of its quarterly results.
FTSE 100 reported its first weekly gain in a month, as oil prices rebounded from
Global Indices
Chg (%)
(Pts)
(Close)
multiyear lows and investors cheered the prospect of more stimulus from European
Dow Jones
1.3
211
16,094
Central Bank. Amongst the key gainers were BP (up 3%), BG Group (up 5%) and
Nasdaq
2.6
119
4,591
Royal Dutch (up 5%).
FTSE
2.2
126
5,900
Indian stock markets ended up 2% on Friday, their biggest single-day % gain since
Nikkei
5.9
941
16,959
October as hints of more stimulus measures from European Central Bank lifted the
Hang Seng
2.9
538
19,081
global markets. Most of the beaten down Banking, Auto, Oil and Infra stocks saw
short covering and value buying.
Shanghai Com
1.3
36
2,917
News & Result Analysis
Advances / Declines
BSE
NSE
Inox Wind Infra Services acquires Vinirrmaa Energy
Advances
2,070
839
ONGC gets green nod for `53,000cr KG basin Infra project
Detailed analysis on Pg2
Declines
616
719
Unchanged
147
60
Investor’s Ready Reckoner
Key Domestic & Global Indicators
Volumes (` Cr)
Stock Watch: Latest investment recommendations on 150+ stocks
BSE
3,498
Refer P4 onwards
NSE
17,412
Top Picks
CMP
Target
Upside
Company
Sector
Rating
Net Inflows (` Cr)
Net
Mtd
Ytd
(`)
(`)
(%)
FII
(761)
(8,251)
7,459
Amara Raja Batteries Auto & Auto Ancillary
Buy
820
1,040
26.8
MFs
810
2,764
71,592
HCL Tech
IT
Buy
839
1,132
34.9
Larsen & Toubro
Construction
Buy
1,142
1,646
44.1
LIC Housing Finance Financials
Buy
484
592
22.3
Top Gainers
Price (`)
Chg (%)
Navkar Corporation Others
Buy
197
265
34.9
Rallis
161
12.0
More Top Picks on Pg3
Jubilant
337
8.3
Gail
367
8.0
Key Upcoming Events
Previous
Consensus
Hdil
72
7.8
Date
Region
Event Description
Reading
Expectations
Religare
308
7.7
Jan 26
USA
Consumer Confidence
96.50
97.00
Jan 27
USA
New Home Sales
490.00
500.00
Top Losers
Price (`)
Chg (%)
Jan 28
UK
GDP (YoY)
2.10
1.90
USA
FOMC rate decision
0.50
0.50
Jetairways
617
(6.4)
Idea
107
(6.2)
M&Mfin
200
(3.9)
Oberoirlty
226
(3.4)
Bhartiartl
299
(3.4)
As on January 22, 2015
Market Outlook
January 25, 2016
Inox Wind Infra Services acquires Vinirrmaa Energy
In continuation to its expansion strategy, Inox Wind Infrastructure Services Ltd, a
wholly owned subsidiary of Inox Wind, has acquired 8-year old Hyderabad based
Vinirrmaa Energy Generation Pvt. Ltd for an undisclosed amount. This acquisition
comes in to effect from January 23, 2016.
Post completion of this transaction, we expect Vinirrmaa Energy Generation Pvt.
Ltd. to have become a step down Subsidiary of Inox Wind Limited.
We expect this acquisition to be smaller in size and not have any material impact
on the financials of the company.
At current market price of `309, Inox is trading at FY2017E P/E multiple of 9.8x.
We continue to maintain BUY on the stock with target price of `458.
ONGC gets green nod for `53,000cr KG basin Infra project
ONGC has got Environmental Clearance (EC) for drilling 45 development wells
and other related infrastructure involving cost of over Rs53,000cr in the Krishna-
Godavari basin, Andhra Pradesh. This project would be implemented in northern
discovery area of NELP-I offshore block KG-DW N-98/2 that covers an area of
7,294.6 sq km and is located within 25-80 km from nearest coast.
Entire block is divided in to Northern Discovery Area (NDA), which has deep
waters with depth of up to 1,800 meters and other one is Southern Discovery Area
(SDA) which has ultra-deep waters having depth of up to 3,100 meters.
It is expected that the proposed development drilling and subsequent development
of fields would add to 51.33 bn cubic meters of gas production over 16 years
period and 26.71 mn cubic meters of oil in 12 years period.
ONGC's is expected to drill 45 development wells, set up FPSO (Floating
Production Storage and Offloading) facility, offshore fixed platform, subsea
production systems and subsea pipelines connecting landfall point to existing
onshore terminal for custody transfer to GAIL.
This is a positive development for the company and it would contribute to the
profitability in the long-run. We continue to maintain Neutral on the stock.
Economic and Political News
`60,000cr Rafale jet deal on "right track": French President Francois Hollande
Drug manufacturers urge govt. to reconsider hike in product approval fee
Coffee production to reach 3,80,600 tn in 2015-16
Corporate News
Nalco to scan sites in Iran, Qatar for smelter unit next month
Mahindra, Airbus sign pact to form JV for military helicopters
Adani-IOC, GAIL, Gujarat Gas vie for CNG licence
SC restores possession of mine to Rajasthan govt from UltraTech
Market Outlook
January 25, 2016
Top Picks
Large Cap
M
arket Cap
CM
P
T
arget
Upsid
e
Company
Rationale
(` Cr)
(`)
(`)
(%)
To outpace battery industry growth due to better technological
Amara Raja Batteries
14,007
820
1,040
26.8
products leading to market share gains in both the automotive
OEM and replacement segments.
Earnings to grow strongly given the MHCV cyclical upturn.
Ashok Leyland
24,389
86
111
29.5
Focus on exports and LCV's provides additional growth
avenue.
The stock is trading at attractive valuations and is factoring all
HCL Tech
1,18,298
839
1,132
34.9
the bad news.
Strong visibility for a robust 20% earnings trajectory, coupled
HDFC Bank
2,60,160
1,030
1,262
22.5
with high quality of earnings on account of high quality retail
business and strategic focus on highly rated corporates.
Back on the growth trend, expect a long term growth of 14%
Infosys
2,60,910
1,136
1,347
18.6
to be a US$20bn in FY2020.
Well positioned to benefit from such expected gradual
recovery in the overall domestic capex cycle, given its presence
Larsen & Toubro
1,06,345
1,142
1,646
44.1
across various infrastructure segments, its execution
capabilities, and its strong balance sheet.
LICHF continues to grow its retail loan book at a healthy pace
with improvement in asset quality. We expect the company to
LIC Housing Finance
24,423
484
592
22.3
post a healthy loan book which is likely to reflect in a strong
earnings growth.
Source: Company, Angel Research
Mid Cap
M
arket Cap
CM
P
T
arget
Upsid
e
Company
Rationale
(` Cr)
(`)
(`)
(%)
Favourable outlook for the AC industry to augur well for
Cooling products business which is out pacing the market
Blue Star
3,155
351
439
25.1
growth. EMPPAC division's profitability to improve once
operating environment turns around.
Change in business focus towards high-margin chronic &
Garware Wall Ropes
770
352
473
34.5
lifestyle segments and increasing penetration in Europe and
US
Economic recovery to have favourable impact on advertising &
circulation revenue growth. Further, the acquisition of a radio
Jagran Prakashan
5,365
164
189
15.2
business (Radio City) would also boost the company's revenue
growth.
Massive capacity expansion along with rail advantage at ICD
Navkar Corporation
2,802
197
265
34.9
as well CFS augurs well for the company
Earnings boost on back of stable material prices and
Radico Khaitan
1,489
112
156
39.3
favourable pricing environment. Valuation discount to peers
provides additional comfort
Strong brands and distribution network would boost growth
Siyaram Silk Mills
985
1,051
1,354
28.8
going ahead. Stock currently trades at an inexpensive
valuation.
Structural shift in the Lighting industry towards LED lighting will
Surya Roshni
623
142
201
41.4
drive growth.
Source: Company, Angel Research
Market Outlook
January 25, 2016
Key Upcoming Events
Result Calendar
Date
Company
Jan 25, 2016
Subros, HDFC Bank, Hindustan Media Ventures, MRF, Nilkamal
Jan 27, 2016
Colgate, Godrej Consumer, HT Media, Kirloskar Engines India Ltd, L G Balakrishnan & Bros, Power Grid Corpn
Maruti, ICICI Bank, Syndicate Bank, Dabur India, Sesa Goa, Jyothy Laboratories, Tide Water Oil India, Glenmark
Jan 28, 2016
Pharma.
United Phosphorus, TVS Motor, Siemens, Thermax, Blue Star, Yes Bank, Jagran Prakashan, PVR, JSW Steel , Banco,
Jan 29, 2016
Elecon Engineering, Indoco Remedies, NTPC
Jan 30, 2016
IDFC, Shriram Trans., Electrosteel Castings, Relaxo
Feb 1, 2016
Tech Mahindra, Transport Corporation of India
Feb 2, 2016
Amara Raja Batteries, Cummins India, Crompton Greaves
Feb 3, 2016
Mangalam Cement, Hexaware, IOC
Feb 4, 2016
Bajaj Auto, ABB, J K Lakshmi Cements, Mphasis, Tata Steel, Visaka Industries, Aventis
Feb 5, 2016
Lupin, Cadila Healthcare, Tata Power Co., PTC India
Source: Bloomberg, Angel Research
Global economic events release calendar
Date
Time
Country
Event Description
Unit
Period
Bloomberg Data
Last Reported Estimated
Jan 26, 2016
8:30PM US
Consumer Confidence
S.A./ 1985=100
Jan
96.50
96.50
Jan 27, 2016
8:30PM US
New home sales
Thousands
Dec
490.00
500.00
Jan 28, 2016
3:00PM UK
GDP (YoY)
% Change
4Q A
2.10
1.90
12:30AM US
FOMC rate decision
%
Jan 27
0.50
0.50
Jan 29, 2016
7:00PM US
GDP Qoq (Annualised)
% Change
4Q A
2.00
0.80
Feb 1, 2016
3:00PM UK
PMI Manufacturing
Value
Jan
51.90
--
6:30AM China
PMI Manufacturing
Value
Jan
49.70
49.50
Feb 2, 2016
2:25PM Germany
Unemployment change (000's)
Thousands
Jan
(14.00)
--
11:00AM India
RBI Reverse Repo rate
%
Feb 2
5.75
--
11:00AM India
RBI Repo rate
%
Feb 2
6.75
--
11:00AM India
RBI Cash Reserve ratio
%
Feb 2
4.00
--
Feb 4, 2016
5:30PM UK
BOE Announces rates
% Ratio
Feb 4
0.50
0.50
Feb 5, 2016
7:00PM US
Change in Nonfarm payrolls
Thousands
Jan
292.00
--
7:00PM US
Unnemployment rate
%
Jan
5.00
--
Source: Bloomberg, Angel Research
Market Outlook
January 25, 2016
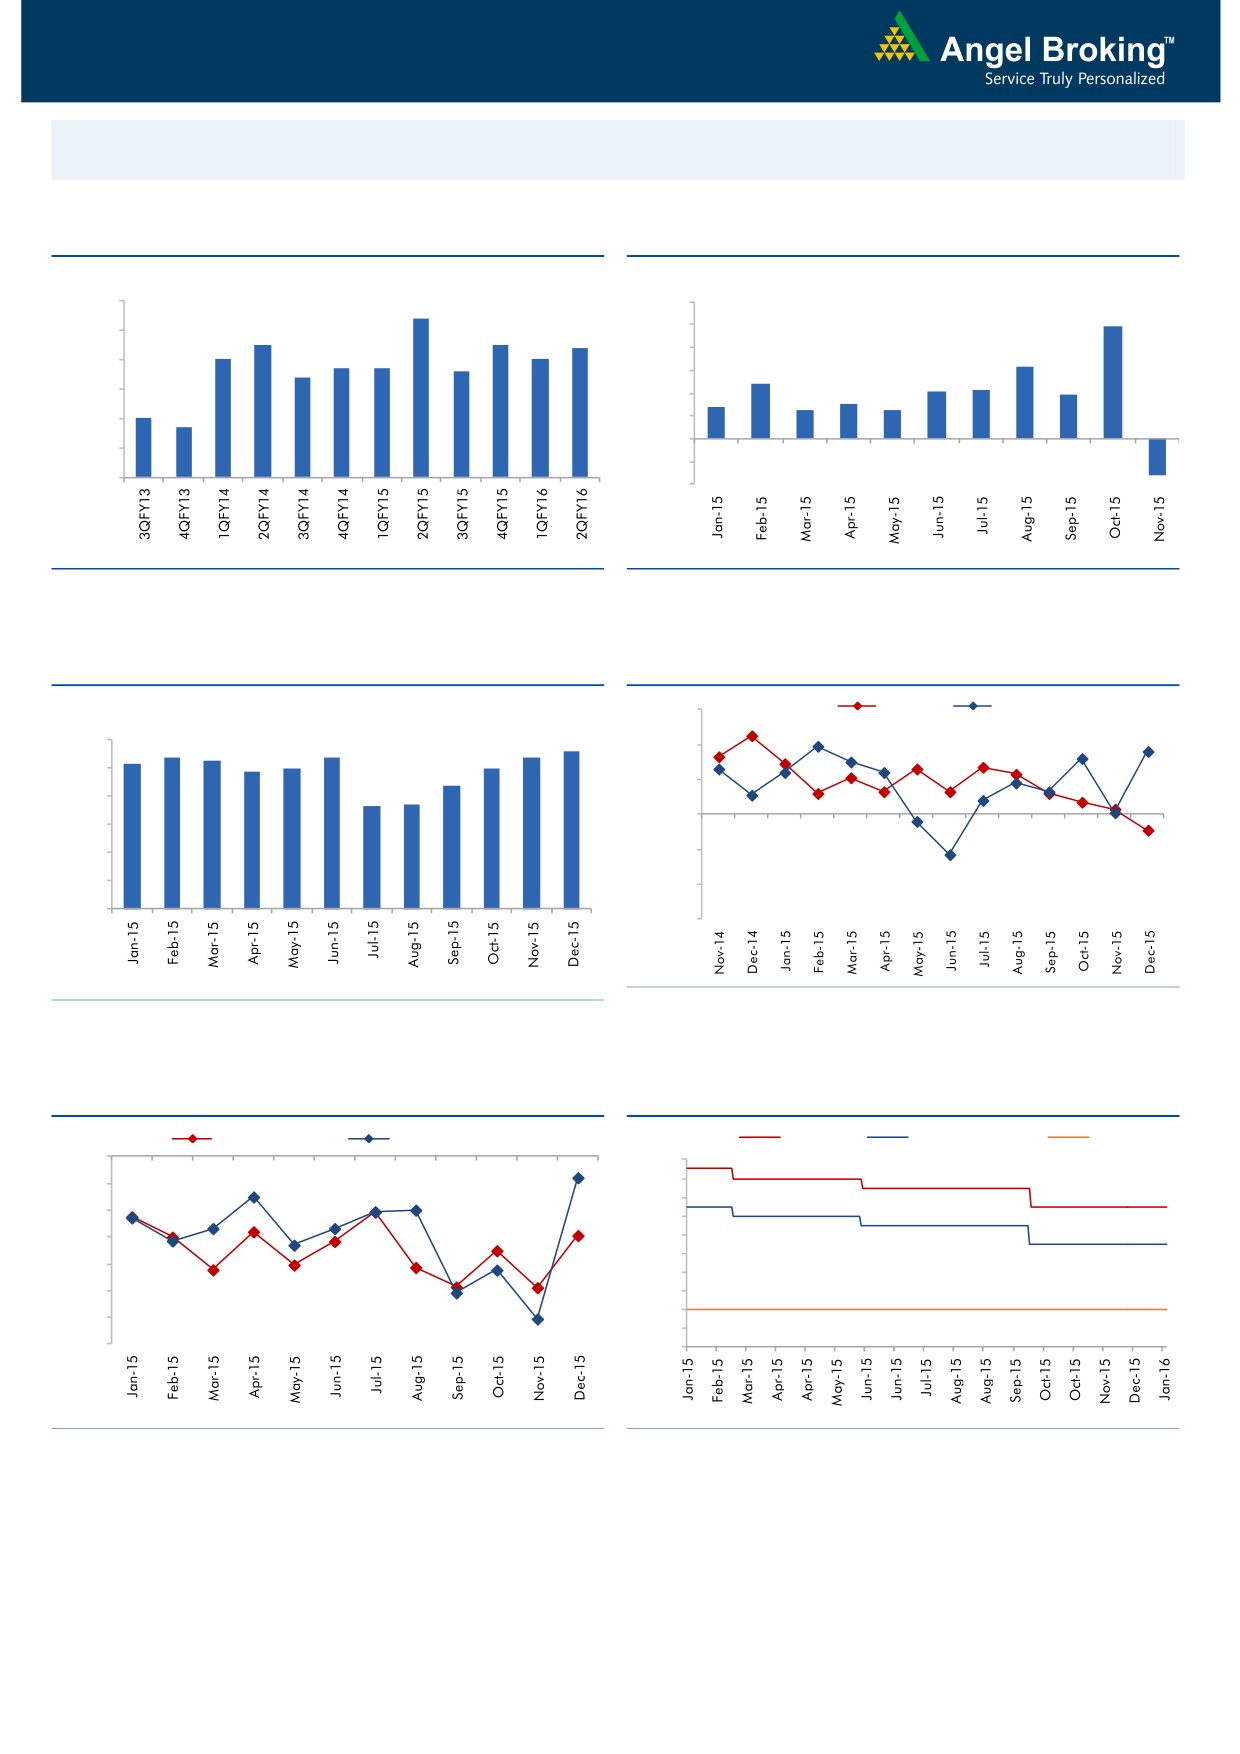
Macro watch
Exhibit 1: Quarterly GDP trends
Exhibit 2: IIP trends
(%)
(%)
9.0
8.4
12.0
9.9
7.5
7.5
10.0
8.0
7.4
7.0
7.0
6.7
6.7
8.0
6.3
6.6
7.0
6.4
6.0
4.8
4.2
4.3
3.8
6.0
2.8
3.0
4.0
2.5
2.5
5.0
4.7
5.0
2.0
-
4.0
(2.0)
3.0
(4.0)
(3.2)
Source: CSO, Angel Research
Source: MOSPI, Angel Research
Exhibit 3: Monthly CPI inflation trends
Exhibit 4: Manufacturing and services PMI
(%)
56.0
Mfg. PMI
Services PMI
5.6
6.0
5.4
5.3
5.4
5.4
54.0
5.2
5.0
5.0
4.9
5.0
4.4
52.0
3.7
3.7
4.0
50.0
3.0
2.0
48.0
1.0
46.0
-
44.0
Source: Market, Angel Research; Note: Level above 50 indicates expansion
Source: MOSPI, Angel Research
Exhibit 5: Exports and imports growth trends
Exhibit 6: Key policy rates
(%)
Exports yoy growth
Imports yoy growth
(%)
Repo rate
Reverse Repo rate
CRR
0.0
8.00
(5.0)
7.50
7.00
(10.0)
6.50
(15.0)
6.00
5.50
(20.0)
5.00
(25.0)
4.50
4.00
(30.0)
3.50
(35.0)
3.00
Source: Bloomberg, Angel Research
Source: RBI, Angel Research
Market Outlook
January 25, 2016
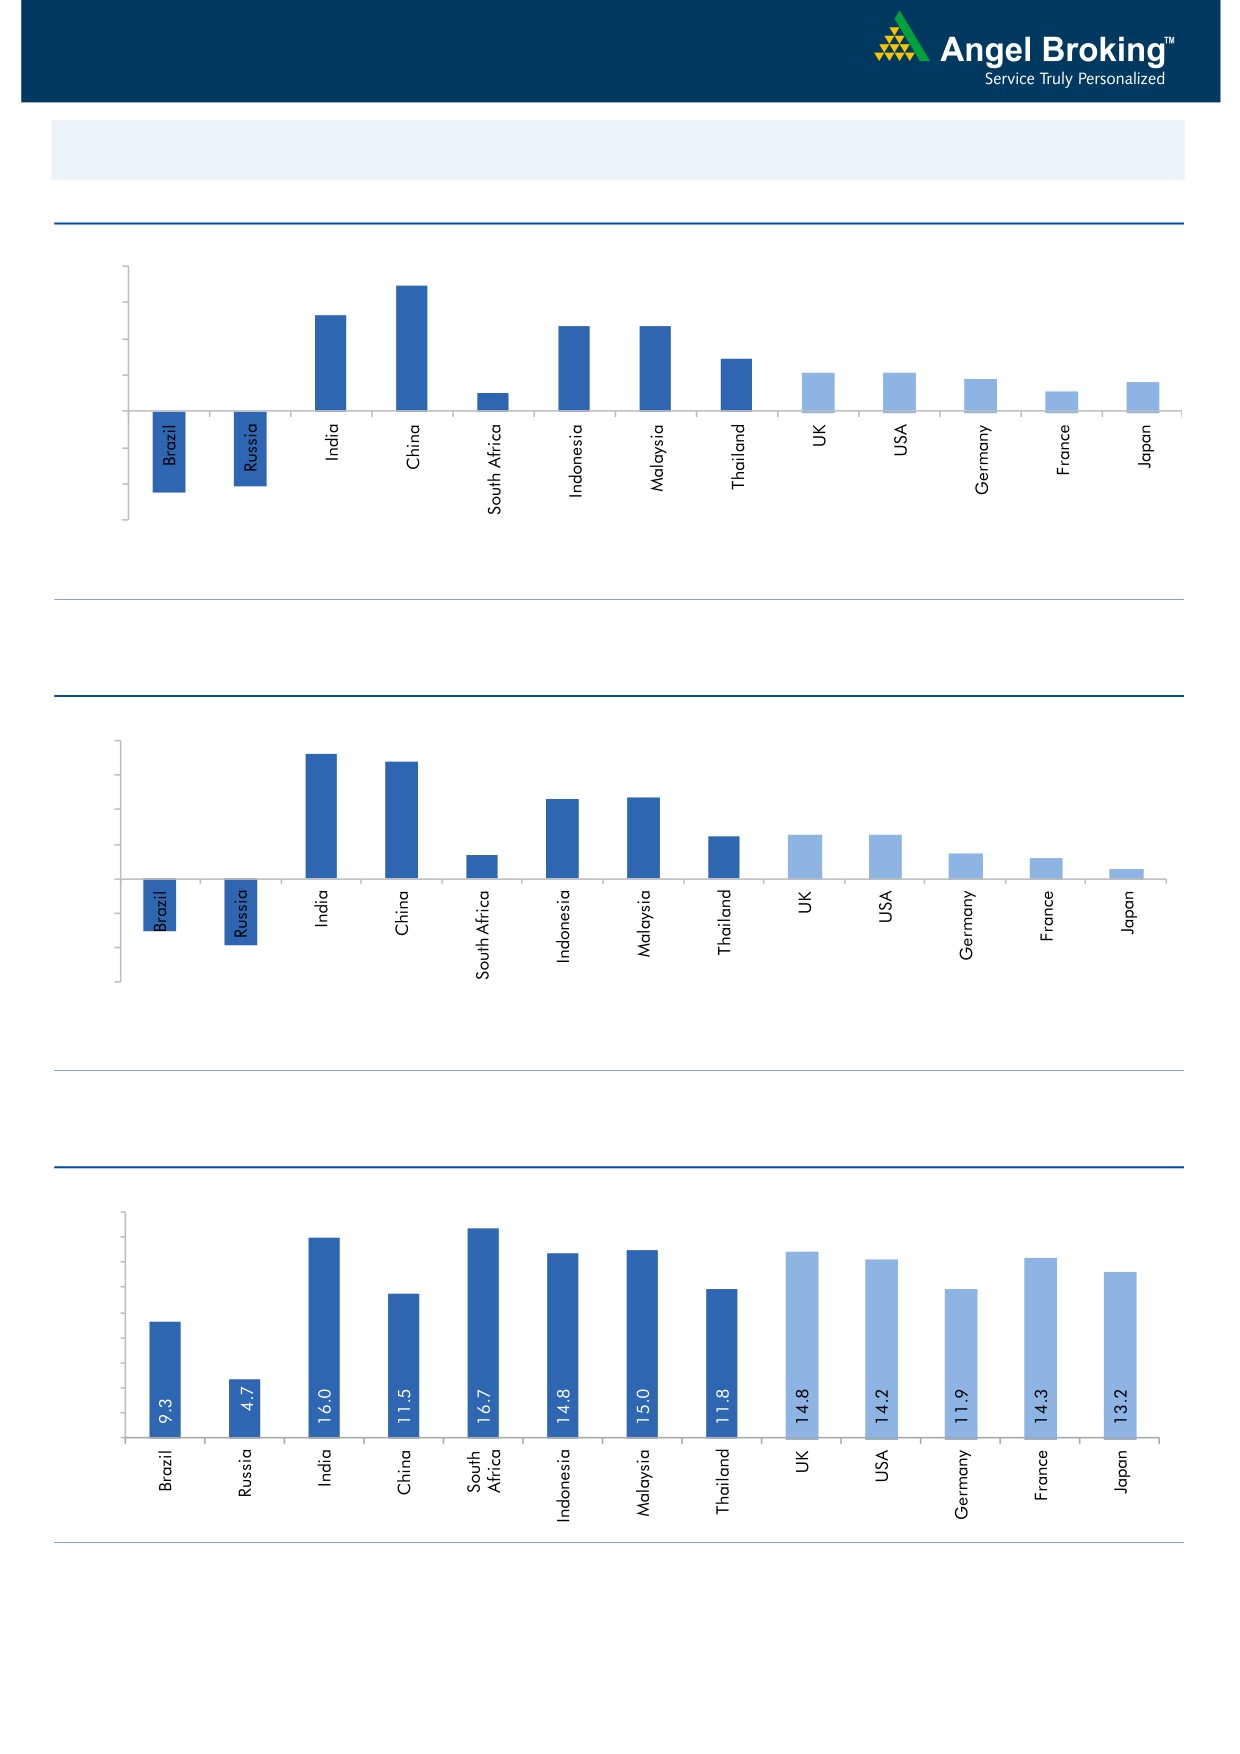
Global watch
Exhibit 1: Latest quarterly GDP Growth (%, yoy) across select developing and developed countries
(%)
8.0
6.9
5.3
6.0
4.7
4.7
4.0
2.9
2.1
2.1
1.8
2.0
1.0
1.1
1.6
-
(2.0)
(4.0)
(4.1)
(4.5)
(6.0)
Source: Bloomberg, Angel Research
Exhibit 2: 2015 GDP Growth projection by IMF (%, yoy) across select developing and developed countries
(%)
7.3
8.0
6.8
6.0
4.7
4.7
4.0
2.5
2.5
2.6
1.4
1.5
2.0
1.2
0.6
-
(2.0)
(4.0)
(3.0)
(3.8)
(6.0)
Source: IMF, Angel Research
Exhibit 3: One year forward P-E ratio across select developing and developed countries
(x)
18.0
16.0
14.0
12.0
10.0
8.0
6.0
4.0
2.0
-
Source: IMF, Angel Research
Market Outlook
January 25, 2016
Exhibit 4: Relative performance of indices across globe
Returns (%)
Country
Name of index
Closing price
1M
3M
1YR
Brazil
Bovespa
38,031
(16.1)
(19.4)
(21.6)
Russia
Micex
1,718
(6.4)
(5.9)
3.4
India
Nifty
7,422
(5.8)
(11.3)
(13.9)
China
Shanghai Composite
2,917
(19.4)
(12.9)
(9.3)
South Africa
Top 40
42,953
(7.4)
(12.8)
(3.4)
Mexico
Mexbol
41,621
(6.1)
(7.9)
(2.2)
Indonesia
LQ45
779
1.7
(0.1)
(14.4)
Malaysia
KLCI
1,625
(1.1)
(4.7)
(6.9)
Thailand
SET 50
794
(7.3)
(16.0)
(23.8)
USA
Dow Jones
16,094
(11.2)
(8.4)
(10.2)
UK
FTSE
5,900
(2.5)
(7.1)
(13.9)
Japan
Nikkei
16,959
(12.4)
(7.3)
1.0
Germany
DAX
9,765
(10.1)
(7.1)
(10.0)
France
CAC
4,337
(11.8)
(11.7)
(10.8)
Source: Bloomberg, Angel Research
Stock Watch
January 25, 2016
Company Name
Reco
CMP
Target
Mkt Cap
Sales ( Čcr )
OPM(%)
EPS (Č)
PER(x)
P/BV(x)
RoE(%)
EV/Sales(x)
(Č)
Price ( Č)
( Č cr )
FY16E FY17E
FY16E
FY17E
FY16E
FY17E
FY16E
FY17E
FY16E
FY17E
FY16E
FY17E
FY16E
FY17E
Agri / Agri Chemical
Rallis
Neutral
161
-
3,139
2,097
2,415
14.4
14.4
9.5
11.0
17.0
14.7
3.4
2.9
21.1
21.3
1.5
1.3
United Phosphorus
Buy
399
510
17,101
13,698
15,752
17.6
17.6
32.1
38.5
12.4
10.4
2.4
2.0
21.4
21.3
1.4
1.1
Auto & Auto Ancillary
Ashok Leyland
Buy
86
111
24,389
17,995
21,544
11.4
11.6
3.4
4.7
25.2
18.2
4.4
4.1
17.7
22.2
1.3
1.1
Bajaj Auto
Buy
2,318
2,728
67,064
23,695
27,298
21.3
20.4
134.6
151.5
17.2
15.3
5.5
4.7
31.8
30.6
2.4
2.0
Bharat Forge
Buy
799
943
18,593
7,867
8,881
20.0
20.3
34.4
41.0
23.2
19.5
4.5
3.7
21.1
20.9
2.5
2.2
Eicher Motors
Buy
16,472
19,036
44,729
15,379
16,498
15.6
16.6
473.2
574.8
34.8
28.7
12.9
9.6
36.7
33.2
2.8
2.6
Gabriel India
Buy
83
101
1,193
1,415
1,544
8.7
9.0
4.6
5.4
18.1
15.4
3.3
2.9
18.1
18.9
0.8
0.7
Hero Motocorp
Accumulate
2,586
2,774
51,640
28,561
31,559
14.7
14.7
151.1
163.2
17.1
15.9
6.6
5.7
38.7
35.6
1.6
1.5
Jamna Auto Industries Neutral
143
-
1,144
1,292
1,486
9.3
9.8
6.0
7.5
23.9
19.1
5.0
4.2
20.7
21.8
1.0
0.8
L G Balakrishnan & Bros Neutral
469
-
737
1,254
1,394
11.6
11.8
35.9
41.7
13.1
11.3
1.8
1.6
13.5
13.8
0.7
0.6
Mahindra and Mahindra Buy
1,191
1,449
74,000
39,031
44,440
13.8
13.9
57.9
67.6
20.6
17.6
3.3
2.9
16.1
16.6
1.5
1.3
Maruti
Neutral
4,107
-
124,075
57,865
68,104
16.4
16.7
176.3
225.5
23.3
18.2
4.5
3.9
19.4
21.2
1.9
1.6
Minda Industries
Accumulate
787
867
1,249
2,567
2,965
8.0
8.3
46.1
57.8
17.1
13.6
2.9
2.4
16.7
17.3
0.6
0.5
Motherson Sumi
Buy
257
313
33,961
39,343
45,100
8.8
9.1
10.1
12.5
25.4
20.5
8.1
6.3
35.3
34.4
0.9
0.8
Rane Brake Lining
Buy
310
366
245
454
511
11.1
11.4
23.8
28.1
13.0
11.0
1.9
1.7
14.2
15.3
0.7
0.6
Setco Automotive
Neutral
34
-
450
594
741
12.7
13.7
1.7
3.2
19.8
10.5
2.1
1.8
10.4
16.9
1.2
1.0
Tata Motors
Buy
339
409
97,977
266,022
312,667
12.8
13.1
26.3
38.3
12.9
8.9
1.7
1.4
8.4
12.1
0.5
0.5
TVS Motor
Buy
285
338
13,542
11,569
13,648
7.3
8.7
10.3
16.1
27.7
17.7
6.9
5.4
24.8
30.5
1.2
1.0
Amara Raja Batteries
Buy
820
1,040
14,007
4,892
5,871
17.4
17.6
28.8
37.1
28.5
22.1
6.7
5.3
23.4
24.1
2.8
2.3
Exide Industries
Buy
125
162
10,608
6,950
7,784
14.4
14.8
6.6
7.3
18.9
17.1
2.4
2.2
12.6
12.8
1.2
1.1
Apollo Tyres
Buy
141
171
7,167
12,146
12,689
16.8
16.0
21.2
19.0
6.6
7.4
1.1
1.0
16.5
13.0
0.7
0.7
Ceat
Buy
922
1,119
3,731
6,041
6,597
14.1
13.7
99.5
111.9
9.3
8.2
1.8
1.5
19.6
18.5
0.8
0.7
JK Tyres
Neutral
86
-
1,951
7,446
7,669
15.2
14.0
19.6
18.4
4.4
4.7
1.1
0.9
25.2
19.5
0.7
0.6
Swaraj Engines
Neutral
897
-
1,115
552
630
14.2
14.7
44.6
54.1
20.1
16.6
4.7
4.3
23.2
25.6
1.9
1.6
Subros
Neutral
89
-
532
1,268
1,488
11.6
11.9
3.7
6.6
24.0
13.4
1.6
1.5
6.8
11.4
0.7
0.6
Indag Rubber
Neutral
185
-
486
283
329
17.0
17.2
13.0
15.4
14.3
12.0
3.1
2.6
21.8
21.6
1.4
1.2
Capital Goods
ACE
Neutral
39
-
384
660
839
4.7
8.2
1.0
3.9
38.8
10.0
1.2
1.1
3.2
11.3
0.7
0.6
BEML
Neutral
1,099
-
4,577
3,277
4,006
6.0
8.9
29.2
64.3
37.6
17.1
2.1
1.9
5.7
11.7
1.5
1.2
Bharat Electronics
Buy
1,194
1,414
28,648
7,737
8,634
16.8
17.2
54.0
61.0
22.1
19.6
3.2
2.8
39.3
45.6
2.8
2.4
Stock Watch
January 25, 2016
Company Name
Reco
CMP
Target
Mkt Cap
Sales ( Čcr )
OPM(%)
EPS (Č)
PER(x)
P/BV(x)
RoE(%)
EV/Sales(x)
(Č)
Price ( Č)
( Č cr )
FY16E
FY17E
FY16E
FY17E
FY16E
FY17E
FY16E
FY17E
FY16E
FY17E
FY16E
FY17E
FY16E
FY17E
Capital Goods
Voltas
Buy
284
353
9,409
5,363
5,963
8.0
9.1
11.0
13.8
25.9
20.6
4.0
3.5
16.2
17.9
1.7
1.5
BGR Energy
Neutral
109
-
789
3,615
3,181
9.5
9.4
16.7
12.4
6.5
8.8
0.6
0.6
10.0
7.0
0.6
0.8
BHEL
Neutral
147
-
36,053
33,722
35,272
10.8
11.7
10.5
14.2
14.0
10.4
1.0
1.0
7.0
9.0
1.1
1.1
Blue Star
Buy
351
439
3,155
3,548
3,977
6.3
6.9
13.7
17.2
25.6
20.4
6.4
4.2
26.1
25.4
1.0
0.8
Crompton Greaves
Buy
171
204
10,739
13,484
14,687
4.9
6.2
4.5
7.1
38.1
24.1
2.7
2.5
7.2
10.8
0.9
0.8
Inox Wind
Buy
310
458
6,877
4,980
5,943
17.0
17.5
26.6
31.6
11.7
9.8
3.5
2.6
35.0
30.0
1.5
1.2
KEC International
Neutral
116
-
2,990
8,791
9,716
6.1
6.8
5.4
8.2
21.5
14.2
2.2
2.0
10.0
14.0
0.6
0.5
Thermax
Neutral
839
-
9,999
6,413
7,525
7.4
8.5
30.5
39.3
27.5
21.4
4.2
3.7
15.0
17.0
1.5
1.3
Cement
ACC
Buy
1,242
1,630
23,317
13,151
14,757
16.4
18.3
63.9
83.4
19.4
14.9
2.5
2.3
13.3
16.1
1.6
1.4
Ambuja Cements
Buy
193
233
29,936
11,564
12,556
19.4
20.7
8.9
10.1
21.7
19.1
2.7
2.6
12.8
13.8
2.2
2.0
HeidelbergCement
Neutral
69
-
1,568
1,772
1,926
13.3
15.4
1.0
3.0
69.2
23.1
1.8
1.6
2.6
7.9
1.5
1.3
India Cements
Buy
88
112
2,699
4,216
4,840
18.0
19.5
4.0
9.9
22.0
8.9
0.9
0.8
4.0
9.5
1.0
0.8
JK Cement
Buy
509
744
3,561
3,661
4,742
10.1
15.8
18.0
61.0
28.3
8.4
2.0
1.8
7.5
22.9
1.4
1.1
J K Lakshmi Cement
Buy
299
430
3,514
2,947
3,616
16.7
19.9
11.5
27.2
26.0
11.0
2.5
2.1
9.8
20.8
1.6
1.3
Mangalam Cements
Neutral
178
-
475
1,053
1,347
10.5
13.3
8.4
26.0
21.2
6.8
0.9
0.8
4.3
12.5
0.8
0.6
Orient Cement
Buy
143
183
2,931
1,854
2,524
21.2
22.2
7.7
11.1
18.6
12.9
2.7
2.3
13.3
15.7
2.3
1.6
Ramco Cements
Neutral
375
-
8,928
4,036
4,545
20.8
21.3
15.1
18.8
24.8
20.0
3.0
2.7
12.9
14.3
2.7
2.3
Shree Cement^
Neutral
9,965
-
34,716
7,150
8,742
26.7
28.6
228.0
345.5
43.7
28.8
6.4
5.4
15.7
20.3
4.6
3.7
UltraTech Cement
Buy
2,719
3,282
74,613
25,021
30,023
19.1
21.6
89.0
132.0
30.6
20.6
3.5
3.1
12.2
15.9
3.0
2.6
Construction
ITNL
Neutral
72
-
2,370
7,360
8,825
34.0
35.9
7.0
9.0
10.3
8.0
0.4
0.3
3.2
3.7
3.7
3.6
KNR Constructions
Buy
486
673
1,367
937
1,470
14.3
14.0
33.5
38.6
14.5
12.6
2.2
1.9
15.4
15.4
1.5
1.0
Larsen & Toubro
Buy
1,142
1,646
106,345
65,065
77,009
11.5
11.7
61.5
65.6
18.6
17.4
1.9
1.7
13.4
14.0
1.8
1.6
Gujarat Pipavav Port
Neutral
149
-
7,198
629
684
51.0
52.2
6.4
5.9
23.3
25.2
3.1
2.8
15.9
12.7
11.1
10.0
MBL Infrastructures
Buy
172
285
713
2,313
2,797
12.2
14.6
19.0
20.0
9.1
8.6
0.9
0.9
11.3
10.6
1.0
0.9
Nagarjuna Const.
Neutral
66
-
3,669
7,892
8,842
8.8
9.1
3.0
5.3
22.0
12.5
1.1
1.0
5.0
8.5
0.7
0.6
PNC Infratech
Accumulate
488
558
2,504
1,873
2,288
13.2
13.5
24.0
32.0
20.3
15.3
2.0
1.8
12.1
12.3
1.4
1.2
Simplex Infra
Neutral
281
-
1,391
5,955
6,829
10.3
10.5
16.0
31.0
17.6
9.1
0.9
0.9
5.3
9.9
0.7
0.6
Power Mech Projects
Neutral
616
-
907
1,539
1,801
12.8
12.7
59.0
72.1
10.5
8.6
1.6
1.3
18.6
16.8
0.6
0.5
Sadbhav Engineering
Neutral
303
-
5,198
3,481
4,219
10.7
10.8
8.0
12.0
37.9
25.3
3.5
3.1
10.3
13.5
1.8
1.5
Stock Watch
January 25, 2016
Company Name
Reco
CMP
Target
Mkt Cap
Sales ( Čcr )
OPM(%)
EPS (Č)
PER(x)
P/BV(x)
RoE(%)
EV/Sales(x)
(Č)
Price ( Č)
( Č cr )
FY16E
FY17E
FY16E
FY17E
FY16E
FY17E
FY16E
FY17E
FY16E
FY17E
FY16E
FY17E
FY16E
FY17E
Construction
NBCC
Buy
916
1,089
10,992
7,382
9,506
7.7
8.6
39.8
54.4
23.0
16.8
5.6
4.4
26.7
29.1
1.2
0.9
MEP Infra
Neutral
43
-
705
1,956
1,876
28.1
30.5
1.3
3.0
33.4
14.5
7.0
4.7
21.2
32.8
1.8
1.8
SIPL
Neutral
83
-
2,913
675
1,042
62.4
64.7
-
-
3.1
3.5
-
-
16.0
10.8
Financials
Allahabad Bank
Neutral
54
-
3,222
8,569
9,392
2.8
2.9
16.3
27.5
3.3
2.0
0.3
0.2
7.6
11.9
-
-
Axis Bank
Buy
424
531
100,903
26,473
31,527
3.5
3.6
35.7
43.5
11.9
9.8
2.3
2.0
17.9
18.9
-
-
Bank of Baroda
Neutral
130
-
30,012
18,485
21,025
1.9
2.0
13.5
21.1
9.7
6.2
0.8
0.7
7.3
10.6
-
-
Bank of India
Neutral
101
-
8,180
15,972
17,271
1.9
2.0
15.3
33.4
6.6
3.0
0.3
0.3
3.6
7.6
-
-
Canara Bank
Neutral
186
-
10,119
15,441
16,945
2.0
2.1
46.6
70.4
4.0
2.7
0.4
0.3
8.0
11.2
-
-
Dena Bank
Neutral
36
-
2,291
3,440
3,840
2.1
2.3
7.3
10.0
4.9
3.5
0.4
0.3
6.1
7.9
-
-
Federal Bank
Neutral
49
-
8,347
3,477
3,999
3.0
3.0
5.0
6.2
9.7
7.8
1.0
0.9
10.6
11.9
-
-
HDFC
Neutral
1,158
-
182,793
10,358
11,852
3.3
3.3
41.1
47.0
28.2
24.6
5.4
4.9
24.7
24.9
-
-
HDFC Bank
Buy
1,030
1,262
260,160
38,309
47,302
4.3
4.3
49.3
61.1
20.9
16.9
3.6
3.1
18.5
19.7
-
-
ICICI Bank
Buy
233
304
135,282
34,279
39,262
3.3
3.3
21.0
24.4
11.1
9.6
1.9
1.6
14.4
14.7
-
-
IDBI Bank
Neutral
60
-
11,400
9,625
10,455
1.8
1.8
8.5
14.2
7.0
4.2
0.4
0.4
5.9
9.3
-
-
Indian Bank
Neutral
92
-
4,421
6,160
6,858
2.5
2.5
24.5
29.8
3.8
3.1
0.3
0.3
7.7
8.6
-
-
LIC Housing Finance
Buy
484
592
24,423
3,101
3,745
2.5
2.5
33.0
40.2
14.7
12.1
2.7
2.3
19.7
20.5
-
-
Oriental Bank
Neutral
110
-
3,295
7,643
8,373
2.4
2.4
37.2
45.4
3.0
2.4
0.3
0.2
8.2
9.4
-
-
Punjab Natl.Bank
Neutral
93
-
18,173
23,638
26,557
2.8
2.8
17.9
27.2
5.2
3.4
0.5
0.4
8.5
12.0
-
-
South Ind.Bank
Neutral
18
-
2,484
1,965
2,185
2.5
2.5
2.5
3.3
7.4
5.6
0.7
0.7
9.5
11.7
-
-
St Bk of India
Buy
184
237
143,068
82,520
93,299
2.7
2.8
20.0
24.5
9.2
7.5
1.0
0.9
11.5
12.8
-
-
Union Bank
Neutral
120
-
8,273
12,646
14,129
2.3
2.4
31.0
39.1
3.9
3.1
0.4
0.4
9.8
11.4
-
-
Vijaya Bank
Neutral
31
-
2,625
3,536
3,827
1.9
1.9
5.5
6.7
5.5
4.6
0.5
0.4
7.8
8.8
-
-
Yes Bank
Buy
684
825
28,690
7,190
9,011
3.2
3.3
58.2
69.7
11.7
9.8
2.1
1.8
19.2
19.6
-
-
FMCG
Asian Paints
Neutral
870
-
83,402
16,553
19,160
16.0
16.2
17.7
21.5
49.2
40.4
13.1
11.8
29.4
31.2
4.9
4.2
Britannia
Neutral
2,618
-
31,408
8,065
9,395
9.6
10.2
47.2
65.5
55.5
40.0
18.4
17.4
38.3
41.2
3.7
3.2
Colgate
Neutral
883
-
24,012
4,836
5,490
19.5
19.7
48.5
53.2
18.2
16.6
13.3
11.6
99.8
97.5
4.9
4.3
Dabur India
Accumulate
242
267
42,483
9,370
10,265
17.1
17.2
7.3
8.1
32.9
29.8
9.9
8.1
33.7
30.6
4.4
4.1
GlaxoSmith Con*
Accumulate
5,666
6,118
23,830
4,919
5,742
17.2
17.4
168.3
191.2
33.7
29.6
9.6
8.1
28.8
28.9
4.4
3.7
Godrej Consumer
Neutral
1,129
-
38,451
10,168
12,886
16.1
16.1
32.1
38.4
35.2
29.4
7.2
6.6
19.7
21.0
3.9
3.0
Stock Watch
January 25, 2016
Company Name
Reco
CMP
Target
Mkt Cap
Sales ( Čcr )
OPM(%)
EPS (Č)
PER(x)
P/BV(x)
RoE(%)
EV/Sales(x)
(Č)
Price ( Č)
( Č cr )
FY16E FY17E
FY16E
FY17E
FY16E
FY17E
FY16E
FY17E
FY16E
FY17E
FY16E
FY17E
FY16E
FY17E
FMCG
HUL
Accumulate
773
815
167,191
34,940
38,957
17.5
17.7
20.8
24.7
37.1
31.3
41.3
33.0
110.5
114.2
4.6
4.1
ITC
Buy
309
382
248,052
41,068
45,068
37.8
37.4
13.9
15.9
22.2
19.4
7.4
6.5
34.1
33.8
5.7
5.1
Marico
Neutral
219
-
28,268
6,551
7,766
15.7
16.0
10.4
12.5
21.1
17.5
6.1
5.1
33.2
32.4
4.2
3.6
Nestle*
Buy
5,452
6,646
52,569
11,291
12,847
22.2
22.3
158.9
184.6
34.3
29.5
17.9
16.1
55.0
57.3
4.5
3.9
Tata Global
Buy
126
144
7,924
8,635
9,072
9.8
9.9
6.5
7.6
19.3
16.5
1.9
1.8
6.8
7.4
0.9
0.8
IT
HCL Tech^
Buy
839
1,132
118,298
42,038
47,503
23.2
23.5
55.8
62.9
15.0
13.3
3.5
2.7
23.0
19.8
2.4
1.9
Infosys
Buy
1,136
1,347
260,910
61,850
69,981
27.5
27.5
59.4
65.7
19.1
17.3
4.1
3.5
21.2
20.1
3.5
2.9
TCS
Buy
2,295
2,854
452,262
108,487
122,590
28.3
28.5
122.8
138.4
18.7
16.6
7.1
6.5
38.0
38.9
3.8
3.3
Tech Mahindra
Buy
514
646
49,681
25,566
28,890
16.0
17.0
26.3
31.9
19.5
16.1
3.5
3.0
17.9
18.6
1.7
1.5
Wipro
Buy
550
719
135,950
50,808
58,713
23.7
23.8
37.3
42.3
14.8
13.0
2.8
2.5
19.0
17.9
2.2
1.8
Media
D B Corp
Accumulate
318
356
5,840
2,241
2,495
27.8
27.9
21.8
25.6
14.6
12.4
3.8
3.4
26.7
28.5
2.5
2.3
HT Media
Neutral
79
-
1,845
2,495
2,603
11.2
11.2
7.3
8.6
10.9
9.2
0.9
0.8
7.4
8.1
0.2
0.2
Jagran Prakashan
Buy
164
189
5,365
2,170
2,355
27.2
26.2
8.9
9.9
18.4
16.6
3.9
3.4
20.9
20.5
2.4
2.2
Sun TV Network
Neutral
350
-
13,781
2,779
3,196
70.2
70.5
22.8
27.3
15.3
12.8
3.8
3.4
26.7
28.3
4.7
4.1
Hindustan Media
Neutral
254
-
1,862
920
1,031
20.0
20.0
19.2
20.9
13.2
12.2
2.2
1.9
16.4
15.3
1.6
1.4
Ventures
Metals & Mining
Coal India
Buy
300
380
189,459
76,167
84,130
19.9
22.3
22.4
25.8
13.4
11.6
4.8
4.7
35.5
41.0
1.8
1.6
Hind. Zinc
Buy
145
175
61,457
14,641
14,026
50.4
50.4
17.7
16.0
8.2
9.1
1.3
1.2
16.2
13.2
1.8
1.6
Hindalco
Neutral
72
-
14,940
104,356
111,186
8.7
9.5
6.7
11.1
10.8
6.5
0.4
0.4
3.5
5.9
0.7
0.6
JSW Steel
Neutral
1,066
-
25,771
42,308
45,147
16.4
20.7
(10.3)
49.5
21.5
1.2
1.2
(1.0)
5.6
1.7
1.5
NMDC
Neutral
80
-
31,856
8,237
10,893
46.6
44.5
10.0
11.7
8.1
6.9
0.9
0.8
12.5
13.0
3.7
2.8
SAIL
Neutral
43
-
17,821
45,915
53,954
7.2
10.5
1.5
4.4
28.7
9.9
0.4
0.4
2.3
4.1
1.0
0.9
Vedanta
Neutral
65
-
19,182
71,445
81,910
26.2
26.3
12.9
19.2
5.0
3.4
0.4
0.3
7.2
8.9
0.7
0.5
Tata Steel
Neutral
247
-
23,999
126,760
137,307
8.9
11.3
6.4
23.1
38.8
10.7
0.8
0.8
2.0
7.1
0.8
0.7
Oil & Gas
Cairn India
Neutral
113
-
21,167
11,323
12,490
49.4
51.0
20.7
20.7
5.5
5.5
0.4
0.3
6.4
6.1
0.9
0.3
GAIL
Neutral
367
-
46,610
64,856
70,933
9.1
9.6
24.0
28.9
15.3
12.7
1.3
1.2
8.8
9.6
0.9
0.8
ONGC
Neutral
216
-
185,184
154,564
167,321
36.8
37.4
28.6
32.5
7.6
6.7
1.0
0.9
12.7
13.5
1.4
1.3
Petronet LNG
Neutral
252
-
18,866
29,691
31,188
5.8
6.2
12.8
13.4
19.7
18.7
2.9
2.6
15.8
14.8
0.7
0.7
Indian Oil Corp
Accumulate
406
455
98,672
359,607
402,760
5.9
6.1
42.5
48.7
9.6
8.3
1.3
1.1
14.1
14.4
0.4
0.3
Reliance Industries
Accumulate
1,004
1,150
325,220
304,775
344,392
12.6
13.4
91.3
102.6
11.0
9.8
1.2
1.1
11.8
12.0
1.0
0.8
Stock Watch
January 25, 2016
Company Name
Reco
CMP
Target
Mkt Cap
Sales ( Čcr )
OPM(%)
EPS (Č)
PER(x)
P/BV(x)
RoE(%)
EV/Sales(x)
(Č)
Price ( Č)
( Č cr )
FY16E FY17E
FY16E
FY17E
FY16E
FY17E
FY16E
FY17E
FY16E
FY17E
FY16E
FY17E
FY16E
FY17E
Pharmaceuticals
Alembic Pharma
Neutral
635
-
11,972
2,658
3,112
24.1
20.2
24.6
23.9
25.8
26.6
9.3
7.1
42.5
30.2
4.5
3.8
Aurobindo Pharma
Accumulate
813
856
47,465
14,923
17,162
22.0
23.0
35.7
42.8
22.8
19.0
6.7
5.0
34.0
30.2
3.6
3.0
Aventis*
Neutral
4,175
-
9,615
2,082
2,371
17.4
20.8
118.2
151.5
35.3
27.6
5.2
4.2
19.9
25.5
4.3
3.6
Cadila Healthcare
Buy
301
352
30,794
10,224
11,840
21.0
22.0
14.6
17.6
20.6
17.1
5.6
4.4
30.8
29.0
3.1
2.6
Cipla
Accumulate
583
636
46,857
14,211
16,611
20.6
19.0
27.0
28.9
21.6
20.2
3.7
3.1
18.4
16.8
3.3
2.7
Dr Reddy's
Buy
2,883
3,933
49,168
16,838
19,575
25.0
23.1
167.5
178.8
17.2
16.1
3.6
3.0
23.1
20.4
2.8
2.4
Dishman Pharma
Neutral
322
-
2,601
1,733
1,906
21.5
21.5
17.0
19.9
19.0
16.2
1.9
1.7
10.5
11.2
2.0
1.7
GSK Pharma*
Neutral
3,129
-
26,505
2,870
3,158
20.0
22.1
59.5
68.3
52.6
45.8
15.5
15.9
28.5
34.3
8.7
8.0
Indoco Remedies
Neutral
302
-
2,784
1,033
1,199
15.9
18.2
9.4
13.6
32.1
22.2
4.8
4.1
15.7
19.7
2.8
2.4
Ipca labs
Buy
642
900
8,100
3,363
3,909
12.9
18.6
13.4
28.0
47.9
22.9
3.4
3.0
7.4
14.0
2.7
2.3
Lupin
Neutral
1,717
-
77,339
13,092
16,561
25.0
27.0
50.4
68.3
34.1
25.1
7.0
5.6
22.8
24.7
5.6
4.3
Sun Pharma
Buy
790
950
190,134
28,163
32,610
25.8
30.7
17.4
26.9
45.4
29.4
4.3
3.7
13.0
16.6
6.2
5.2
Power
Tata Power
Neutral
62
-
16,701
35,923
37,402
22.6
22.8
4.1
5.2
15.2
12.0
1.2
1.1
7.5
9.3
1.4
1.3
NTPC
Accumulate
138
157
113,746
87,064
98,846
23.5
23.5
11.7
13.2
11.8
10.5
1.3
1.2
11.4
12.1
2.3
2.1
Power Grid
Buy
133
170
69,685
20,702
23,361
86.7
86.4
12.1
13.2
11.0
10.1
1.6
1.4
15.6
15.1
8.3
7.7
Telecom
Bharti Airtel
Neutral
299
-
119,462
101,748
109,191
32.1
31.7
12.0
12.5
24.9
23.9
1.7
1.6
6.9
6.7
1.8
1.6
Idea Cellular
Neutral
107
-
38,470
34,282
36,941
32.0
31.5
5.9
6.2
18.1
17.2
1.7
1.5
9.9
9.3
1.7
1.6
zOthers
Abbott India
Neutral
5,074
-
10,782
2,715
3,153
14.5
14.1
134.3
152.2
37.8
33.3
9.4
7.8
27.4
25.6
3.7
3.1
Bajaj Electricals
Buy
181
290
1,831
4,719
5,287
5.2
5.8
8.6
12.7
21.2
14.3
2.4
2.1
11.4
14.8
0.4
0.3
Finolex Cables
Neutral
224
-
3,420
2,520
2,883
12.2
12.0
12.7
14.2
17.7
15.8
2.4
2.1
13.6
13.5
1.1
0.9
Goodyear India*
Buy
491
622
1,132
1,888
1,680
12.1
11.9
62.2
56.6
7.9
8.7
1.9
1.6
25.9
19.7
0.4
0.4
Hitachi
Neutral
1,137
-
3,090
1,779
2,081
7.8
8.8
21.8
33.4
52.1
34.0
8.4
6.8
17.4
22.1
1.8
1.5
Jyothy Laboratories
Neutral
273
-
4,946
1,620
1,847
11.5
11.5
7.3
8.5
37.5
32.2
4.8
4.5
13.3
14.4
2.9
2.5
MRF
Buy
36,259
45,575
15,378
20,316
14,488
21.4
21.1
5,488.0
3,798.0
6.6
9.6
2.3
1.8
41.1
21.2
0.7
0.9
Page Industries
Neutral
12,283
-
13,701
1,929
2,450
19.8
20.1
229.9
299.0
53.4
41.1
23.6
16.4
52.1
47.1
7.1
5.6
Relaxo Footwears
Neutral
455
-
5,461
1,767
2,152
12.3
12.5
19.3
25.1
23.6
18.2
5.8
4.5
27.7
27.8
3.1
2.6
Siyaram Silk Mills
Buy
1,051
1,354
985
1,636
1,815
11.5
11.5
89.9
104.1
11.7
10.1
1.9
1.7
17.9
17.8
0.8
0.7
Styrolution ABS India*
Neutral
683
-
1,202
1,271
1,440
8.6
9.2
32.0
41.1
21.3
16.6
2.2
2.0
10.7
12.4
0.9
0.8
TVS Srichakra
Buy
2,543
3,240
1,947
2,101
2,338
15.7
15.0
248.6
270.0
10.2
9.4
4.5
3.2
43.6
34.0
1.0
0.8
Stock Watch
January 25, 2016
Company Name
Reco
CMP
Target
Mkt Cap
Sales ( Čcr )
OPM(%)
EPS (Č)
PER(x)
P/BV(x)
RoE(%)
EV/Sales(x)
(Č)
Price ( Č)
( Č cr )
FY16E
FY17E
FY16E
FY17E
FY16E
FY17E
FY16E
FY17E
FY16E
FY17E
FY16E
FY17E
FY16E
FY17E
zOthers
HSIL
Accumulate
282
302
2,038
2,123
2,384
16.1
16.5
15.0
18.9
18.7
14.9
1.5
1.4
8.0
9.4
1.3
1.1
Kirloskar Engines India
Neutral
231
-
3,342
2,471
2,826
8.8
10.4
9.1
13.3
25.3
17.3
2.4
2.2
9.7
13.4
1.0
0.8
Ltd
M M Forgings
Buy
478
614
577
511
615
21.7
21.6
43.1
55.8
11.1
8.6
2.0
1.7
19.9
21.2
1.3
1.0
Banco Products (India) Neutral
124
-
887
1,208
1,353
11.0
12.3
10.8
14.5
11.5
8.6
1.3
1.2
11.9
14.5
0.7
0.6
Competent Automobiles Neutral
143
-
88
1,040
1,137
3.2
3.1
25.7
28.0
5.6
5.1
0.8
0.7
15.0
14.3
0.1
0.1
Nilkamal
Neutral
1,274
-
1,901
1,910
2,083
10.5
10.3
63.3
69.2
20.1
18.4
3.3
2.8
17.6
16.5
1.1
0.9
Visaka Industries
Buy
107
144
170
1,086
1,197
9.9
10.3
21.5
28.8
5.0
3.7
0.5
0.4
9.6
11.6
0.4
0.3
Transport Corporation of
Neutral
237
-
1,800
2,830
3,350
8.8
9.0
14.4
18.3
16.5
12.9
2.5
2.2
15.4
17.1
0.8
0.7
India
Elecon Engineering
Buy
66
85
722
1,369
1,533
13.7
14.9
3.3
6.1
20.0
10.9
1.3
1.2
6.6
11.4
0.9
0.8
Surya Roshni
Buy
142
201
623
2,992
3,223
8.1
8.4
14.7
18.3
9.7
7.8
0.9
0.8
9.7
11.0
0.5
0.5
MT Educare
Neutral
161
-
640
286
366
18.3
17.7
7.7
9.4
20.8
17.2
4.4
3.8
20.2
21.1
2.1
1.6
Radico Khaitan
Buy
112
156
1,489
1,565
1,687
12.2
13.0
5.7
7.1
19.6
15.8
1.7
1.5
8.3
9.6
1.4
1.3
Garware Wall Ropes
Buy
352
473
770
862
974
11.2
11.2
24.9
29.6
14.1
11.9
2.1
1.8
15.1
15.4
0.9
0.8
Wonderla Holidays
Neutral
391
-
2,209
206
308
44.0
43.6
9.0
12.9
43.4
30.3
5.9
5.4
13.7
17.8
10.6
7.1
Linc Pen & Plastics
Neutral
211
-
312
340
371
8.3
8.9
10.8
13.2
19.6
16.0
3.1
2.7
16.0
17.1
1.0
0.9
The Byke Hospitality
Neutral
159
-
639
222
287
20.5
20.5
5.6
7.6
28.3
21.1
5.3
4.4
18.9
20.8
2.9
2.2
Interglobe Aviation
Neutral
968
-
34,893
17,022
21,122
20.7
14.5
63.9
53.7
15.2
18.0
22.7
18.6
149.9
103.2
2.1
1.7
Coffee Day Enterprises
Neutral
250
-
5,156
2,692
2,964
17.0
18.6
-
4.7
-
52.8
3.1
2.9
0.2
5.5
2.3
2.1
Ltd
Navneet Education
Neutral
86
-
2,043
998
1,062
24.1
24.0
5.8
6.1
14.9
14.1
3.3
2.9
22.0
20.6
2.1
2.0
Navkar Corporation
Buy
197
265
2,802
365
436
38.3
37.5
5.6
5.9
34.9
33.4
2.2
2.1
6.3
6.1
8.5
7.3
Source: Company, Angel Research; Note: *December year end; #September year end; &October year end; Price as on January 22, 2016
Market Outlook
January 25, 2016
Research Team Tel: 022 - 39357800
DISCLAIMER
Angel Broking Private Limited (hereinafter referred to as “Angel”) is a registered Member of National Stock Exchange of India Limited,
Bombay Stock Exchange Limited and Metropolitian Stock Exchange of India Limited. It is also registered as a Depository Participant with
CDSL and Portfolio Manager with SEBI. It also has registration with AMFI as a Mutual Fund Distributor. Angel Broking Private Limited is a
registered entity with SEBI for Research Analyst in terms of SEBI (Research Analyst) Regulations, 2014 vide registration number
INH000000164. Angel or its associates has not been debarred/ suspended by SEBI or any other regulatory authority for accessing
/dealing in securities Market. Angel or its associates including its relatives/analyst do not hold any financial interest/beneficial ownership
of more than 1% in the company covered by Analyst. Angel or its associates/analyst has not received any compensation / managed or co
-managed public offering of securities of the company covered by Analyst during the past twelve months. Angel/analyst has not served as
an officer, director or employee of company covered by Analyst and has not been engaged in market making activity of the company
covered by Analyst.
This document is solely for the personal information of the recipient, and must not be singularly used as the basis of any investment
decision. Nothing in this document should be construed as investment or financial advice. Each recipient of this document should make
such investigations as they deem necessary to arrive at an independent evaluation of an investment in the securities of the companies
referred to in this document (including the merits and risks involved), and should consult their own advisors to determine the merits and
risks of such an investment.
Reports based on technical and derivative analysis center on studying charts of a stock's price movement, outstanding positions and
trading volume, as opposed to focusing on a company's fundamentals and, as such, may not match with a report on a company's
fundamentals.
The information in this document has been printed on the basis of publicly available information, internal data and other reliable sources
believed to be true, but we do not represent that it is accurate or complete and it should not be relied on as such, as this document is for
general guidance only. Angel Broking Pvt. Limited or any of its affiliates/ group companies shall not be in any way responsible for any
loss or damage that may arise to any person from any inadvertent error in the information contained in this report. Angel Broking Pvt.
Limited has not independently verified all the information contained within this document. Accordingly, we cannot testify, nor make any
representation or warranty, express or implied, to the accuracy, contents or data contained within this document. While Angel Broking
Pvt. Limited endeavors to update on a reasonable basis the information discussed in this material, there may be regulatory, compliance,
or other reasons that prevent us from doing so.
This document is being supplied to you solely for your information, and its contents, information or data may not be reproduced,
redistributed or passed on, directly or indirectly.
Neither Angel Broking Pvt. Limited, nor its directors, employees or affiliates shall be liable for any loss or damage that may arise from or
in connection with the use of this information.
Note: Please refer to the important ‘Stock Holding Disclosure' report on the Angel website (Research Section). Also, please refer to the
latest update on respective stocks for the disclosure status in respect of those stocks. Angel Broking Pvt. Limited and its affiliates may have
investment positions in the stocks recommended in this report.