Market Outlook
September 24, 2015
Dealer’s Diary
Domestic Indices
Chg (%)
(Pts)
(Close)
BSE Sensex
0.7
171
25,823
Indian markets are expected to open flat tracking the SGX Nifty and Asian cues.
Nifty
0.4
34
7,846
The US markets closed flat showing a lack of direction reflecting continued
MID CAP
0.5
50
10,574
uncertainty about the outlook for U.S. monetary policy following last week's Federal
SMALL CAP
0.7
77
10,880
Reserve decision.
BSE HC
0.7
122
17,487
European markets ended in the green led by bargain hunting at lower levels and
BSE PSU
0.6
39
6,709
improvement in market sentiment on account of rebound in shares of Volkswagen
BANKEX
1.5
284
19,785
after 2 days of sharp declines.
AUTO
0.0
3
17,300
METAL
0.1
7
6,984
Indian equities opened lower but recovered during the day on account of positive
OIL & GAS
1.0
86
8,701
cues from Europe and comments from Chinese President Xi Jinping that a cheaper
currency would not be used to boost exports.
BSE IT
0.4
40
11,246
Global Indices
Chg (%)
(Pts)
(Close)
News & Result Analysis
Dow Jones
(0.3)
(51)
16,280
RBI eases overseas borrowing rules for domestic companies
NASDAQ
(0.1)
(4)
4,753
Bajaj Auto quadricycle (RE60) receives certification under European WVTA
FTSE
1.6
96
6,032
regulations; can commence exports
Refer detailed news analysis on the following page
Nikkei
(2.0)
(362)
18,070
Hang Seng
(2.3)
(494)
21,303
Markets Today
Straits Times
(0.8)
(23)
2,846
The trend deciding level for the day is 25,714 / 7,817 levels. If NIFTY trades above
Shanghai Com
(2.2)
(70)
3,116
this level during the first half-an-hour of trade then we may witness a further rally up
to 26,043 - 26,262 / 7,911 - 7977 levels. However, if NIFTY trades below
Indian ADR
Chg (%)
(Pts)
(Close)
25,714 / 7,817 levels for the first half-an-hour of trade then it may correct towards
25,495 - 25,167 / 7,752 - 7,658 levels.
INFY
(0.6)
(0.1)
$17.7
WIT
(0.2)
(0.0)
$11.8
Indices
S2
S1
PIVOT
R1
R2
IBN
(0.1)
(0.0)
$8.4
SENSEX
25,167
25,495
25,714
26,043
26,262
HDB
0.2
0.1
$58.5
NIFTY
7,658
7,752
7,817
7,911
7,977
Advances / Declines
BSE
NSE
Net Inflows (September 22, 2015)
Advances
1,536
842
` cr
Purch
Sales
Net
MTD
YTD
Declines
1,159
624
FII
3,936
4,902
(966)
(2,755)
121,005
Unchanged
95
87
MFs
724
639
85
5,110
75,758
Volumes (` cr)
FII Derivatives (September 23, 2015)
BSE
2,475
` cr
Purch
Sales
Net
Open Interest
NSE
15,664
Index Futures
5,890
5,717
173
32,692
Stock Futures
16,175
16,438
-263
51,667
Gainers / Losers
Gainer
Loser
Company
Price (`)
chg (%)
Company
Price (`)
chg (%)
JPASSOCIAT
12
11.9
SUNASIAN
99
(4.9)
GESHIP
73
9.3
INFRATEL
394
(4.9)
JUBILANT
365
8.2
PMCFIN
1
(4.3)
RAJESHEXPO
460
7.3
JSWSTEEL
874
(4.1)
GPPL
190
6.5
NMDC
98
(4.0)
Market Outlook
September 24, 2015
RBI eases overseas borrowing rules for domestic companies
The Reserve Bank of India (RBI) proposed relaxing some of the rules for domestic
companies looking to raise funds overseas through external commercial
borrowing, a long-anticipated move. The RBI said companies will now be able to
borrow up to $50 million in ECBs with 3-year maturities and more than $50
million for 5-year maturities. The previous limits had been around $20 million.
The RBI also said it would now allow real estate investment trusts and infrastructure
investment trusts to raise rupee-denominated funds offshore, a step likely to
provide some relief to the cash-strapped real estate sector in India.
As part of the proposals, the RBI also said it would allow funds raised from ECBs to
be directed to additional purposes, including certain infrastructure lending and
some overseas direct investments.
However, the RBI also proposed tightening how much companies can pay to
borrow via ECBs, saying it would lower by 50 basis points the current all-in-cost
ceiling of 350 bps over 6-month Libor for 3-5 year loans and 500 bps over Libor
for above 5 year maturities.
Bajaj Auto quadricycle (RE60) receives certification under
European WVTA regulations; can commence exports
Bajaj RE 60, India's first internal combustion engine quadricycle, has been certified
under the European Whole Vehicle Type Approval (EU WVTA) regulations. The
certification will allow Bajaj Auto to export the soon-to-be-launched quadricyle to
Europe and other markets that recognise the EU WVTA standard. The certification
was done by Bengaluru headquartered TUV Rheinland India, a subsidiary of the
Germany-based TUV Rheinland group and a leader in testing, inspection,
certification and training.
The EU WVTA regulations are advanced in terms of stringent environmental
standards for exhaust emission, noise emission, electromagnetic radiation and
high level of safety requirements for braking, lighting, exterior projection, safety
belts and anchorages, etc.
Given the litigation on introduction of quadricycles in the domestic markets, Bajaj
was mulling exporting the vehicle. It can now commence exports given the
certification. We currently have Accumulate rating on the stock.
Economic and Political News
Government to simplify foreign loan norms, liberalise FDI policy
Government to miss direct tax mop-up target for third year
Shipping ministry plans to lease land owned by lighthouses for tourism
Corporate News
Pfizer to sell thane plant for `178 crore
Elder Pharma plans to sell overseas units
Orient Green Power raises `250 crore
Market Outlook
September 24, 2015
Top Picks
Large Cap
Market Cap
CMP
Target
Upside
Company
Sector
Rating
(` Cr)
(`)
(`)
(%)
Aurobindo
Pharma
42,813
Buy
733
872
18.9
Axis Bank
Financials
1,21,707
Buy
512
701
36.9
ICICI Bank
Financials
1,59,063
Buy
274
370
35.1
Infosys
IT
2,56,488
Buy
1,117
1,306
17.0
Capital
Inox Wind
7,937
Buy
358
505
41.2
Goods
LIC HFL
Financials
21,991
Buy
436
570
30.8
Power Grid
Power
66,990
Buy
128
170
32.8
TCS
IT
4,96,351
Buy
2,534
3,168
25.0
Tech Mahindra IT
53,489
Buy
556
646
16.2
Yes Bank
Financials
30,917
Buy
739
953
29.0
Sun Pharma
Pharma
2,15,857 Accumulate
897
950
5.9
Source: Bloomberg, Angel Research
Mid Cap
Market Cap
CMP
Target
Upside
Company
Sector
Rating
(` Cr)
(`)
(`)
(%)
Bajaj Electricals
Others
2,517
Buy
250
341
36.6
Garware Wall
Others
728
Buy
333
390
17.2
MBL Infra
Construction
996
Buy
240
360
49.9
Minda Industries
Auto Ancillary
834
Buy
526
652
24.1
MT Educare
Others
510
Buy
128
169
31.9
Radico Khaitan
Others
1,119
Buy
84
112
33.2
Surya Roshni
Others
549
Buy
125
183
46.2
Tree House
Others
1,465
Buy
346
449
29.7
Source: Bloomberg, Angel Research
Market Outlook
September 24, 2015
Global economic events release calendar
Date
Time
Country
Event Description
Unit
Period
Bloomberg Data
Last Reported Estimated
September 24, 2015
6:00PM
US
Initial Jobless claims
Thousands
Sep 19
264.00
272.00
7:30PM
US
New home sales
Thousands
Aug
507.00
515.00
September 25, 2015
6:00PM
US
GDP Qoq (Annualised)
% Change
2Q T
3.70
3.70
September 29, 2015
7:30PM
US
Consumer Confidence
S.A./ 1985=100
Sep
101.54
97.00
11:00AM
India
RBI Reverse Repo rate
%
Sep 29
6.25
6.00
11:00AM
India
RBI Repo rate
%
Sep 29
7.25
7.00
11:00AM
India
RBI Cash Reserve ratio
%
Sep 29
4.00
4.00
September 30, 2015
1:25PM
Germany Unemployment change (000's)
Thousands
Sep
(7.00)
--
2:00PM
UK
GDP (YoY)
% Change
2Q F
2.60
--
October 1, 2015
6:30AM
China
PMI Manufacturing
Value
Sep
49.70
--
2:00PM
UK
PMI Manufacturing
Value
Sep
51.50
--
October 2, 2015
6:00PM
US
Change in Nonfarm payrolls
Thousands
Sep
173.00
200.00
6:00PM
US
Unnemployment rate
%
Sep
5.10
5.10
October 7, 2015
2:00PM
UK
Industrial Production (YoY)
% Change
Aug
0.80
--
October 8, 2015
4:30PM
UK
BOE Announces rates
% Ratio
Oct 8
0.50
0.50
October 9, 2015
India
Imports YoY%
% Change
Sep
(9.95)
--
India
Exports YoY%
% Change
Sep
(20.66)
--
October 12, 2015
5:30PM
India
Industrial Production YoY
% Change
Aug
4.20
--
October 13, 2015
2:00PM
UK
CPI (YoY)
% Change
Sep
--
--
China
Exports YoY%
% Change
Sep
(5.50)
--
October 14, 2015
2:00PM
UK
Jobless claims change
% Change
Sep
1.20
--
12:00PM
India
Monthly Wholesale Prices YoY%
% Change
Sep
(4.95)
--
7:00AM
China
Consumer Price Index (YoY)
% Change
Sep
2.00
--
October 15, 2015
6:00PM
US
Consumer price index (mom)
% Change
Sep
(0.10)
--
October 16, 2015
6:45PM
US
Industrial Production
%
Sep
(0.38)
--
2:30PM
Euro Zone Euro-Zone CPI (YoY)
%
Sep F
0.10
--
October 19, 2015
7:30AM
China
Industrial Production (YoY)
% Change
Sep
6.10
--
7:30AM
China
Real GDP (YoY)
% Change
3Q
7.00
--
Source: Bloomberg, Angel Research
Market Outlook
September 24, 2015
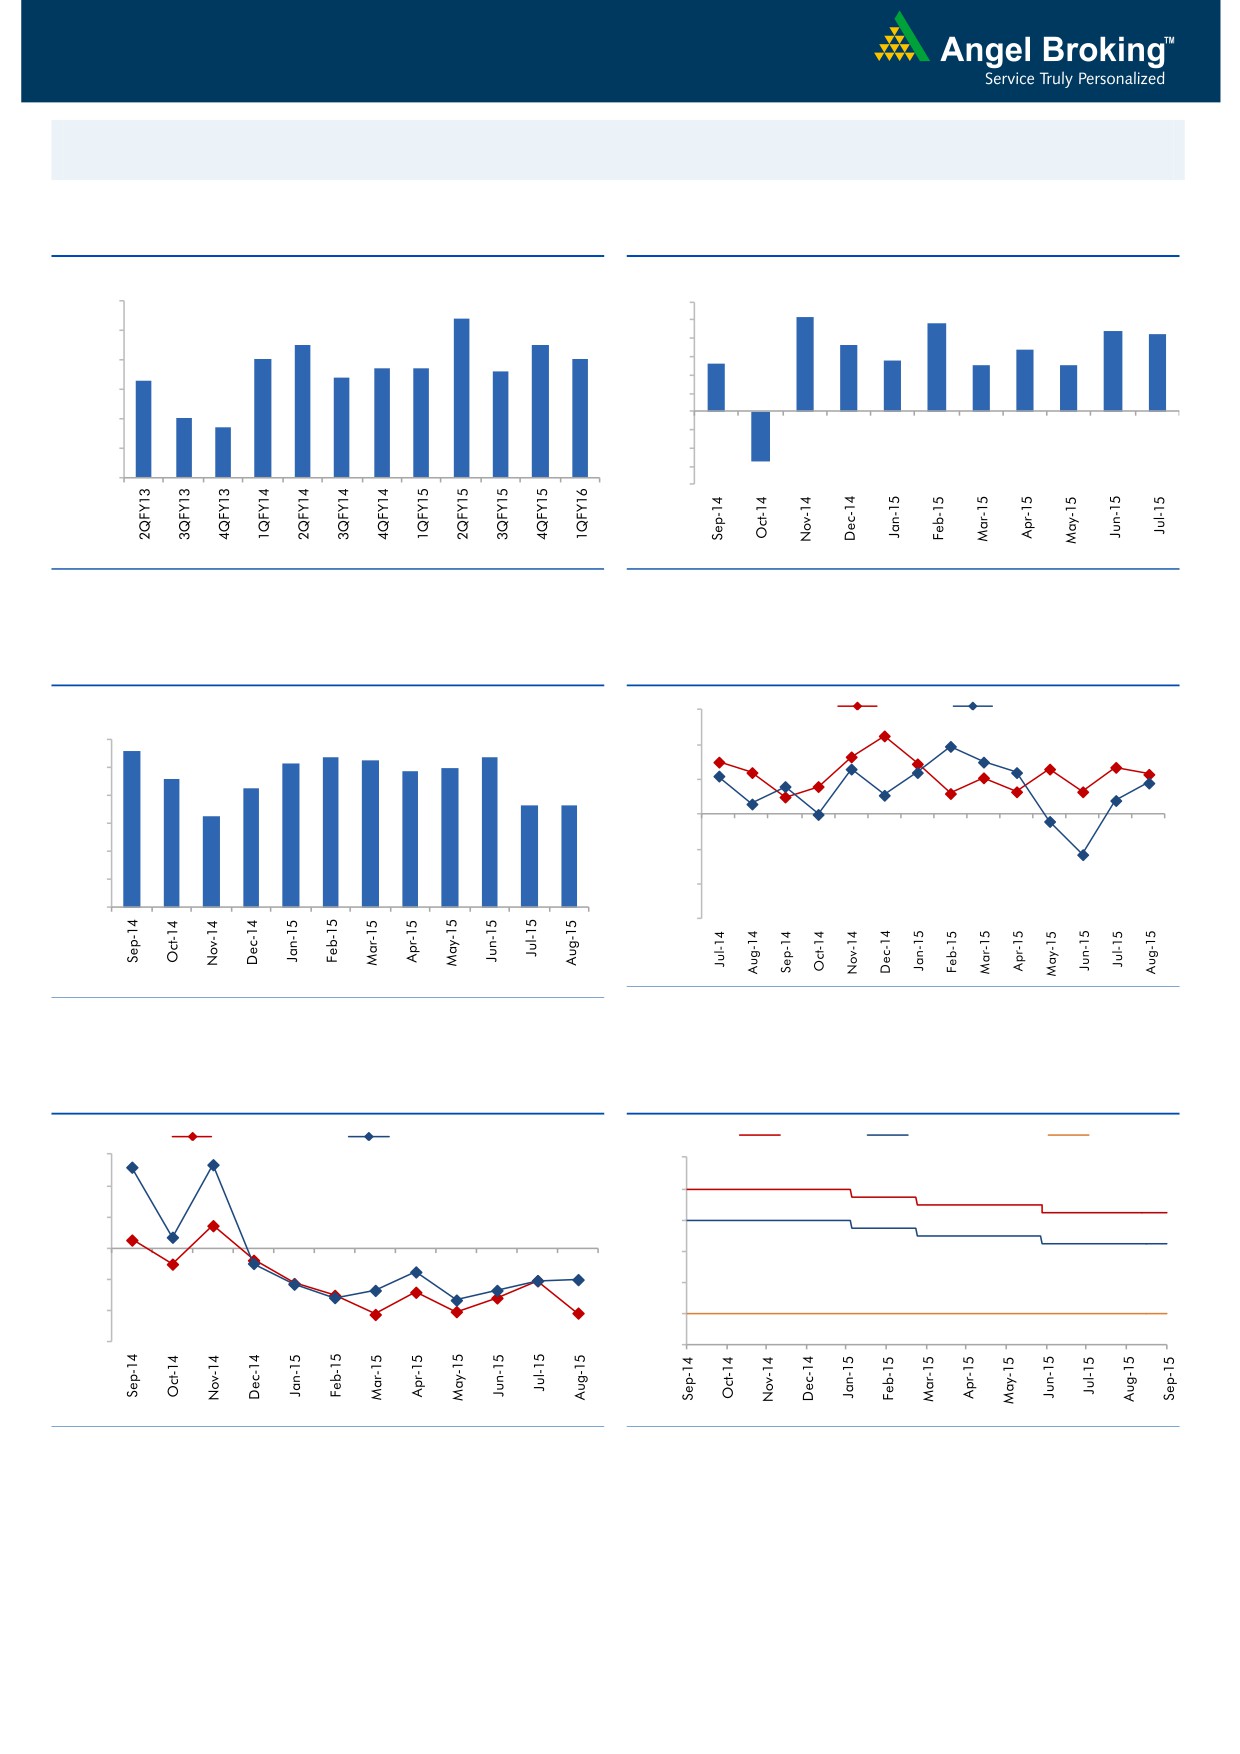
Macro watch
Exhibit 1: Quarterly GDP trends
Exhibit 2: IIP trends
(%)
(%)
9.0
8.4
6.0
5.2
4.8
4.4
4.2
5.0
8.0
7.5
7.5
3.6
3.4
7.0
7.0
4.0
6.7
6.7
2.6
2.8
2.5
2.5
6.6
3.0
7.0
6.3
6.4
2.0
6.0
1.0
5.0
4.7
-
5.0
(1.0)
4.0
(2.0)
(3.0)
3.0
(2.7)
(4.0)
Source: CSO, Angel Research
Source: MOSPI, Angel Research
Exhibit 3: Monthly CPI inflation trends
Exhibit 4: Manufacturing and services PMI
(%)
56.0
Mfg. PMI
Services PMI
5.6
6.0
5.4
5.3
5.4
54.0
5.2
5.0
4.9
4.6
5.0
4.3
52.0
3.7
3.7
4.0
3.3
50.0
3.0
2.0
48.0
1.0
46.0
-
44.0
Source: Market, Angel Research; Note: Level above 50 indicates expansion
Source: MOSPI, Angel Research
Exhibit 5: Exports and imports growth trends
Exhibit 6: Key policy rates
(%)
Exports yoy growth
Imports yoy growth
(%)
Repo rate
Reverse Repo rate
CRR
30.0
9.00
20.0
8.00
10.0
7.00
0.0
6.00
(10.0)
5.00
(20.0)
4.00
(30.0)
3.00
Source: Bloomberg, Angel Research
Source: RBI, Angel Research
Market Outlook
September 24, 2015
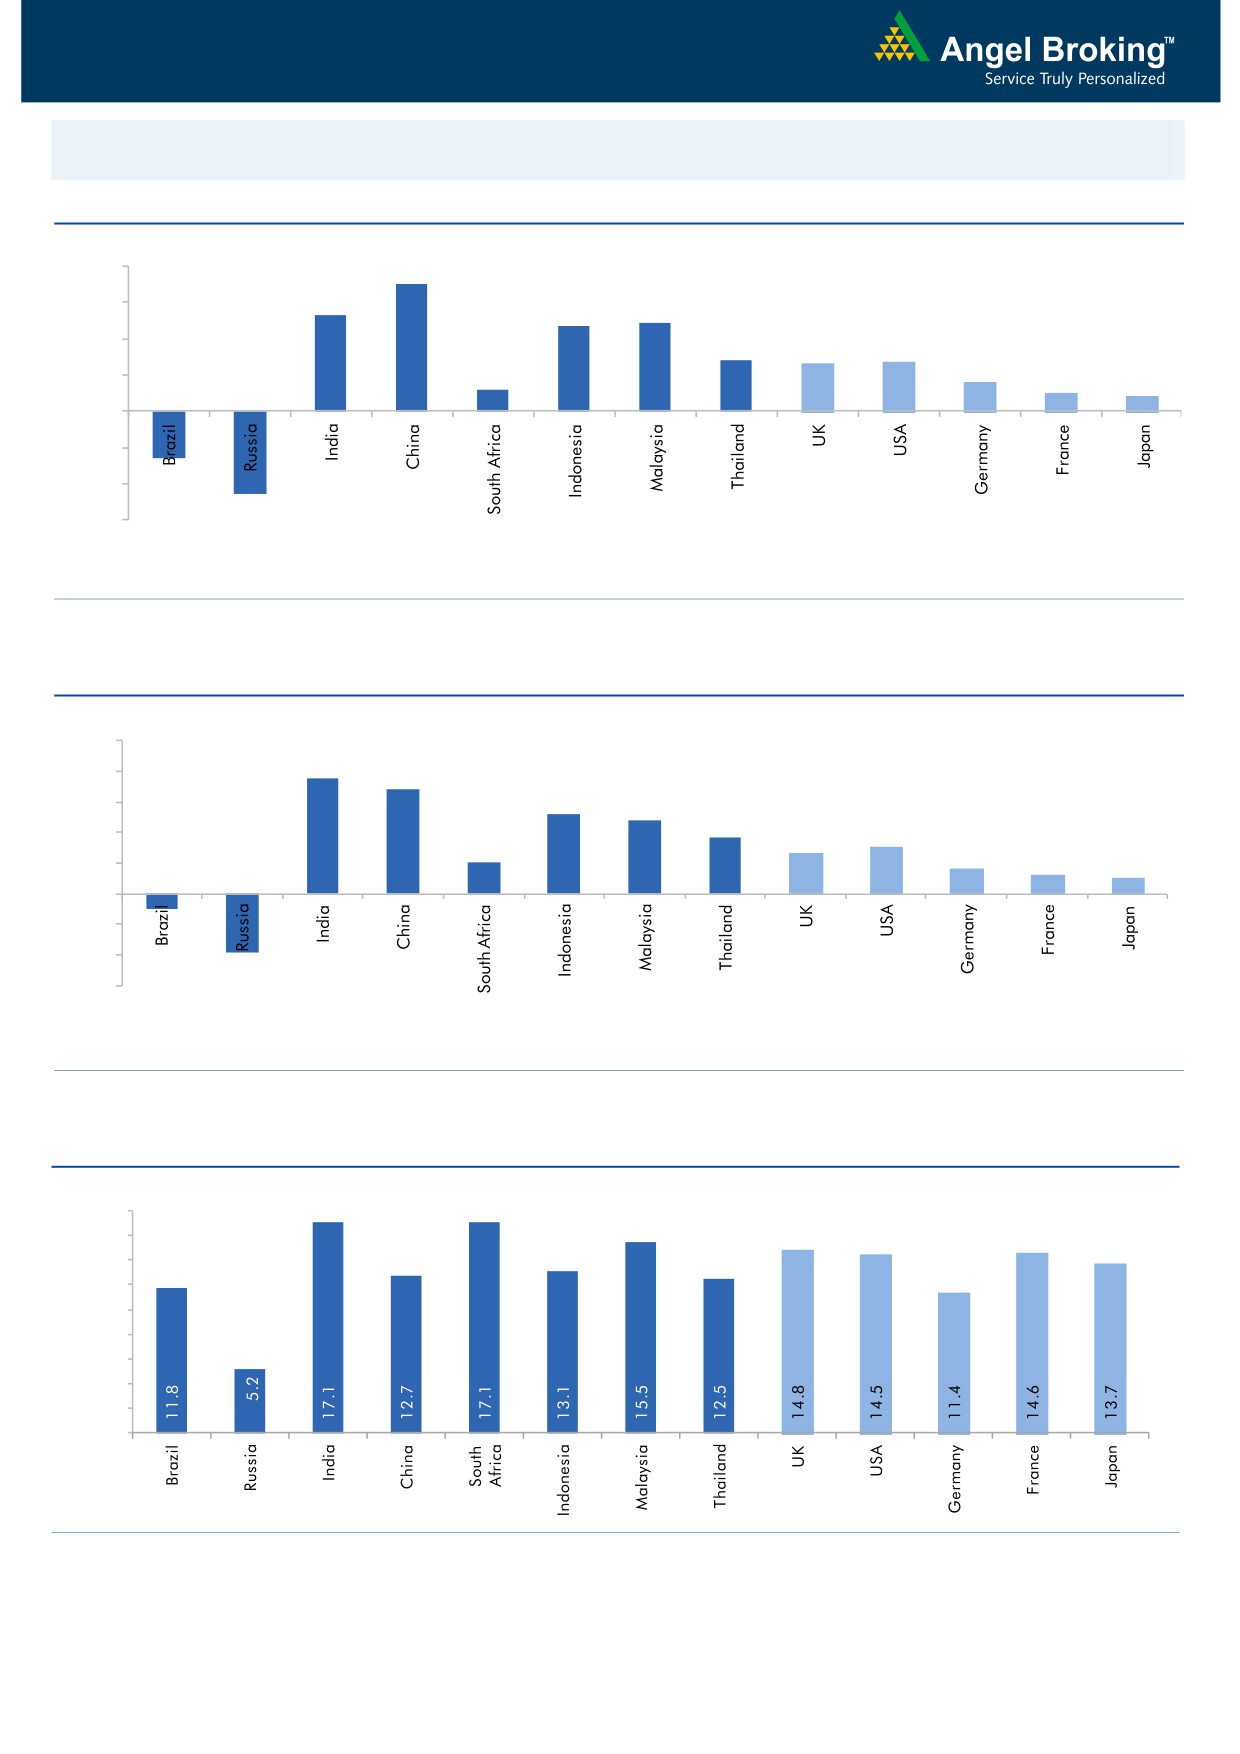
Global watch
Exhibit 1: Latest quarterly GDP Growth (%, yoy) across select developing and developed countries
(%)
8.0
7.0
5.3
6.0
4.9
4.7
4.0
2.8
2.6
2.7
1.6
2.0
1.2
1.0
0.8
(4.6)
(2.6)
-
(2.0)
(4.0)
(6.0)
Source: Bloomberg, Angel Research
Exhibit 2: 2015 GDP Growth projection by IMF (%, yoy) across select developing and developed countries
(%)
10.0
7.5
8.0
6.8
5.2
6.0
4.8
3.7
3.1
4.0
2.7
2.0
1.6
1.2
2.0
1.0
(3.8)
(1.0)
-
(2.0)
(4.0)
(6.0)
Source: IMF, Angel Research
Exhibit 3: One year forward P-E ratio across select developing and developed countries
(x)
18.0
16.0
14.0
12.0
10.0
8.0
6.0
4.0
2.0
-
Source: Bloomberg, Angel Research
Market Outlook
September 24, 2015
Exhibit 4: Relative performance of indices across globe
Returns (%)
Country
Name of index
Closing price
1M
3M
1YR
Brazil
Bovespa
45,340
(0.8)
(15.7)
(22.3)
Russia
Micex
1,641
0.4
0.5
16.1
India
Nifty
7,846
(5.5)
(6.2)
(1.1)
China
Shanghai Composite
3,116
(10.6)
(33.1)
34.1
South Africa
Top 40
45,062
6.9
(4.6)
(0.4)
Mexico
Mexbol
43,042
2.1
(5.2)
(4.4)
Indonesia
LQ45
708
2.3
(16.8)
(19.4)
Malaysia
KLCI
1,613
2.3
(6.9)
(12.6)
Thailand
SET 50
889
5.7
(10.2)
(15.8)
USA
Dow Jones
16,280
(1.1)
(10.3)
(5.4)
UK
FTSE
6,032
(2.5)
(11.9)
(9.1)
Japan
Nikkei
18,070
(10.6)
(10.4)
14.4
Germany
DAX
9,613
(0.4)
(16.2)
0.2
France
CAC
4,433
1.1
(12.1)
1.7
Source: Bloomberg, Angel Research
Market Outlook
September 24, 2015
Stock Watch
Company Name
Reco
CMP
Target
Mkt Cap
Sales ( Čcr )
OPM(%)
EPS (Č)
PER(x)
P/BV(x)
RoE(%)
EV/Sales(x)
(Č)
Price ( Č)
( Č cr )
FY16E FY17E
FY16E
FY17E
FY16E
FY17E
FY16E
FY17E
FY16E
FY17E
FY16E
FY17E
FY16E
FY17E
Agri / Agri Chemical
Rallis
Neutral
216
-
4,204
2,075
2,394
14.4
14.4
9.5
11.0
22.8
19.7
4.5
3.9
21.1
21.3
2.1
1.8
United Phosphorus
Accumulate
465
510
19,926
13,698
15,752
17.6
17.6
32.1
38.5
14.5
12.1
2.8
2.4
21.4
21.3
1.6
1.3
Auto & Auto Ancillary
Ashok Leyland
Accumulate
91
97
25,769
18,186
21,529
10.8
11.2
3.3
4.5
27.4
20.1
4.7
4.3
17.3
21.6
1.4
1.1
Bajaj Auto
Accumulate
2,240
2,438
64,825
23,544
27,245
19.8
19.8
127.0
143.4
17.6
15.6
5.3
4.6
30.3
29.4
2.3
2.0
Eicher Motors
Buy
18,254
22,859
49,547
11,681
15,550
15.3
16.9
358.5
564.3
50.9
32.4
15.3
11.4
29.8
34.9
4.1
3.1
Hero Motocorp
Accumulate
2,401
2,672
47,951
28,500
32,764
14.1
14.3
146.9
167.0
16.4
14.4
6.2
5.3
37.8
36.5
1.5
1.3
L G Balakrishnan & Bros Neutral
438
-
687
1,254
1,394
11.6
11.8
35.9
41.7
12.2
10.5
1.7
1.5
13.5
13.8
0.7
0.6
Mahindra and Mahindra Accumulate
1,212
1,383
75,261
38,337
43,069
13.0
13.4
52.9
63.5
22.9
19.1
3.4
3.0
15.0
15.9
1.6
1.4
Maruti
Accumulate
4,501
4,735
135,959
58,102
68,587
16.7
16.9
182.0
225.5
24.7
20.0
4.9
4.2
19.9
21.0
2.1
1.7
Minda Industries
Buy
526
652
834
2,567
2,965
7.3
8.0
38.8
54.3
13.5
9.7
2.0
1.6
14.4
16.8
0.4
0.4
Rane Brake Lining
Buy
285
366
225
454
511
11.1
11.4
23.8
28.1
12.0
10.1
1.7
1.5
14.2
15.3
0.6
0.6
Setco Automotive
Neutral
230
-
614
594
741
12.7
13.7
8.4
15.8
27.4
14.5
2.8
2.5
10.4
16.9
1.5
1.2
Tata Motors
Neutral
310
-
89,561
264,038
297,882
13.8
13.9
34.5
38.9
9.0
8.0
1.5
1.3
17.6
16.8
0.5
0.5
TVS Motor
Neutral
230
-
10,929
11,702
13,713
6.8
7.7
10.1
14.5
22.8
15.9
5.6
4.5
24.5
28.3
0.9
0.8
Amara Raja Batteries
Neutral
980
-
16,731
5,101
6,224
17.8
17.6
31.1
39.2
31.5
25.0
7.8
6.2
24.8
24.8
3.2
2.6
Exide Industries
Neutral
152
-
12,946
7,363
8,247
13.7
14.5
6.6
7.7
23.1
19.8
2.9
2.6
12.6
13.3
1.5
1.3
Apollo Tyres
Neutral
186
-
9,448
12,576
12,978
16.8
16.1
22.3
19.9
8.3
9.3
1.4
1.3
17.2
13.4
0.8
0.9
Ceat
Neutral
1,250
-
5,057
6,041
6,597
14.3
14.2
101.5
116.6
12.3
10.7
2.5
2.1
20.0
19.1
1.0
0.9
JK Tyres
Neutral
102
-
2,312
7,446
7,669
15.2
14.0
19.6
18.4
5.2
5.5
1.3
1.1
25.2
19.5
0.7
0.6
Swaraj Engines
Neutral
871
-
1,082
593
677
14.5
14.8
51.2
60.8
17.0
14.3
4.0
3.6
23.3
24.8
1.7
1.4
Subros
Neutral
78
-
469
1,268
1,488
11.6
11.9
3.7
6.6
21.2
11.9
1.4
1.3
6.8
11.4
0.7
0.6
Indag Rubber
Neutral
173
-
454
283
329
17.0
17.2
13.0
15.4
13.4
11.2
2.9
2.4
21.8
21.6
1.3
1.1
Capital Goods
ACE
Neutral
37
-
369
660
839
4.7
8.2
1.0
3.9
37.3
9.6
1.2
1.0
3.2
11.3
0.7
0.6
BEML
Neutral
1,244
-
5,179
3,277
4,006
6.0
8.9
29.2
64.3
42.6
19.3
2.4
2.2
5.7
11.7
1.7
1.3
BGR Energy
Neutral
106
-
766
3,615
3,181
9.5
9.4
16.7
12.4
6.4
8.6
0.6
0.6
10.0
7.0
0.6
0.8
BHEL
Neutral
199
-
48,744
33,722
35,272
10.8
11.7
10.5
14.2
19.0
14.0
1.4
1.3
7.0
9.0
1.5
1.5
Blue Star
Buy
332
387
2,989
3,649
4,209
5.0
5.9
9.2
14.7
36.3
22.6
6.6
6.2
9.1
17.5
0.9
0.8
Crompton Greaves
Buy
172
204
10,758
13,484
14,687
4.9
6.2
4.5
7.1
38.1
24.2
2.7
2.5
7.2
10.8
0.9
0.8
Inox Wind
Buy
358
505
7,937
4,980
5,943
17.0
17.5
26.6
31.6
13.5
11.3
4.0
3.0
35.0
30.0
1.7
1.4
Market Outlook
September 24, 2015
Stock Watch
Company Name
Reco
CMP
Target
Mkt Cap
Sales ( Čcr )
OPM(%)
EPS (Č)
PER(x)
P/BV(x)
RoE(%)
EV/Sales(x)
(Č)
Price ( Č)
( Č cr )
FY16E
FY17E
FY16E
FY17E
FY16E
FY17E
FY16E
FY17E
FY16E
FY17E
FY16E
FY17E
FY16E
FY17E
Capital Goods
KEC International
Neutral
140
-
3,603
8,791
9,716
6.1
6.8
5.4
8.2
26.0
17.1
2.6
2.4
10.0
14.0
0.6
0.6
Thermax
Neutral
895
-
10,666
6,413
7,525
7.4
8.5
30.5
39.3
29.4
22.8
4.5
3.9
15.0
17.0
1.6
1.3
Cement
ACC
Accumulate
1,349
1,548
25,331
11,856
14,092
14.5
17.8
47.6
76.1
28.3
17.7
2.9
2.7
10.6
15.7
2.0
1.6
Ambuja Cements
Accumulate
209
233
32,404
10,569
12,022
20.7
22.2
8.7
10.7
24.0
19.5
3.1
2.9
13.0
15.2
2.7
2.3
India Cements
Buy
75
112
2,310
4,716
5,133
15.9
16.9
3.7
7.5
20.3
10.0
0.8
0.7
3.8
7.3
0.8
0.7
JK Cement
Buy
645
767
4,512
4,056
4,748
14.5
17.0
22.6
41.1
28.6
15.7
2.6
2.3
9.3
15.3
1.5
1.3
J K Lakshmi Cement
Buy
365
430
4,293
2,947
3,616
16.7
19.9
11.5
27.2
31.7
13.4
3.0
2.6
9.8
20.8
1.9
1.5
Mangalam Cements
Neutral
233
-
622
1,053
1,347
10.5
13.3
8.4
26.0
27.7
9.0
1.2
1.1
4.3
12.5
1.0
0.7
Orient Cement
Buy
155
183
3,170
1,854
2,524
21.2
22.2
7.7
11.1
20.1
13.9
2.9
2.5
13.3
15.7
2.4
1.7
Ramco Cements
Accumulate
319
350
7,595
4,036
4,545
20.8
21.3
15.1
18.8
21.1
17.0
2.6
2.3
12.9
14.3
2.4
2.1
Shree Cement^
Neutral
11,499
-
40,060
7,150
8,742
26.7
28.6
228.0
345.5
50.4
33.3
7.4
6.2
15.7
20.3
5.4
4.3
UltraTech Cement
Buy
2,783
3,282
76,375
27,562
31,548
20.4
22.3
111.9
143.3
24.9
19.4
3.5
3.0
15.2
16.8
2.8
2.4
Construction
ITNL
Neutral
97
-
2,382
7,360
8,825
34.0
35.9
1.0
5.0
96.6
19.3
0.4
0.4
0.3
1.4
3.8
3.7
KNR Constructions
Neutral
562
-
1,581
915
1,479
14.3
13.9
20.3
37.2
27.7
15.1
2.5
2.2
9.6
15.6
1.9
1.2
Larsen & Toubro
Buy
1,496
2,013
139,222
68,920
82,446
10.9
11.5
57.0
73.0
26.2
20.5
2.4
2.2
13.6
15.5
2.2
1.9
Gujarat Pipavav Port
Neutral
190
-
9,173
721
784
53.1
53.6
8.2
9.1
23.1
20.9
3.7
3.0
20.0
18.3
12.3
10.9
MBL Infrastructures
Buy
240
360
996
2,313
2,797
12.2
14.6
19.0
20.0
12.6
12.0
1.3
1.2
11.3
10.6
1.1
1.0
Nagarjuna Const.
Neutral
69
-
3,825
7,892
8,842
8.3
9.1
2.4
5.3
28.7
13.0
1.2
1.1
4.2
8.6
0.7
0.6
PNC Infratech
Neutral
450
-
2,308
1,798
2,132
13.2
13.5
22.0
30.0
20.5
15.0
1.8
1.7
11.5
11.4
1.4
1.2
Simplex Infra
Neutral
271
-
1,340
6,241
7,008
10.4
10.7
20.0
36.0
13.6
7.5
1.1
1.0
6.8
11.1
0.7
0.6
Financials
Allahabad Bank
Neutral
78
-
4,468
8,438
9,521
2.8
2.8
21.9
27.0
3.6
2.9
0.4
0.3
10.2
11.5
-
-
Axis Bank
Buy
512
701
121,707
26,941
32,298
3.5
3.6
37.4
46.4
13.7
11.0
2.8
2.4
18.7
20.0
-
-
Bank of Baroda
Neutral
188
-
41,654
19,027
21,737
1.9
2.0
16.9
24.5
11.1
7.7
1.0
0.9
9.1
12.1
-
-
Bank of India
Neutral
136
-
9,049
16,438
18,706
1.9
2.0
19.2
40.9
7.1
3.3
0.4
0.3
4.5
9.1
-
-
Canara Bank
Neutral
279
-
14,353
15,491
17,269
2.0
2.0
61.6
70.9
4.5
3.9
0.5
0.5
10.5
11.1
-
-
Dena Bank
Neutral
41
-
2,287
3,498
3,977
2.1
2.3
7.8
10.7
5.2
3.8
0.4
0.4
6.5
8.4
-
-
Federal Bank
Neutral
64
-
11,022
3,527
4,135
3.0
3.1
5.2
6.7
12.4
9.6
1.3
1.2
10.8
12.7
-
-
HDFC
Neutral
1,167
-
184,073
10,883
12,799
3.5
3.4
43.0
50.6
27.2
23.1
5.4
4.9
25.9
26.7
-
-
HDFC Bank
Buy
1,050
1,255
264,278
38,059
46,851
4.4
4.5
50.0
62.7
21.0
16.8
3.7
3.1
18.8
20.2
-
-
Market Outlook
September 24, 2015
Stock Watch
Company Name
Reco
CMP
Target
Mkt Cap
Sales ( Čcr )
OPM(%)
EPS (Č)
PER(x)
P/BV(x)
RoE(%)
EV/Sales(x)
(Č)
Price ( Č)
( Č cr )
FY16E
FY17E
FY16E
FY17E
FY16E
FY17E
FY16E
FY17E
FY16E
FY17E
FY16E
FY17E
FY16E
FY17E
Financials
ICICI Bank
Buy
274
370
159,063
35,810
41,871
3.4
3.5
22.0
26.2
12.5
10.5
2.2
1.8
15.0
15.6
-
-
IDBI Bank
Neutral
73
-
11,725
9,860
10,978
1.8
1.9
9.3
15.6
7.9
4.7
0.5
0.5
6.4
10.1
-
-
Indian Bank
Neutral
135
-
6,494
6,267
7,171
2.4
2.5
25.4
32.1
5.3
4.2
0.4
0.4
8.0
9.3
-
-
LIC Housing Finance
Buy
436
570
21,991
2,934
3,511
2.3
2.3
30.9
36.8
14.1
11.8
2.3
2.0
16.8
17.5
-
-
Oriental Bank
Neutral
132
-
3,960
7,730
8,595
2.4
2.5
38.8
47.4
3.4
2.8
0.3
0.3
8.6
9.8
-
-
Punjab Natl.Bank
Neutral
136
-
25,139
23,446
26,624
2.8
2.9
17.8
27.5
7.6
4.9
0.8
0.6
8.5
12.1
-
-
South Ind.Bank
Neutral
21
-
2,849
1,930
2,215
2.4
2.4
2.6
3.6
8.1
5.9
0.8
0.7
9.9
12.5
-
-
St Bk of India
Buy
240
307
181,665
83,847
96,307
2.8
2.8
20.1
25.1
12.0
9.6
1.3
1.2
11.5
13.1
-
-
Union Bank
Neutral
179
-
11,396
12,755
14,439
2.3
2.4
31.5
39.9
5.7
4.5
0.6
0.5
9.9
11.6
-
-
Vijaya Bank
Neutral
35
-
2,977
3,594
3,969
1.8
1.9
5.8
7.1
5.9
4.9
0.5
0.5
8.2
9.3
-
-
Yes Bank
Buy
739
953
30,917
7,204
9,078
3.2
3.2
57.8
69.5
12.8
10.6
2.3
1.9
19.6
22.6
-
-
FMCG
Asian Paints
Neutral
794
-
76,165
16,553
19,160
16.0
16.2
17.7
21.5
44.9
36.9
11.9
10.7
29.4
31.2
4.4
3.8
Britannia
Neutral
2,886
-
34,621
8,065
9,395
9.6
10.2
47.2
65.5
61.1
44.1
20.3
19.2
38.3
41.2
4.1
3.6
Colgate
Buy
938
2,022
25,524
4,836
5,490
19.5
19.7
48.5
53.2
19.4
17.6
14.2
12.4
99.8
97.5
5.2
4.6
Dabur India
Neutral
276
-
48,488
9,370
10,265
17.1
17.2
7.3
8.1
37.6
34.1
11.4
9.2
33.7
30.6
5.1
4.6
GlaxoSmith Con*
Neutral
5,943
-
24,994
4,919
5,742
17.2
17.4
168.3
191.2
35.3
31.1
10.0
8.5
28.8
28.9
4.6
3.9
Godrej Consumer
Neutral
1,167
-
39,742
10,168
12,886
16.1
16.1
32.1
38.4
36.4
30.4
7.4
6.8
19.7
21.0
4.0
3.2
HUL
Neutral
786
-
170,014
34,940
38,957
17.5
17.7
20.8
24.7
37.8
31.8
42.0
33.6
110.5
114.2
4.7
4.2
ITC
Buy
316
409
253,580
41,068
45,068
37.8
37.4
13.9
15.9
22.7
19.9
7.6
6.7
34.1
33.8
5.8
5.3
Marico
Neutral
391
-
25,216
6,551
7,766
15.7
16.0
10.4
12.5
37.7
31.3
10.9
9.1
33.2
32.4
3.8
3.2
Nestle*
Accumulate
6,235
6,646
60,116
11,291
12,847
22.2
22.3
158.9
184.6
39.2
33.8
20.5
18.5
55.0
57.3
5.2
4.5
Tata Global
Buy
125
152
7,883
8,635
9,072
9.8
9.9
6.5
7.6
19.2
16.5
1.9
1.8
6.8
7.4
0.9
0.8
IT
HCL Tech^
Buy
928
1,132
130,433
42,038
47,503
23.5
23.5
56.4
62.9
16.5
14.8
3.8
2.9
23.2
19.8
2.7
2.2
Infosys
Buy
1,117
1,306
256,488
60,250
66,999
28.0
28.0
58.3
63.7
19.2
17.5
4.0
3.5
20.9
19.7
3.6
3.1
TCS
Buy
2,534
3,168
496,351
108,420
123,559
28.8
28.7
127.2
143.9
19.9
17.6
7.9
7.4
39.9
41.8
4.2
3.6
Tech Mahindra
Buy
556
646
53,489
25,566
28,890
16.0
17.0
26.3
31.9
21.1
17.4
3.8
3.2
17.9
18.6
1.9
1.6
Wipro
Buy
592
719
146,276
52,414
58,704
23.7
23.8
38.4
42.3
15.4
14.0
3.0
2.7
19.5
18.0
2.4
2.0
Media
D B Corp
Accumulate
318
356
5,850
2,241
2,495
27.8
27.9
21.8
25.6
14.6
12.4
3.8
3.4
26.7
28.5
2.6
2.3
HT Media
Neutral
83
-
1,938
2,495
2,603
11.2
11.2
7.3
8.6
11.4
9.7
0.9
0.8
7.4
8.1
0.3
0.3
Market Outlook
September 24, 2015
Stock Watch
Company Name
Reco
CMP
Target
Mkt Cap
Sales ( Čcr )
OPM(%)
EPS (Č)
PER(x)
P/BV(x)
RoE(%)
EV/Sales(x)
(Č)
Price ( Č)
( Č cr )
FY16E FY17E
FY16E
FY17E
FY16E
FY17E
FY16E
FY17E
FY16E
FY17E
FY16E
FY17E
FY16E
FY17E
Media
Jagran Prakashan
Accumulate
137
156
4,489
1,939
2,122
26.0
26.0
8.3
9.2
16.5
14.9
2.8
2.6
17.5
17.1
2.3
2.1
Sun TV Network
Neutral
365
-
14,396
2,779
3,196
70.2
70.5
22.8
27.3
16.0
13.4
4.0
3.6
26.7
28.3
4.9
4.3
Hindustan Media
Buy
228
292
1,671
920
1,031
20.0
20.0
19.2
20.9
11.9
10.9
2.0
1.7
16.4
15.3
1.4
1.2
Ventures
Metals & Mining
Coal India
Buy
328
400
207,019
72,015
78,415
21.2
21.5
21.7
25.3
15.1
13.0
5.1
5.0
33.1
39.1
2.1
2.0
Hind. Zinc
Neutral
135
-
57,232
15,258
16,495
44.2
45.6
17.6
19.2
7.7
7.1
1.2
1.1
15.9
15.3
1.5
1.0
Hindalco
Neutral
73
-
15,074
104,356
111,186
8.7
9.5
6.7
11.1
10.9
6.6
0.4
0.4
3.5
5.9
0.7
0.6
JSW Steel
Neutral
874
-
21,130
48,125
53,595
18.8
21.0
46.9
97.5
18.6
9.0
0.9
0.8
4.4
9.5
1.3
1.1
NMDC
Neutral
98
-
38,914
8,237
10,893
46.6
44.5
10.0
11.7
9.9
8.4
1.1
1.0
12.5
13.0
4.5
3.4
SAIL
Neutral
51
-
20,981
45,915
53,954
7.2
10.5
1.5
4.4
33.7
11.6
0.5
0.5
2.3
4.1
1.1
1.0
Vedanta
Neutral
95
-
28,179
71,445
81,910
26.2
26.3
12.9
19.2
7.4
5.0
0.5
0.5
7.2
8.9
0.8
0.6
Tata Steel
Neutral
221
-
21,474
136,805
149,228
11.3
11.9
26.4
36.8
8.4
6.0
0.7
0.6
6.0
8.0
0.7
0.6
Oil & Gas
Cairn India
Neutral
148
-
27,701
11,323
12,490
49.4
51.0
20.7
20.7
7.1
7.2
0.5
0.4
6.4
6.1
1.5
0.9
GAIL
Neutral
287
-
36,437
64,856
70,933
9.1
9.6
24.0
28.9
12.0
10.0
1.0
1.0
8.8
9.6
0.7
0.7
ONGC
Neutral
236
-
202,038
154,564
167,321
36.8
37.4
28.6
32.5
8.3
7.3
1.1
1.0
12.7
13.5
1.5
1.4
Petronet LNG
Buy
177
210
13,271
39,007
40,785
3.8
4.2
9.2
11.0
19.3
16.1
2.2
2.0
11.6
12.7
0.4
0.4
Indian Oil Corp
Buy
396
455
96,050
359,607
402,760
5.9
6.1
42.5
48.7
9.3
8.1
1.2
1.1
14.1
14.4
0.4
0.3
Reliance Industries
Accumulate
851
930
275,720
313,085
362,904
13.1
13.8
78.4
92.9
10.9
9.2
1.1
1.0
10.8
11.6
1.3
1.2
Pharmaceuticals
Alembic Pharma
Neutral
678
-
12,776
2,601
3,115
21.2
20.2
20.8
23.9
32.6
28.4
10.5
7.9
37.2
31.8
4.9
4.1
Aurobindo Pharma
Buy
733
872
42,813
14,923
17,162
23.0
23.0
38.2
43.6
19.2
16.8
5.9
4.5
36.0
30.2
3.2
2.7
Aventis*
Neutral
4,150
-
9,557
2,156
2,455
15.1
16.8
109.7
133.9
37.8
31.0
5.2
4.2
18.4
22.5
4.1
3.5
Cadila Healthcare
Neutral
2,018
-
41,325
10,224
11,840
20.0
21.0
71.0
85.6
28.4
23.6
7.6
6.0
30.1
28.5
4.1
3.5
Cipla
Neutral
642
-
51,567
14,359
16,884
21.3
19.7
28.4
30.5
22.6
21.1
4.0
3.4
19.3
17.5
3.6
3.0
Dr Reddy's
Accumulate
3,942
4,169
67,210
17,903
20,842
22.7
22.8
160.5
189.5
24.6
20.8
5.0
4.1
22.2
21.7
3.7
3.1
Dishman Pharma
Neutral
307
-
2,477
1,716
1,888
20.2
20.2
16.3
21.6
18.8
14.2
1.8
1.6
9.7
11.7
1.6
1.3
GSK Pharma*
Neutral
3,344
-
28,329
2,870
3,158
20.0
22.1
59.5
68.3
56.2
49.0
16.6
17.0
28.5
34.3
9.4
8.6
Indoco Remedies
Neutral
326
-
3,005
1,088
1,262
18.2
18.2
13.1
15.5
24.9
21.0
4.9
4.1
21.2
21.1
2.8
2.4
Ipca labs
Accumulate
755
800
9,522
3,507
4,078
17.6
18.6
25.8
32.0
29.3
23.6
3.8
3.3
13.8
14.9
3.0
2.6
Lupin
Neutral
1,921
-
86,474
14,864
17,244
26.9
26.9
62.1
71.1
30.9
27.0
7.5
6.0
27.4
24.6
5.6
4.7
Sun Pharma
Accumulate
897
950
215,857
28,163
32,610
25.8
30.7
17.4
26.9
51.6
33.4
4.9
4.2
13.0
16.6
7.1
5.9
Market Outlook
September 24, 2015
Stock Watch
Company Name
Reco
CMP
Target
Mkt Cap
Sales ( Čcr )
OPM(%)
EPS (Č)
PER(x)
P/BV(x)
RoE(%)
EV/Sales(x)
(Č)
Price ( Č)
( Č cr )
FY16E FY17E
FY16E
FY17E
FY16E
FY17E
FY16E
FY17E
FY16E
FY17E
FY16E
FY17E
FY16E
FY17E
Power
Tata Power
Neutral
63
-
17,107
35,923
37,402
22.6
22.8
4.1
5.2
15.6
12.3
1.2
1.1
7.5
9.3
1.4
1.3
NTPC
Buy
121
157
100,059
87,064
98,846
23.5
23.5
11.7
13.2
10.4
9.2
1.2
1.1
11.4
12.1
2.2
1.9
Power Grid
Buy
128
170
66,991
20,702
23,361
86.7
86.4
12.1
13.2
10.6
9.7
1.6
1.4
15.6
15.1
8.2
7.6
Telecom
Bharti Airtel
Neutral
338
-
135,152
101,748
109,191
32.1
31.7
12.0
12.5
28.2
27.1
1.9
1.8
6.9
6.7
2.0
1.8
Idea Cellular
Neutral
141
-
50,859
34,282
36,941
32.0
31.5
5.9
6.2
24.0
22.8
2.2
2.0
9.9
9.3
2.1
1.9
zOthers
Abbott India
Neutral
5,784
-
12,290
2,715
3,153
14.5
14.1
134.3
152.2
43.1
38.0
10.8
8.9
27.4
25.6
4.2
3.6
Bajaj Electricals
Buy
250
341
2,517
4,719
5,287
5.2
5.8
8.6
12.7
29.2
19.7
3.3
2.9
11.4
14.8
0.5
0.5
Finolex Cables
Neutral
232
-
3,541
2,728
3,036
10.8
11.0
14.4
16.8
16.1
13.8
2.4
2.1
15.2
15.3
1.0
0.9
Goodyear India*
Buy
556
655
1,283
1,953
1,766
12.4
12.0
67.4
59.6
8.3
9.3
2.1
1.8
27.7
20.2
0.4
0.4
Hitachi
Neutral
1,317
-
3,580
1,806
2,112
9.0
9.2
28.6
29.1
46.0
45.3
11.4
9.2
28.1
22.6
2.1
1.7
Jyothy Laboratories
Neutral
309
-
5,595
1,620
1,847
11.5
11.5
7.3
8.5
42.4
36.5
5.5
5.1
13.3
14.4
3.3
2.8
MRF
Accumulate
40,932
43,575
17,360
20,727
14,841
19.3
18.6
4,905.8
3,351.9
8.3
12.2
2.7
2.2
37.6
19.6
0.8
1.1
Page Industries
Neutral
12,985
-
14,484
1,929
2,450
19.8
20.1
229.9
299.0
56.5
43.4
24.9
17.3
52.1
47.1
7.5
5.9
Relaxo Footwears
Neutral
535
-
6,420
1,767
2,152
12.3
12.5
19.3
25.1
27.8
21.4
6.8
5.2
27.7
27.8
3.7
3.0
Siyaram Silk Mills
Buy
973
1,221
912
1,653
1,873
11.7
12.2
99.3
122.1
9.8
8.0
1.8
1.5
19.5
20.2
0.7
0.6
Styrolution ABS India*
Neutral
748
-
1,316
1,271
1,440
8.6
9.2
32.0
41.1
23.4
18.2
2.4
2.1
10.7
12.4
1.0
0.9
Tree House
Buy
346
449
1,465
259
324
56.8
56.8
17.0
21.7
20.4
16.0
2.1
1.8
10.1
11.5
5.6
4.6
TVS Srichakra
Buy
2,645
3,210
2,025
2,127
2,388
15.2
14.9
237.7
267.5
11.1
9.9
4.7
3.4
51.7
39.8
1.0
0.9
HSIL
Accumulate
276
302
1,999
2,182
2,404
16.3
16.5
15.8
18.9
17.5
14.6
1.4
1.3
8.4
9.4
1.3
1.1
Kirloskar Engines India
Neutral
288
-
4,171
2,634
3,252
10.1
12.0
10.9
17.4
26.5
16.5
3.0
2.6
11.4
16.8
1.2
0.9
Ltd
M M Forgings
Buy
547
797
660
563
671
22.1
22.9
51.0
66.5
10.7
8.2
2.2
1.8
23.1
24.1
1.3
1.1
Banco Products (India)
Neutral
116
-
830
1,208
1,353
11.0
12.3
10.8
14.5
10.8
8.0
1.2
1.1
11.9
14.5
0.7
0.6
Competent Automobiles Neutral
148
-
91
1,007
1,114
3.1
3.1
23.7
28.2
6.3
5.2
0.9
0.8
13.9
14.6
0.1
0.1
Nilkamal
Neutral
961
-
1,434
1,948
2,147
10.6
10.3
60.0
67.0
16.0
14.3
2.5
2.2
16.8
16.1
0.8
0.7
Visaka Industries
Buy
127
166
202
1,158
1,272
8.6
9.5
23.7
32.7
5.4
3.9
0.5
0.5
10.1
12.5
0.3
0.3
Transport Corporation of
Buy
242
293
1,843
2,830
3,350
8.8
9.0
14.4
18.3
16.9
13.2
2.6
2.3
15.4
17.1
0.8
0.7
India
Elecon Engineering
Buy
71
87
775
1,452
1,596
14.0
14.7
4.4
6.2
16.1
11.4
1.3
1.2
8.6
11.2
0.8
0.7
Surya Roshni
Buy
125
183
549
2,992
3,223
8.3
8.5
14.7
18.3
8.5
6.9
0.8
0.7
9.8
11.0
0.5
0.4
MT Educare
Buy
128
169
510
286
366
18.3
17.7
7.7
9.4
16.6
13.7
3.5
3.1
20.2
21.1
1.7
1.3
Market Outlook
September 24, 2015
Stock Watch
Company Name
Reco
CMP
Target Mkt Cap
Sales ( Čcr )
OPM(%)
EPS (Č)
PER(x)
P/BV(x)
RoE(%)
EV/Sales(x)
(Č)
Price ( Č)
( Č cr )
FY16E FY17E FY16E FY17E FY16E FY17E FY16E FY17E FY16E FY17E FY16E FY17E FY16E FY17E
zOthers
Radico Khaitan
Buy
84
112
1,119
1,565
1,687
11.9
12.4
5.4
6.6
15.5
12.8
1.2
1.2
8.0
9.0
1.2
1.2
Garware Wall Ropes
Buy
333
390
728
875
983
10.4
10.6
23.1
27.8
14.4
12.0
2.0
1.8
14.1
14.8
0.8
0.7
Wonderla Holidays
Accumulate
286
322
1,616
206
308
44.0
43.6
9.0
12.9
31.8
22.2
4.3
3.9
13.7
17.8
7.7
5.1
Linc Pen & Plastics
Buy
151
185
223
340
371
8.3
8.9
10.8
13.2
14.0
11.5
2.2
2.0
16.0
17.1
0.7
0.6
The Byke Hospitality
Accumulate
161
181
646
222
287
20.5
20.5
5.6
7.6
28.6
21.3
5.4
4.4
18.9
20.8
2.9
2.3
Source: Company, Angel Research; Note: *December year end; #September year end; &October year end; Price as on September 23, 2015
Market Outlook
September 24, 2015
Research Team Tel: 022 - 39357800
DISCLAIMER
Angel Broking Private Limited (hereinafter referred to as “Angel”) is a registered Member of National Stock Exchange of India Limited,
Bombay Stock Exchange Limited and MCX Stock Exchange Limited. It is also registered as a Depository Participant with CDSL and
Portfolio Manager with SEBI. It also has registration with AMFI as a Mutual Fund Distributor. Angel Broking Private Limited is a registered
entity with SEBI for Research Analyst in terms of SEBI (Research Analyst) Regulations, 2014 vide registration number INH000000164.
Angel or its associates has not been debarred/ suspended by SEBI or any other regulatory authority for accessing /dealing in securities
Market. Angel or its associates including its relatives/analyst do not hold any financial interest/beneficial ownership of more than 1% in
the company covered by Analyst. Angel or its associates/analyst has not received any compensation / managed or co-managed public
offering of securities of the company covered by Analyst during the past twelve months. Angel/analyst has not served as an officer,
director or employee of company covered by Analyst and has not been engaged in market making activity of the company covered by
Analyst.
This document is solely for the personal information of the recipient, and must not be singularly used as the basis of any investment
decision. Nothing in this document should be construed as investment or financial advice. Each recipient of this document should make
such investigations as they deem necessary to arrive at an independent evaluation of an investment in the securities of the companies
referred to in this document (including the merits and risks involved), and should consult their own advisors to determine the merits and
risks of such an investment.
Reports based on technical and derivative analysis center on studying charts of a stock's price movement, outstanding positions and
trading volume, as opposed to focusing on a company's fundamentals and, as such, may not match with a report on a company's
fundamentals.
The information in this document has been printed on the basis of publicly available information, internal data and other reliable sources
believed to be true, but we do not represent that it is accurate or complete and it should not be relied on as such, as this document is for
general guidance only. Angel Broking Pvt. Limited or any of its affiliates/ group companies shall not be in any way responsible for any
loss or damage that may arise to any person from any inadvertent error in the information contained in this report. Angel Broking Pvt.
Limited has not independently verified all the information contained within this document. Accordingly, we cannot testify, nor make any
representation or warranty, express or implied, to the accuracy, contents or data contained within this document. While Angel Broking
Pvt. Limited endeavors to update on a reasonable basis the information discussed in this material, there may be regulatory, compliance,
or other reasons that prevent us from doing so.
This document is being supplied to you solely for your information, and its contents, information or data may not be reproduced,
redistributed or passed on, directly or indirectly.
Neither Angel Broking Pvt. Limited, nor its directors, employees or affiliates shall be liable for any loss or damage that may arise from or
in connection with the use of this information.
Note: Please refer to the important ‘Stock Holding Disclosure' report on the Angel website (Research Section). Also, please refer to the
latest update on respective stocks for the disclosure status in respect of those stocks. Angel Broking Pvt. Limited and its affiliates may have
investment positions in the stocks recommended in this report.