Market Outlook
September 22, 2015
Dealer’s Diary
Domestic Indices
Chg (%)
(Pts)
(Close)
BSE Sensex
(0.1)
(26)
26,193
Indian markets are expected to open flat tracking the SGX Nifty and mixed Asian
Nifty
(0.1)
(5)
7,977
cues.
MID CAP
0.4
47
10,693
US markets closed in the green as most of the major sectors ended the day showing
SMALL CAP
1.2
131
1s0,935
only modest moves. Investors continue to watch for economic data that could
BSE HC
0.0
7
17,446
influence the Fed’s decision next month.
BSE PSU
0.8
53
6,842
European markets bounced back from the weakness at the end of the previous week
BANKEX
0.8
160
20,113
on bargain hunting and investor relief after the outcome of the Greek election over
AUTO
0.2
30
17,601
the weekend.
METAL
(0.1)
(6)
7,286
OIL & GAS
(0.3)
(24)
8,726
Indian markets closed flat led by global cues in the absence of any major domestic
triggers.
BSE IT
0.0
1
11,230
Global Indices
Chg (%)
(Pts)
(Close)
News & Result Analysis
Dow Jones
0.8
126
16,510
IDBI Bank may be given operational freedom
NASDAQ
0.0
1.7
4,829
Commodity M&As may run into hurdle
FTSE
0.1
4.6
6,109
Tata Motors to launch SCV passenger vehicle “Magic Mantra”
Refer detailed news analysis on the following page
Nikkei
(2.0)
(362)
18,070
Hang Seng
(0.7)
(164)
21,757
Markets Today
Straits Times
0.1
3
2,882
The trend deciding level for the day is 26,133 / 7,958 levels. If NIFTY trades above
Shanghai Com
1.9
59
3,157
this level during the first half-an-hour of trade then we may witness a further rally up
to 26,293 - 26,394 / 8,007 - 8,037 levels. However, if NIFTY trades below
Indian ADR
Chg (%)
(Pts)
(Close)
26,133 / 7,958 levels for the first half-an-hour of trade then it may correct towards
26,033 - 25,872 / 7,928 - 7,878 levels.
INFY
2.5
0.4
$17.9
WIT
1.5
0.2
$12.2
Indices
S2
S1
PIVOT
R1
R2
IBN
0.2
0.0
$8.7
SENSEX
25,872
26,033
26,133
26,293
26,394
HDB
1.5
0.9
$59.5
NIFTY
7,878
7,928
7,958
8,007
8,037
Advances / Declines
BSE
NSE
Net Inflows (September 18, 2015)
Advances
1,606
954
` cr
Purch
Sales
Net
MTD
YTD
Declines
1,058
531
FII
10,731
9,963
768
(2,236)
121,525
Unchanged
117
80
MFs
1,104
761
342
5,025
75,673
Volumes (` cr)
FII Derivatives (September 21, 2015)
BSE
2,358
` cr
Purch
Sales
Net
Open Interest
NSE
14,622
Index Futures
5,195
7,031
(1,836)
27,995
Stock Futures
10,399
10,082
317
49,657
Gainers / Losers
Gainer
Loser
Company
Price (`)
chg (%)
Company
Price (`)
chg (%)
IDBI
69
16.7
MOTHERSUMI
262
(7.6)
ESSAROIL
11
12.8
SUNASIAN
109
(5.0)
SCI
78
10.2
PMCFIN
1
(4.7)
TORNTPOWER
179
8.7
CRISIL
1,842
(4.0)
POLARIS
184
8.1
HATHWAY
40
(4.0)
Market Outlook
September 22, 2015
IDBI Bank may be given operational freedom
Indian government is working out measures to reform functioning of state-owned
banks. Government has holding in Axis Bank through various government
instrumentalities with no interference in operations of bank and the performance
of the bank has been commendable. Finance minister Arun Jaitley suggested that
government may allow IDBI Bank to follow a model similar to Axis Bank Ltd of
greater operational freedom. There is lack of clarity on this issue; hence we
maintain Neutral rating on the stock, however development on this front would be
positive for the stock.
Commodity M&As may run into hurdle
The Centre has asserted that captive mines allotted in the past cannot be
transferred under the new mining law. The government's stance is based on the
new Mines and Mineral Development and Regulation Act of 2015 (MMDR) that
only allows transfer of mining leases in cases where the right to mine has been
acquired through an auction. This could mean big-ticket deals such as UltraTech's
takeover of Jaypee's cement plants and Lafarge's plan to sell two units to Birla
Cement may have to be renegotiated.
The stand, as explained by Mines Secretary Balvinder Kumar, is expected to block
consolidation moves in mineral-dependent commodity sectors such as steel,
aluminium and cement. The mines ministry had sought the law ministry's opinion
on the issue, especially since the rules for mineral development have a provision
for transferring mining rights. The law ministry is clear that the Act's provisions
override the rules and the MMDR law is very clearly phrased so that the
transferability clause will be applicable only for future mines that would be
auctioned.
Tata Motors to launch SCV passenger vehicle “Magic Mantra”
Tata Motors plans to launch a new small commercial vehicle (SCV) 'Magic Mantra'
next month, thereby expanding product range under its popular public transport
vehicle 'Tata Magic'. The new model would be powered by a 40 HP diesel engine
as compared to the 16 HP engine in the Tata Magic, thus making it more powerful
and capable of going long distances. The company currently sells around 2,000
units per month of Tata Magic range of vehicles in the country. Further, the
company has decided to double the warranty on these vehicles to 2 years or
72,000 kilometres as against the current 36,000 kilometres or one year. “Magic
Mantra” would further broaden the LCV passenger range for Tata Motors. We
currently have Buy rating on the stock.
Economic and Political News
Enhanced southwest monsoon to bring good rains: IMD
Indian economy to outpace 7.3% growth of last fiscal: Finance Minister
Tamil Nadu commercial tax collections up 6% in 2014-15
Corporate News
Infosys bags three-year deal from TOMS Shoes
NTPC's `700cr tax-free bonds to open tomorrow
Hindalco arm to sell its closed Australian copper mine to Lighthouse Minerals
Holdings for A$15 million
Market Outlook
September 22, 2015
Top Picks
Large Cap
Market Cap
CMP
Target
Upside
Company
Sector
Rating
(` Cr)
(`)
(`)
(%)
Aurobindo
Pharma
41,570
Buy
712
872
22.5
Axis Bank
Financials
1,25,511
Buy
528
701
32.8
ICICI Bank
Financials
1,62,258
Buy
279
370
32.4
Infosys
IT
2,53,732
Buy
1,105
1,306
18.2
Capital
Inox Wind
8,201
Buy
370
505
36.7
Goods
LIC HFL
Financials
22,690
Buy
450
570
26.8
Power Grid
Power
71,490
Buy
137
170
24.4
TCS
IT
4,99,613
Buy
2,551
3,168
24.2
Yes Bank
Financials
32,183
Buy
769
953
24.0
Sun Pharma
Pharma
2,16,519
Accumulate
900
950
5.6
Tech Mahindra IT
54,085
Accumulate
562
646
14.9
Source: Angel Research, Bloomberg
Mid Cap
Market
CMP
Target
Upside
Company
Sector
Cap (`
Rating
(`)
(`)
(%)
Cr)
Bajaj Electricals
Others
2,530
Buy
251
341
36.0
Garware Wall
Others
683
Buy
312
390
24.9
MBL Infra
Construction
1,040
Buy
251
360
43.5
Minda Industries Auto Ancillary
833
Buy
525
652
24.2
MT Educare
Others
524
Buy
132
169
28.4
Radico Khaitan
Others
1,143
Buy
86
112
30.4
Surya Roshni
Others
555
Buy
127
183
44.5
Tree House
Others
1,498
Buy
354
449
26.8
Source: Angel Research, Bloomberg
Market Outlook
September 22, 2015
Global economic events release calendar
Date
Time
Country Event Description
Unit
Period
Bloomberg Data
Last Reported Estimated
September 22, 2015
7:30PM
Euro Zone Euro-Zone Consumer Confidence
Value
Sep A
(6.90)
(7.00)
September 23, 2015
1:00PM
Germany PMI Services
Value
Sep P
54.90
54.50
1:00PM
Germany PMI Manufacturing
Value
Sep P
53.30
52.60
September 24, 2015
6:00PM
US
Initial Jobless claims
Thousands
Sep 19
264.00
274.50
7:30PM
US
New home sales
Thousands
Aug
507.00
515.00
September 25, 2015
6:00PM
US
GDP Qoq (Annualised)
% Change
2Q T
3.70
3.70
September 29, 2015
7:30PM
US
Consumer Confidence
S.A./ 1985=100
Sep
101.54
97.00
11:00AM
India
RBI Reverse Repo rate
%
Sep 29
6.25
6.00
11:00AM
India
RBI Repo rate
%
Sep 29
7.25
7.00
11:00AM
India
RBI Cash Reserve ratio
%
Sep 29
4.00
4.00
September 30, 2015
1:25PM
Germany Unemployment change (000's)
Thousands
Sep
(7.00)
--
2:00PM
UK
GDP (YoY)
% Change
2Q F
2.60
--
October 1, 2015
6:30AM
China
PMI Manufacturing
Value
Sep
49.70
--
2:00PM
UK
PMI Manufacturing
Value
Sep
51.50
--
October 2, 2015
6:00PM
US
Change in Nonfarm payrolls
Thousands
Sep
173.00
203.00
6:00PM
US
Unnemployment rate
%
Sep
5.10
5.10
October 7, 2015
2:00PM
UK
Industrial Production (YoY)
% Change
Aug
0.80
--
October 8, 2015
4:30PM
UK
BOE Announces rates
% Ratio
Oct 8
0.50
0.50
October 9, 2015
India
Imports YoY%
% Change
Sep
(9.95)
--
India
Exports YoY%
% Change
Sep
(20.66)
--
October 12, 2015
5:30PM
India
Industrial Production YoY
% Change
Aug
4.20
--
October 13, 2015
2:00PM
UK
CPI (YoY)
% Change
Sep
--
--
China
Exports YoY%
% Change
Sep
(5.50)
--
October 14, 2015
2:00PM
UK
Jobless claims change
% Change
Sep
1.20
--
12:00PM
India
Monthly Wholesale Prices YoY%
% Change
Sep
(4.95)
--
7:00AM
China
Consumer Price Index (YoY)
% Change
Sep
2.00
--
October 15, 2015
6:00PM
US
Consumer price index (mom)
% Change
Sep
(0.10)
--
October 16, 2015
6:45PM
US
Industrial Production
%
Sep
(0.38)
--
2:30PM
Euro Zone Euro-Zone CPI (YoY)
%
Sep F
0.10
--
Source: Bloomberg, Angel Research
Market Outlook
September 22, 2015
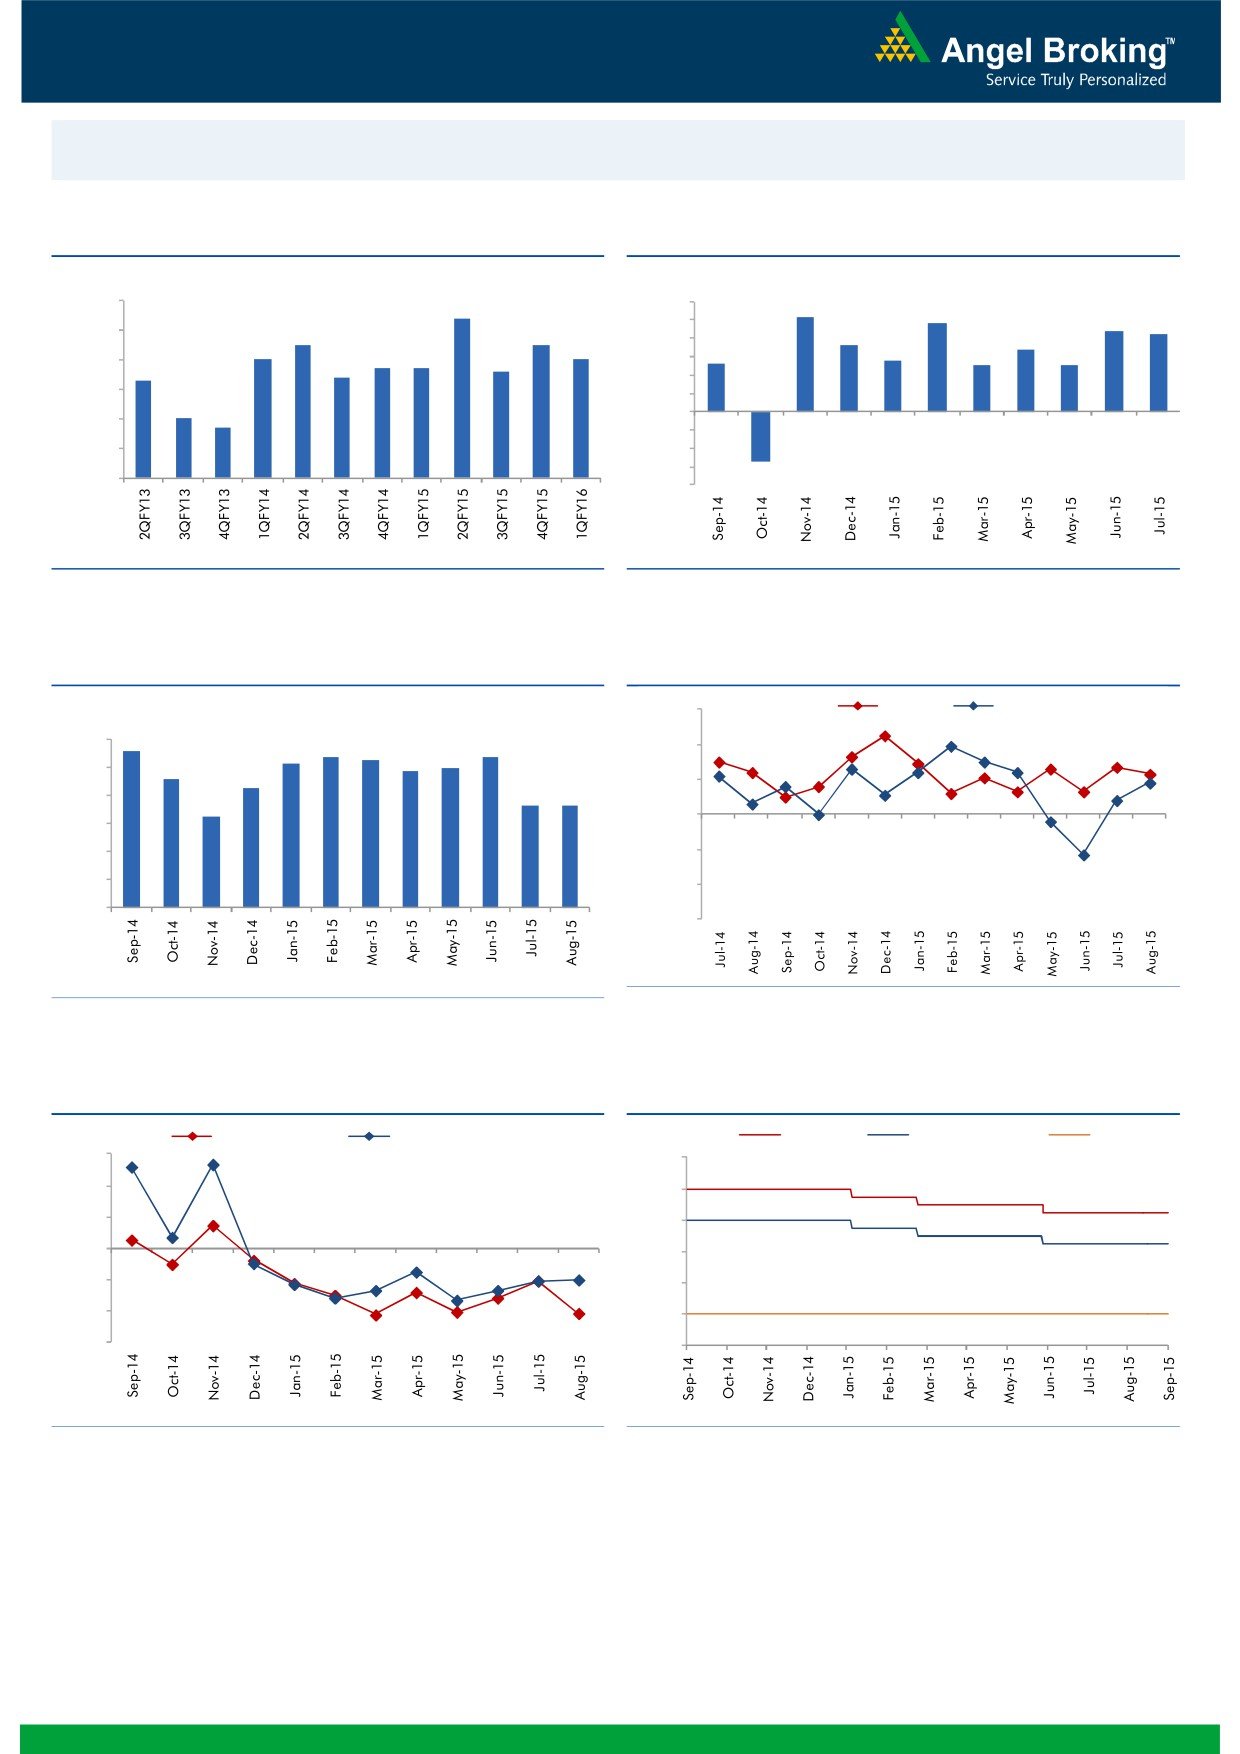
Macro watch
Exhibit 1: Quarterly GDP trends
Exhibit 2: IIP trends
(%)
(%)
9.0
8.4
6.0
5.2
4.8
4.4
4.2
5.0
8.0
7.5
7.5
3.6
4.0
3.4
7.0
7.0
2.8
2.6
2.5
2.5
6.7
6.7
6.6
3.0
7.0
6.3
6.4
2.0
6.0
1.0
5.0
4.7
-
5.0
(1.0)
4.0
(2.0)
(3.0)
3.0
(2.7)
(4.0)
Source: CSO, Angel Research
Source: MOSPI, Angel Research
Exhibit 3: Monthly CPI inflation trends
Exhibit 4: Manufacturing and services PMI
(%)
56.0
Mfg. PMI
Services PMI
5.6
6.0
5.4
5.3
5.4
54.0
5.2
5.0
4.9
4.6
5.0
4.3
52.0
3.7
3.7
4.0
3.3
50.0
3.0
2.0
48.0
1.0
46.0
-
44.0
Source: Market, Angel Research; Note: Level above 50 indicates expansion
Source: MOSPI, Angel Research
Exhibit 5: Exports and imports growth trends
Exhibit 6: Key policy rates
(%)
Exports yoy growth
Imports yoy growth
(%)
Repo rate
Reverse Repo rate
CRR
30.0
9.00
20.0
8.00
10.0
7.00
0.0
6.00
(10.0)
5.00
(20.0)
4.00
(30.0)
3.00
Source: Bloomberg, Angel Research
Source: RBI, Angel Research
Market Outlook
September 22, 2015
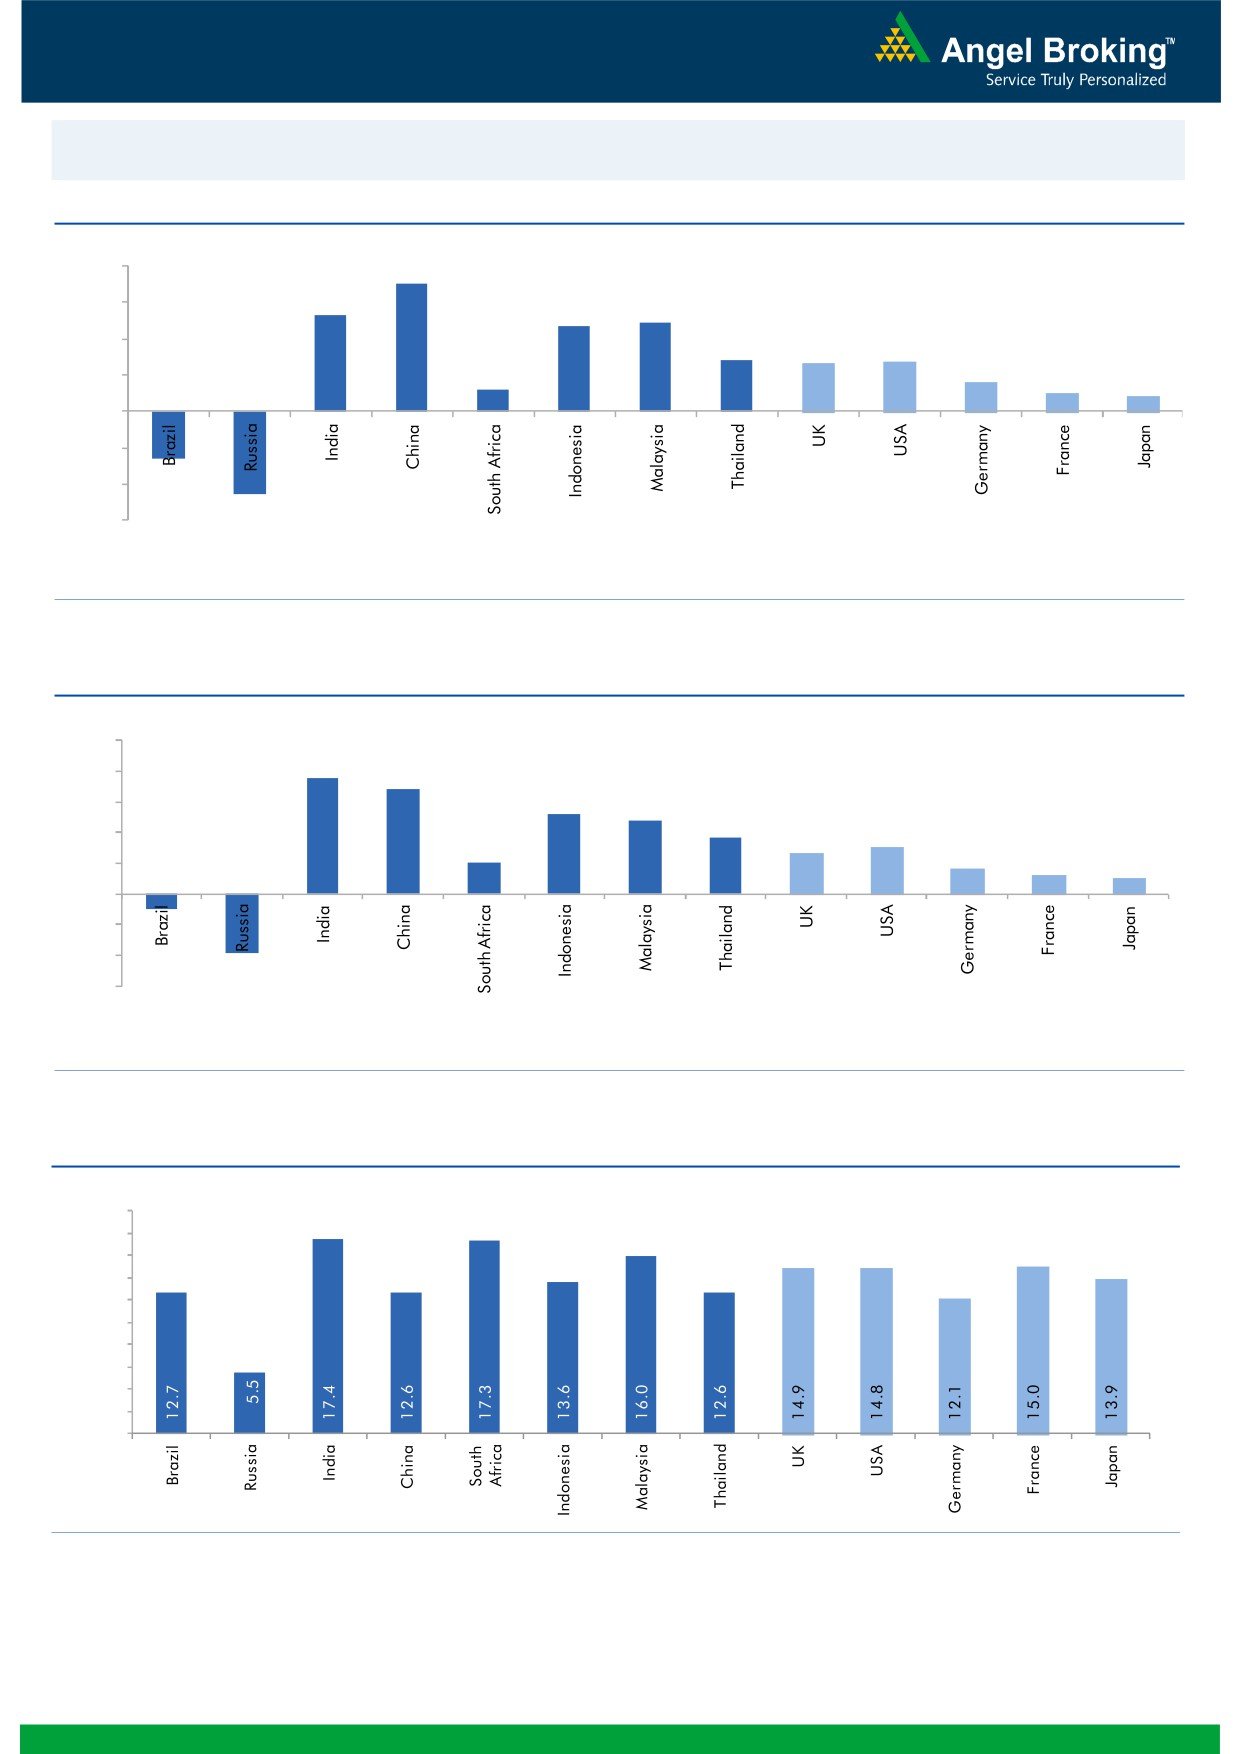
Global watch
Exhibit 1: Latest quarterly GDP Growth (%, yoy) across select developing and developed countries
(%)
8.0
7.0
6.0
5.3
4.9
4.7
4.0
2.8
2.6
2.7
1.6
2.0
1.2
1.0
0.8
(4.6)
(2.6)
-
(2.0)
(4.0)
(6.0)
Source: Bloomberg, Angel Research
Exhibit 2: 2015 GDP Growth projection by IMF (%, yoy) across select developing and developed countries
(%)
10.0
7.5
8.0
6.8
5.2
6.0
4.8
3.7
4.0
2.7
3.1
2.0
1.6
1.2
1.0
2.0
(3.8)
(1.0)
-
(2.0)
(4.0)
(6.0)
Source: IMF, Angel Research
Exhibit 3: One year forward P-E ratio across select developing and developed countries
(x)
20.0
18.0
16.0
14.0
12.0
10.0
8.0
6.0
4.0
2.0
-
Source: Bloomberg, Angel Research
Market Outlook
September 22, 2015
Exhibit 4: Relative performance of indices across globe
Returns (%)
Country
Name of index
Closing price
1M
3M
1YR
Brazil
Bovespa
46,590
1.9
(8.8)
(19.4)
Russia
Micex
1,700
2.2
4.0
18.7
India
Nifty
7,977
(3.9)
(3.4)
(2.1)
China
Shanghai Composite
3,161
(9.9)
(37.6)
38.1
South Africa
Top 40
45,380
4.6
(0.2)
(1.7)
Mexico
Mexbol
43,618
3.5
(2.9)
(3.7)
Indonesia
LQ45
737
1.4
(12.4)
(17.3)
Malaysia
KLCI
1,634
3.8
(2.4)
(11.5)
Thailand
SET 50
905
2.2
(8.4)
(14.7)
USA
Dow Jones
16,510
0.3
(7.0)
(4.5)
UK
FTSE
6,109
(1.3)
(7.8)
(9.8)
Japan
Nikkei
18,070
(7.0)
(7.8)
10.7
Germany
DAX
9,949
(1.7)
(7.3)
1.5
France
CAC
4,585
(1.0)
(3.3)
2.8
Source: Bloomberg, Angel Research
Market Outlook
September 22, 2015
Stock Watch
Company Name
Reco
CMP
Target
Mkt Cap
Sales ( Čcr )
OPM(%)
EPS (Č)
PER(x)
P/BV(x)
RoE(%)
EV/Sales(x)
(Č)
Price ( Č)
( Č cr )
FY16E FY17E
FY16E
FY17E
FY16E
FY17E
FY16E
FY17E
FY16E
FY17E
FY16E
FY17E
FY16E
FY17E
Agri / Agri Chemical
Rallis
Neutral
227
-
4,406
2,075
2,394
14.4
14.4
9.5
11.0
23.9
20.6
4.7
4.1
21.1
21.3
2.2
1.9
United Phosphorus
Accumulate
471
510
20,172
13,698
15,752
17.6
17.6
32.1
38.5
14.7
12.2
2.9
2.4
21.4
21.3
1.6
1.3
Auto & Auto Ancillary
Ashok Leyland
Accumulate
88
97
25,129
18,186
21,529
10.8
11.2
3.3
4.5
26.8
19.6
4.6
4.2
17.3
21.6
1.3
1.1
Bajaj Auto
Accumulate
2,303
2,438
66,643
23,544
27,245
19.8
19.8
127.0
143.4
18.1
16.1
5.5
4.7
30.3
29.4
2.4
2.0
Eicher Motors
Buy
18,478
22,859
50,154
11,681
15,550
15.3
16.9
358.5
564.3
51.5
32.8
15.5
11.5
29.8
34.9
4.2
3.1
Hero Motocorp
Accumulate
2,425
2,672
48,420
28,500
32,764
14.1
14.3
146.9
167.0
16.5
14.5
6.2
5.3
37.8
36.5
1.5
1.3
L G Balakrishnan & Bros Neutral
442
-
694
1,254
1,394
11.6
11.8
35.9
41.7
12.3
10.6
1.7
1.5
13.5
13.8
0.7
0.6
Mahindra and Mahindra Buy
1,184
1,383
73,562
38,337
43,069
13.0
13.4
52.9
63.5
22.4
18.7
3.4
3.0
15.0
15.9
1.6
1.3
Maruti
Accumulate
4,492
4,735
135,690
58,102
68,587
16.7
16.9
182.0
225.5
24.7
19.9
4.9
4.2
19.9
21.0
2.1
1.7
Minda Industries
Buy
525
652
833
2,567
2,965
7.3
8.0
38.8
54.3
13.5
9.7
2.0
1.6
14.4
16.8
0.4
0.4
Rane Brake Lining
Buy
292
366
231
454
511
11.1
11.4
23.8
28.1
12.3
10.4
1.7
1.6
14.2
15.3
0.6
0.6
Setco Automotive
Neutral
229
-
613
594
741
12.7
13.7
8.4
15.8
27.3
14.5
2.8
2.5
10.4
16.9
1.5
1.2
Tata Motors
Buy
332
391
95,740
264,038
297,882
13.8
13.9
34.5
38.9
9.6
8.5
1.6
1.4
17.6
16.8
0.5
0.5
TVS Motor
Neutral
234
-
11,098
11,702
13,713
6.8
7.7
10.1
14.5
23.1
16.1
5.7
4.6
24.5
28.3
0.9
0.8
Amara Raja Batteries
Neutral
1,010
-
17,253
5,101
6,224
17.8
17.6
31.1
39.2
32.5
25.8
8.1
6.4
24.8
24.8
3.3
2.7
Exide Industries
Neutral
154
-
13,052
7,363
8,247
13.7
14.5
6.6
7.7
23.3
19.9
2.9
2.7
12.6
13.3
1.5
1.4
Apollo Tyres
Neutral
193
-
9,845
12,576
12,978
16.8
16.1
22.3
19.9
8.7
9.7
1.5
1.3
17.2
13.4
0.9
0.9
Ceat
Neutral
1,261
-
5,099
6,041
6,597
14.3
14.2
101.5
116.6
12.4
10.8
2.5
2.1
20.0
19.1
1.0
0.9
JK Tyres
Neutral
105
-
2,388
7,446
7,669
15.2
14.0
19.6
18.4
5.4
5.7
1.4
1.1
25.2
19.5
0.7
0.6
Swaraj Engines
Neutral
874
-
1,085
593
677
14.5
14.8
51.2
60.8
17.1
14.4
4.0
3.6
23.3
24.8
1.7
1.4
Subros
Neutral
80
-
478
1,268
1,488
11.6
11.9
3.7
6.6
21.5
12.1
1.4
1.3
6.8
11.4
0.7
0.6
Indag Rubber
Neutral
180
-
473
283
329
17.0
17.2
13.0
15.4
13.9
11.7
3.0
2.5
21.8
21.6
1.4
1.1
Capital Goods
ACE
Neutral
39
-
388
660
839
4.7
8.2
1.0
3.9
39.3
10.1
1.2
1.1
3.2
11.3
0.7
0.6
BEML
Neutral
1,225
-
5,102
3,277
4,006
6.0
8.9
29.2
64.3
42.0
19.1
2.3
2.1
5.7
11.7
1.6
1.3
BGR Energy
Neutral
111
-
799
3,615
3,181
9.5
9.4
16.7
12.4
6.6
8.9
0.6
0.6
10.0
7.0
0.6
0.8
BHEL
Neutral
207
-
50,763
33,722
35,272
10.8
11.7
10.5
14.2
19.8
14.6
1.5
1.4
7.0
9.0
1.6
1.5
Blue Star
Accumulate
338
387
3,036
3,649
4,209
5.0
5.9
9.2
14.7
36.9
22.9
6.7
6.3
9.1
17.5
0.9
0.8
Crompton Greaves
Accumulate
178
204
11,147
13,484
14,687
4.9
6.2
4.5
7.1
39.5
25.1
2.8
2.6
7.2
10.8
1.0
0.9
Inox Wind
Buy
370
505
8,201
4,980
5,943
17.0
17.5
26.6
31.6
13.9
11.7
4.2
3.1
35.0
30.0
1.8
1.5
Market Outlook
September 22, 2015
Stock Watch
Company Name
Reco
CMP
Target
Mkt Cap
Sales ( Čcr )
OPM(%)
EPS (Č)
PER(x)
P/BV(x)
RoE(%)
EV/Sales(x)
(Č)
Price ( Č)
( Č cr )
FY16E
FY17E
FY16E
FY17E
FY16E
FY17E
FY16E
FY17E
FY16E
FY17E
FY16E
FY17E
FY16E
FY17E
Capital Goods
KEC International
Neutral
150
-
3,859
8,791
9,716
6.1
6.8
5.4
8.2
27.8
18.3
2.8
2.5
10.0
14.0
0.7
0.6
Thermax
Neutral
901
-
10,732
6,413
7,525
7.4
8.5
30.5
39.3
29.5
22.9
4.6
4.0
15.0
17.0
1.6
1.4
Cement
ACC
Accumulate
1,382
1,548
25,953
11,856
14,092
14.5
17.8
47.6
76.1
29.0
18.2
3.0
2.7
10.6
15.7
2.1
1.7
Ambuja Cements
Accumulate
210
233
32,551
10,569
12,022
20.7
22.2
8.7
10.7
24.1
19.6
3.1
2.9
13.0
15.2
2.7
2.3
India Cements
Buy
77
112
2,364
4,716
5,133
15.9
16.9
3.7
7.5
20.8
10.3
0.8
0.7
3.8
7.3
0.8
0.7
JK Cement
Buy
615
767
4,301
4,056
4,748
14.5
17.0
22.6
41.1
27.2
15.0
2.4
2.2
9.3
15.3
1.5
1.2
J K Lakshmi Cement
Buy
370
430
4,352
2,947
3,616
16.7
19.9
11.5
27.2
32.2
13.6
3.1
2.6
9.8
20.8
1.9
1.5
Mangalam Cements
Neutral
229
-
611
1,053
1,347
10.5
13.3
8.4
26.0
27.3
8.8
1.2
1.1
4.3
12.5
1.0
0.7
Orient Cement
Buy
157
183
3,221
1,854
2,524
21.2
22.2
7.7
11.1
20.4
14.2
2.9
2.5
13.3
15.7
2.5
1.7
Ramco Cements
Accumulate
317
350
7,536
4,036
4,545
20.8
21.3
15.1
18.8
21.0
16.8
2.6
2.3
12.9
14.3
2.4
2.0
Shree Cement^
Neutral
12,036
-
41,930
7,150
8,742
26.7
28.6
228.0
345.5
52.8
34.8
7.8
6.5
15.7
20.3
5.6
4.5
UltraTech Cement
Accumulate
2,906
3,282
79,742
27,562
31,548
20.4
22.3
111.9
143.3
26.0
20.3
3.7
3.2
15.2
16.8
3.0
2.5
Construction
ITNL
Neutral
96
-
2,375
7,360
8,825
34.0
35.9
1.0
5.0
96.3
19.3
0.4
0.4
0.3
1.4
3.8
3.7
KNR Constructions
Neutral
528
-
1,484
915
1,479
14.3
13.9
20.3
37.2
26.0
14.2
2.4
2.1
9.6
15.6
1.7
1.1
Larsen & Toubro
Buy
1,552
2,013
144,415
68,920
82,446
10.9
11.5
57.0
73.0
27.2
21.3
2.5
2.3
13.6
15.5
2.3
1.9
Gujarat Pipavav Port
Neutral
177
-
8,567
721
784
53.1
53.6
8.2
9.1
21.6
19.5
3.5
2.8
20.0
18.3
11.4
10.1
MBL Infrastructures
Buy
251
360
1,040
2,313
2,797
12.2
14.6
19.0
20.0
13.2
12.5
1.4
1.3
11.3
10.6
1.2
1.0
Nagarjuna Const.
Neutral
68
-
3,791
7,892
8,842
8.3
9.1
2.4
5.3
28.4
12.9
1.1
1.1
4.2
8.6
0.7
0.6
PNC Infratech
Neutral
480
-
2,461
1,798
2,132
13.2
13.5
22.0
30.0
21.8
16.0
2.0
1.8
11.5
11.4
1.5
1.2
Simplex Infra
Neutral
276
-
1,365
6,241
7,008
10.4
10.7
20.0
36.0
13.8
7.7
1.1
1.0
6.8
11.1
0.7
0.6
Financials
Allahabad Bank
Neutral
79
-
4,500
8,438
9,521
2.8
2.8
21.9
27.0
3.6
2.9
0.4
0.3
10.2
11.5
-
-
Axis Bank
Buy
528
701
125,512
26,941
32,298
3.5
3.6
37.4
46.4
14.1
11.4
2.9
2.5
18.7
20.0
-
-
Bank of Baroda
Neutral
192
-
42,461
19,027
21,737
1.9
2.0
16.9
24.5
11.4
7.8
1.0
0.9
9.1
12.1
-
-
Bank of India
Neutral
144
-
9,548
16,438
18,706
1.9
2.0
19.2
40.9
7.5
3.5
0.4
0.4
4.5
9.1
-
-
Canara Bank
Neutral
284
-
14,624
15,491
17,269
2.0
2.0
61.6
70.9
4.6
4.0
0.5
0.5
10.5
11.1
-
-
Dena Bank
Neutral
39
-
2,200
3,498
3,977
2.1
2.3
7.8
10.7
5.0
3.7
0.4
0.3
6.5
8.4
-
-
Federal Bank
Neutral
66
-
11,236
3,527
4,135
3.0
3.1
5.2
6.7
12.6
9.8
1.3
1.2
10.8
12.7
-
-
HDFC
Neutral
1,207
-
190,261
10,883
12,799
3.5
3.4
43.0
50.6
28.1
23.9
5.6
5.0
25.9
26.7
-
-
HDFC Bank
Buy
1,053
1,255
264,958
38,059
46,851
4.4
4.5
50.0
62.7
21.1
16.8
3.7
3.2
18.8
20.2
-
-
Market Outlook
September 22, 2015
Stock Watch
Company Name
Reco
CMP
Target
Mkt Cap
Sales ( Čcr )
OPM(%)
EPS (Č)
PER(x)
P/BV(x)
RoE(%)
EV/Sales(x)
(Č)
Price ( Č)
( Č cr )
FY16E
FY17E
FY16E
FY17E
FY16E
FY17E
FY16E
FY17E
FY16E
FY17E
FY16E
FY17E
FY16E
FY17E
Financials
ICICI Bank
Buy
279
370
162,258
35,810
41,871
3.4
3.5
22.0
26.2
12.7
10.7
2.2
1.9
15.0
15.6
-
-
IDBI Bank
Neutral
69
-
11,139
9,860
10,978
1.8
1.9
9.3
15.6
7.5
4.5
0.5
0.5
6.4
10.1
-
-
Indian Bank
Neutral
134
-
6,443
6,267
7,171
2.4
2.5
25.4
32.1
5.3
4.2
0.4
0.4
8.0
9.3
-
-
LIC Housing Finance
Buy
450
570
22,690
2,934
3,511
2.3
2.3
30.9
36.8
14.6
12.2
2.3
2.0
16.8
17.5
-
-
Oriental Bank
Neutral
137
-
4,120
7,730
8,595
2.4
2.5
38.8
47.4
3.5
2.9
0.3
0.3
8.6
9.8
-
-
Punjab Natl.Bank
Neutral
140
-
25,964
23,446
26,624
2.8
2.9
17.8
27.5
7.9
5.1
0.8
0.6
8.5
12.1
-
-
South Ind.Bank
Neutral
21
-
2,862
1,930
2,215
2.4
2.4
2.6
3.6
8.2
5.9
0.8
0.7
9.9
12.5
-
-
St Bk of India
Buy
245
307
185,486
83,847
96,307
2.8
2.8
20.1
25.1
12.2
9.8
1.3
1.2
11.5
13.1
-
-
Union Bank
Neutral
181
-
11,514
12,755
14,439
2.3
2.4
31.5
39.9
5.8
4.5
0.6
0.5
9.9
11.6
-
-
Vijaya Bank
Neutral
35
-
2,998
3,594
3,969
1.8
1.9
5.8
7.1
6.0
4.9
0.5
0.5
8.2
9.3
-
-
Yes Bank
Buy
769
953
32,183
7,204
9,078
3.2
3.2
57.8
69.5
13.3
11.1
2.4
2.0
19.6
22.6
-
-
FMCG
Asian Paints
Neutral
830
-
79,575
16,553
19,160
16.0
16.2
17.7
21.5
46.9
38.6
12.5
11.2
29.4
31.2
4.6
4.0
Britannia
Neutral
3,000
-
35,996
8,065
9,395
9.6
10.2
47.2
65.5
63.6
45.8
21.1
20.0
38.3
41.2
4.3
3.7
Colgate
Neutral
1,965
-
26,721
4,836
5,490
19.5
19.7
48.5
53.2
40.5
36.9
29.7
25.9
99.8
97.5
5.4
4.8
Dabur India
Neutral
279
-
49,033
9,370
10,265
17.1
17.2
7.3
8.1
38.1
34.5
11.5
9.3
33.7
30.6
5.1
4.7
GlaxoSmith Con*
Neutral
6,091
-
25,614
4,919
5,742
17.2
17.4
168.3
191.2
36.2
31.9
10.3
8.7
28.8
28.9
4.8
4.0
Godrej Consumer
Neutral
1,181
-
40,200
10,168
12,886
16.1
16.1
32.1
38.4
36.8
30.7
7.5
6.9
19.7
21.0
4.1
3.2
HUL
Neutral
791
-
171,215
34,940
38,957
17.5
17.7
20.8
24.7
38.0
32.0
42.3
33.8
110.5
114.2
4.7
4.2
ITC
Buy
314
409
252,176
41,068
45,068
37.8
37.4
13.9
15.9
22.6
19.8
7.6
6.7
34.1
33.8
5.8
5.2
Marico
Neutral
405
-
26,100
6,551
7,766
15.7
16.0
10.4
12.5
39.0
32.4
11.3
9.4
33.2
32.4
3.9
3.3
Nestle*
Accumulate
6,176
6,646
59,548
11,291
12,847
22.2
22.3
158.9
184.6
38.9
33.5
20.3
18.3
55.0
57.3
5.1
4.5
Tata Global
Buy
126
152
7,914
8,635
9,072
9.8
9.9
6.5
7.6
19.3
16.5
1.9
1.8
6.8
7.4
0.9
0.8
IT
HCL Tech^
Buy
944
1,132
132,739
42,038
47,503
23.5
23.5
56.4
62.9
16.7
15.0
3.9
3.0
23.2
19.8
2.8
2.2
Infosys
Buy
1,105
1,306
253,732
60,250
66,999
28.0
28.0
58.3
63.7
19.0
17.3
4.0
3.4
20.9
19.7
3.5
3.0
TCS
Buy
2,551
3,168
499,613
108,420
123,559
28.8
28.7
127.2
143.9
20.1
17.7
8.0
7.4
39.9
41.8
4.2
3.6
Tech Mahindra
Accumulate
562
646
54,085
25,566
28,890
16.0
17.0
26.3
31.9
21.4
17.6
3.8
3.3
17.9
18.6
1.9
1.6
Wipro
Buy
592
719
146,283
52,414
58,704
23.7
23.8
38.4
42.3
15.4
14.0
3.0
2.7
19.5
18.0
2.4
2.0
Media
D B Corp
Accumulate
320
356
5,873
2,241
2,495
27.8
27.9
21.8
25.6
14.7
12.5
3.8
3.4
26.7
28.5
2.6
2.3
HT Media
Neutral
82
-
1,913
2,495
2,603
11.2
11.2
7.3
8.6
11.3
9.6
0.9
0.8
7.4
8.1
0.3
0.3
Market Outlook
September 22, 2015
Stock Watch
Company Name
Reco
CMP
Target
Mkt Cap
Sales ( Čcr )
OPM(%)
EPS (Č)
PER(x)
P/BV(x)
RoE(%)
EV/Sales(x)
(Č)
Price ( Č)
( Č cr )
FY16E FY17E
FY16E
FY17E
FY16E
FY17E
FY16E
FY17E
FY16E
FY17E
FY16E
FY17E
FY16E
FY17E
Media
Jagran Prakashan
Accumulate
138
156
4,498
1,939
2,122
26.0
26.0
8.3
9.2
16.6
15.0
2.8
2.6
17.5
17.1
2.3
2.1
Sun TV Network
Neutral
356
-
14,012
2,779
3,196
70.2
70.5
22.8
27.3
15.6
13.0
3.8
3.5
26.7
28.3
4.8
4.1
Hindustan Media
Buy
224
292
1,643
920
1,031
20.0
20.0
19.2
20.9
11.7
10.7
1.9
1.6
16.4
15.3
1.3
1.2
Ventures
Metals & Mining
Coal India
Buy
342
400
216,241
72,015
78,415
21.2
21.5
21.7
25.3
15.8
13.6
5.4
5.3
33.1
39.1
2.2
2.1
Hind. Zinc
Neutral
135
-
57,169
15,258
16,495
44.2
45.6
17.6
19.2
7.7
7.1
1.2
1.1
15.9
15.3
1.4
1.0
Hindalco
Neutral
78
-
16,107
104,356
111,186
8.7
9.5
6.7
11.1
11.6
7.1
0.4
0.4
3.5
5.9
0.7
0.6
JSW Steel
Neutral
927
-
22,402
48,125
53,595
18.8
21.0
46.9
97.5
19.8
9.5
1.0
0.9
4.4
9.5
1.3
1.1
NMDC
Neutral
104
-
41,213
8,237
10,893
46.6
44.5
10.0
11.7
10.5
8.9
1.2
1.0
12.5
13.0
4.8
3.7
SAIL
Neutral
52
-
21,394
45,915
53,954
7.2
10.5
1.5
4.4
34.4
11.8
0.5
0.5
2.3
4.1
1.1
1.0
Vedanta
Neutral
98
-
29,173
71,445
81,910
26.2
26.3
12.9
19.2
7.6
5.1
0.5
0.5
7.2
8.9
0.9
0.7
Tata Steel
Neutral
227
-
22,032
136,805
149,228
11.3
11.9
26.4
36.8
8.6
6.2
0.7
0.6
6.0
8.0
0.7
0.6
Oil & Gas
Cairn India
Neutral
143
-
26,773
11,323
12,490
49.4
51.0
20.7
20.7
6.9
6.9
0.4
0.4
6.4
6.1
1.4
0.8
GAIL
Neutral
291
-
36,849
64,856
70,933
9.1
9.6
24.0
28.9
12.1
10.1
1.0
1.0
8.8
9.6
0.8
0.7
ONGC
Neutral
239
-
204,348
154,564
167,321
36.8
37.4
28.6
32.5
8.4
7.4
1.1
1.0
12.7
13.5
1.5
1.4
Petronet LNG
Buy
180
210
13,470
39,007
40,785
3.8
4.2
9.2
11.0
19.6
16.4
2.2
2.0
11.6
12.7
0.4
0.4
Indian Oil Corp
Buy
386
455
93,828
359,607
402,760
5.9
6.1
42.5
48.7
9.1
7.9
1.2
1.1
14.1
14.4
0.4
0.3
Reliance Industries
Accumulate
878
930
284,237
313,085
362,904
13.1
13.8
78.4
92.9
11.2
9.4
1.2
1.1
10.8
11.6
1.4
1.2
Pharmaceuticals
Alembic Pharma
Neutral
692
-
13,041
2,601
3,115
21.2
20.2
20.8
23.9
33.3
28.9
10.7
8.1
37.2
31.8
5.0
4.1
Aurobindo Pharma
Buy
712
872
41,570
14,923
17,162
23.0
23.0
38.2
43.6
18.6
16.3
5.7
4.3
36.0
30.2
3.1
2.7
Aventis*
Neutral
4,187
-
9,642
2,156
2,455
15.1
16.8
109.7
133.9
38.2
31.3
5.2
4.3
18.4
22.5
4.2
3.5
Cadila Healthcare
Neutral
1,993
-
40,801
10,224
11,840
20.0
21.0
71.0
85.6
28.1
23.3
7.5
5.9
30.1
28.5
4.1
3.4
Cipla
Neutral
650
-
52,182
14,359
16,884
21.3
19.7
28.4
30.5
22.9
21.3
4.1
3.5
19.3
17.5
3.6
3.0
Dr Reddy's
Accumulate
3,957
4,169
67,479
17,903
20,842
22.7
22.8
160.5
189.5
24.7
20.9
5.0
4.1
22.2
21.7
3.7
3.1
Dishman Pharma
Accumulate
264
290
2,127
1,716
1,888
20.2
20.2
16.3
21.6
16.2
12.2
1.5
1.4
9.7
11.7
1.4
1.2
GSK Pharma*
Neutral
3,347
-
28,353
2,870
3,158
20.0
22.1
59.5
68.3
56.3
49.0
16.6
17.1
28.5
34.3
9.4
8.6
Indoco Remedies
Neutral
327
-
3,011
1,088
1,262
18.2
18.2
13.1
15.5
24.9
21.1
4.9
4.1
21.2
21.1
2.8
2.4
Ipca labs
Accumulate
761
800
9,604
3,507
4,078
17.6
18.6
25.8
32.0
29.5
23.8
3.8
3.3
13.8
14.9
3.0
2.6
Lupin
Neutral
1,881
-
84,672
14,864
17,244
26.9
26.9
62.1
71.1
30.3
26.5
7.4
5.8
27.4
24.6
5.4
4.5
Sun Pharma
Accumulate
900
950
216,519
28,163
32,610
25.8
30.7
17.4
26.9
51.7
33.5
4.9
4.3
13.0
16.6
7.2
6.0
Market Outlook
September 22, 2015
Stock Watch
Company Name
Reco
CMP
Target
Mkt Cap
Sales ( Čcr )
OPM(%)
EPS (Č)
PER(x)
P/BV(x)
RoE(%)
EV/Sales(x)
(Č)
Price ( Č)
( Č cr )
FY16E FY17E
FY16E
FY17E
FY16E
FY17E
FY16E
FY17E
FY16E
FY17E
FY16E
FY17E
FY16E
FY17E
Power
Tata Power
Neutral
65
-
17,499
35,923
37,402
22.6
22.8
4.1
5.2
16.0
12.6
1.2
1.1
7.5
9.3
1.4
1.3
NTPC
Buy
127
157
104,388
87,064
98,846
23.5
23.5
11.7
13.2
10.8
9.6
1.2
1.1
11.4
12.1
2.2
2.0
Power Grid
Buy
137
170
71,490
20,702
23,361
86.7
86.4
12.1
13.2
11.3
10.4
1.7
1.5
15.6
15.1
8.4
7.8
Telecom
Bharti Airtel
Neutral
353
-
140,948
101,748
109,191
32.1
31.7
12.0
12.5
29.4
28.2
2.0
1.9
6.9
6.7
2.0
1.8
Idea Cellular
Neutral
146
-
52,461
34,282
36,941
32.0
31.5
5.9
6.2
24.7
23.5
2.3
2.1
9.9
9.3
2.1
2.0
zOthers
Abbott India
Neutral
5,763
-
12,246
2,715
3,153
14.5
14.1
134.3
152.2
42.9
37.9
10.7
8.8
27.4
25.6
4.2
3.6
Bajaj Electricals
Buy
251
341
2,530
4,719
5,287
5.2
5.8
8.6
12.7
29.3
19.8
3.3
2.9
11.4
14.8
0.5
0.5
Finolex Cables
Neutral
232
-
3,554
2,728
3,036
10.8
11.0
14.4
16.8
16.1
13.9
2.5
2.1
15.2
15.3
1.0
0.9
Goodyear India*
Buy
556
655
1,281
1,953
1,766
12.4
12.0
67.4
59.6
8.2
9.3
2.1
1.8
27.7
20.2
0.4
0.4
Hitachi
Neutral
1,331
-
3,618
1,806
2,112
9.0
9.2
28.6
29.1
46.5
45.8
11.6
9.3
28.1
22.6
2.1
1.8
Jyothy Laboratories
Neutral
311
-
5,626
1,620
1,847
11.5
11.5
7.3
8.5
42.6
36.7
5.5
5.1
13.3
14.4
3.3
2.8
MRF
Accumulate
41,419
43,575
17,566
20,727
14,841
19.3
18.6
4,905.8
3,351.9
8.4
12.4
2.7
2.2
37.6
19.6
0.8
1.1
Page Industries
Neutral
13,192
-
14,714
1,929
2,450
19.8
20.1
229.9
299.0
57.4
44.1
25.3
17.6
52.1
47.1
7.7
6.0
Relaxo Footwears
Neutral
527
-
6,328
1,767
2,152
12.3
12.5
19.3
25.1
27.4
21.0
6.7
5.2
27.7
27.8
3.6
3.0
Siyaram Silk Mills
Buy
994
1,221
931
1,653
1,873
11.7
12.2
99.3
122.1
10.0
8.1
1.8
1.5
19.5
20.2
0.7
0.6
Styrolution ABS India*
Neutral
757
-
1,331
1,271
1,440
8.6
9.2
32.0
41.1
23.6
18.4
2.4
2.2
10.7
12.4
1.0
0.9
Tree House
Buy
354
449
1,498
259
324
56.8
56.8
17.0
21.7
20.8
16.3
2.1
1.9
10.1
11.5
5.7
4.7
TVS Srichakra
Buy
2,729
3,210
2,090
2,127
2,388
15.2
14.9
237.7
267.5
11.5
10.2
4.9
3.5
51.7
39.8
1.0
0.9
HSIL
Buy
269
434
1,942
2,085
2,436
18.5
18.6
21.7
28.9
12.4
9.3
1.3
1.1
10.0
12.1
1.1
0.8
Kirloskar Engines India
Neutral
339
-
4,907
2,634
3,252
10.1
12.0
10.9
17.4
31.1
19.5
3.5
3.1
11.4
16.8
1.5
1.2
Ltd
M M Forgings
Buy
555
797
670
563
671
22.1
22.9
51.0
66.5
10.9
8.4
2.3
1.8
23.1
24.1
1.4
1.1
Banco Products (India)
Neutral
123
-
879
1,208
1,353
11.0
12.3
10.8
14.5
11.4
8.5
1.3
1.2
11.9
14.5
0.7
0.6
Competent Automobiles Neutral
147
-
90
1,007
1,114
3.1
3.1
23.7
28.2
6.2
5.2
0.9
0.8
13.9
14.6
0.1
0.1
Nilkamal
Accumulate
948
1,005
1,415
1,948
2,147
10.6
10.3
60.0
67.0
15.8
14.2
2.5
2.1
16.8
16.1
0.8
0.7
Visaka Industries
Buy
138
166
218
1,158
1,272
8.6
9.5
23.7
32.7
5.8
4.2
0.6
0.5
10.1
12.5
0.4
0.3
Transport Corporation of
Buy
243
293
1,850
2,830
3,350
8.8
9.0
14.4
18.3
16.9
13.3
2.6
2.3
15.4
17.1
0.8
0.7
India
Elecon Engineering
Buy
72
87
785
1,452
1,596
14.0
14.7
4.4
6.2
16.3
11.6
1.4
1.2
8.6
11.2
0.8
0.7
Surya Roshni
Buy
127
183
555
2,992
3,223
8.3
8.5
14.7
18.3
8.6
6.9
0.8
0.7
9.8
11.0
0.5
0.4
MT Educare
Buy
132
169
524
286
366
18.3
17.7
7.7
9.4
17.0
14.1
3.6
3.1
20.2
21.1
1.7
1.3
Market Outlook
September 22, 2015
Stock Watch
Company Name
Reco
CMP
Target Mkt Cap
Sales ( Čcr )
OPM(%)
EPS (Č)
PER(x)
P/BV(x)
RoE(%)
EV/Sales(x)
(Č)
Price ( Č)
( Č cr )
FY16E FY17E FY16E FY17E FY16E FY17E FY16E FY17E FY16E FY17E FY16E FY17E FY16E FY17E
zOthers
Radico Khaitan
Buy
86
112
1,143
1,565
1,687
11.9
12.4
5.4
6.6
15.9
13.0
1.3
1.2
8.0
9.0
1.2
1.2
Garware Wall Ropes
Buy
312
390
683
875
983
10.4
10.6
23.1
27.8
13.5
11.2
1.9
1.7
14.1
14.8
0.8
0.7
Wonderla Holidays
Buy
276
322
1,562
206
308
44.0
43.6
9.0
12.9
30.7
21.4
4.2
3.8
13.7
17.8
7.5
5.0
Linc Pen & Plastics
Buy
155
185
230
340
371
8.3
8.9
10.8
13.2
14.4
11.8
2.3
2.0
16.0
17.1
0.7
0.6
The Byke Hospitality
Accumulate
165
181
662
222
287
20.5
20.5
5.6
7.6
29.3
21.9
5.5
4.5
18.9
20.8
3.0
2.3
Source: Company, Angel Research; Note: *December year end; #September year end; &October year end; Price as on September 21, 2015
Market Outlook
September 22, 2015
Research Team Tel: 022 - 39357800
DISCLAIMER
Angel Broking Private Limited (hereinafter referred to as “Angel”) is a registered Member of National Stock Exchange of India Limited,
Bombay Stock Exchange Limited and MCX Stock Exchange Limited. It is also registered as a Depository Participant with CDSL and
Portfolio Manager with SEBI. It also has registration with AMFI as a Mutual Fund Distributor. Angel Broking Private Limited is a registered
entity with SEBI for Research Analyst in terms of SEBI (Research Analyst) Regulations, 2014 vide registration number INH000000164.
Angel or its associates has not been debarred/ suspended by SEBI or any other regulatory authority for accessing /dealing in securities
Market. Angel or its associates including its relatives/analyst do not hold any financial interest/beneficial ownership of more than 1% in
the company covered by Analyst. Angel or its associates/analyst has not received any compensation / managed or co-managed public
offering of securities of the company covered by Analyst during the past twelve months. Angel/analyst has not served as an officer,
director or employee of company covered by Analyst and has not been engaged in market making activity of the company covered by
Analyst.
This document is solely for the personal information of the recipient, and must not be singularly used as the basis of any investment
decision. Nothing in this document should be construed as investment or financial advice. Each recipient of this document should make
such investigations as they deem necessary to arrive at an independent evaluation of an investment in the securities of the companies
referred to in this document (including the merits and risks involved), and should consult their own advisors to determine the merits and
risks of such an investment.
Reports based on technical and derivative analysis center on studying charts of a stock's price movement, outstanding positions and
trading volume, as opposed to focusing on a company's fundamentals and, as such, may not match with a report on a company's
fundamentals.
The information in this document has been printed on the basis of publicly available information, internal data and other reliable sources
believed to be true, but we do not represent that it is accurate or complete and it should not be relied on as such, as this document is for
general guidance only. Angel Broking Pvt. Limited or any of its affiliates/ group companies shall not be in any way responsible for any
loss or damage that may arise to any person from any inadvertent error in the information contained in this report. Angel Broking Pvt.
Limited has not independently verified all the information contained within this document. Accordingly, we cannot testify, nor make any
representation or warranty, express or implied, to the accuracy, contents or data contained within this document. While Angel Broking
Pvt. Limited endeavors to update on a reasonable basis the information discussed in this material, there may be regulatory, compliance,
or other reasons that prevent us from doing so.
This document is being supplied to you solely for your information, and its contents, information or data may not be reproduced,
redistributed or passed on, directly or indirectly.
Neither Angel Broking Pvt. Limited, nor its directors, employees or affiliates shall be liable for any loss or damage that may arise from or
in connection with the use of this information.
Note: Please refer to the important ‘Stock Holding Disclosure' report on the Angel website (Research Section). Also, please refer to the
latest update on respective stocks for the disclosure status in respect of those stocks. Angel Broking Pvt. Limited and its affiliates may have
investment positions in the stocks recommended in this report.