Market Outlook
March 22, 2016
Market Cues
Domestic Indices
Chg (%)
(Pts)
(Close)
Indian market is expected to open on a flat to positive note tracking the SGX Nifty.
BSE Sensex
1.3
333
25,285
Nifty
1.3
100
7,704
US indices ended modestly higher after a choppy session throughout the day as
traders expressed uncertainty about the near-term outlook for the markets on the
Mid Cap
1.4
144
10,444
heels of the recent strength. The upcoming Easter holiday also contributed the
Small Cap
1.4
140
10,448
lackluster performance, with some traders away from their desks ahead of the long
Bankex
1.7
304
18,155
weekend.
The European markets ended the session in red since weak commodity prices
Global Indices
Chg (%)
(Pts)
(Close)
contributed to the struggles of the European markets. Energy and mining stocks were
Dow Jones
0.1
22
17,624
under pressure throughout the session. After being higher earlier in the session,
Nasdaq
0.3
13
4,809
most bank stocks also ended in the red.
FTSE
(0.1)
(5)
6,185
Indian shares ended firmly in positive territory after the government slashed interest
Nikkei
(1.2)
(212)
16,725
rates on Centrally-sponsored savings schemes, giving banks greater flexibility to
Hang Seng
0.1
13
20,684
lower deposit rates and fully pass on the previous rate cuts to borrowers. Also, with
the government adhering to its fiscal deficit targets and inflation at a four-month low
Shanghai Com
2.2
64
3,019
in February, it is expected that the Reserve Bank of India (RBI) will cut rates by as
much as 50 basis points in its monetary policy review due on April 5.
Advances / Declines
BSE
NSE
Advances
1,497
989
News & Result Analysis
Declines
1,196
595
M&M aims for $1bn in annual revenue from powertrain business
Unchanged
171
86
Govt prepares bailout for steel sector
Detailed analysis on Pg2
Volumes (` Cr)
Investor’s Ready Reckoner
BSE
2,930
Key Domestic & Global Indicators
NSE
16,247
Stock Watch: Latest investment recommendations on 150+ stocks
Refer Pg4 onwards
Net Inflows (` Cr)
Net
Mtd
Ytd
Top Picks
FII
1,888
14,760
(23,407)
CMP
Target
Upside
Company
Sector
Rating
MFs
(335)
(4,125)
70,694
(`)
(`)
(%)
Amara Raja Batteries Auto & Auto Ancillary Accumulate
906
1,040
14.8
Top Gainers
Price (`)
Chg (%)
HCL Tech
IT
Buy
823
1,038
26.2
LIC Housing Finance Financials
Buy
470
592
25.8
Persistent
740
10.5
Bharat Electronics
Capital Goods
Buy
1,177
1,414
20.1
Prestige
153
9.9
Navkar Corporation Others
Buy
162
265
63.4
Bluedart
6,034
9.9
More Top Picks on Pg3
Jubilant
442
9.1
Ttkprestig
4,573
8.9
Key Upcoming Events
Previous
Consensus
Date
Region
Event Description
Reading
Expectations
Top Losers
Price (`)
Chg (%)
Mar 25 US
GDP Qoq (Annualized) - % Change
1.00
1.00
Mphasis
456
(7.0)
Apr 1 China
PMI Manufacturing
49.00
---
Vakrangee
205
(4.4)
Apr 5 India
RBI Repo Rate
6.75%
---
Aloktext
5
(4.3)
Apr 8 India
Imports YoY%
(5.00)
---
More on Pg4
Sunasian
28
(1.9)
6.(
Alstomt&D
378
(1.8)
As on March 21, 2016
Market Outlook
March 22, 2016
M&M aims for $1bn in annual revenue from powertrain business
Powertrain division of Mahindra Group today launched a new range of 125kVA
diesel generators and is eyeing to touch $1bn in revenues over the next six years.
Mahindra Powerol, which is a part of the Powertrain division, launched the 125
kVA DG sets priced at `7.24 lakh that includes the cashless service charges of
`1.25 lakh, which the company launched as a part of its five-year super-shield
plan for this product.
At the same time, the company will also continue to introduce higher capacity
engines that will cater to industries like the marine, construction equipment,
cranes, forklifts, tractors, among others, adding the Euro 6 emission norms will
enable the demand for its engines to rise significantly.
With the introduction of new-range of products that will not only cater to the
domestic market but also the international markets the company is confident of
achieving nearly 40% of revenues from exports. Currently, the powertrain division
contributes $200mn in revenues and the company is confident of achieving $1bn
target in the next six years. We maintain our Accumulate rating on the stock.
Govt prepares bailout for steel sector
The government is readying a financial package to help revive the steel sector and
also prevent bank loans advanced to steel firms from turning bad. The steel and
finance ministries are working on a package for the steel sector that will be
finalized in the next two months.
There are a broad range of proposals that include banks taking certain equity as
redeemable preference shares and then giving the companies enough time to
redeem them. There are other proposals, where the government is looking at
bringing in financial investors who can hold some of these stakes for a period of
time, and then when the company comes back to health, they can disinvest.
The government is also looking at bringing in certain external or international
investors who can pump in fresh equity into these companies. There has been a
fair degree of interest from international investors.
The government’s move comes after similar efforts in the roads and power sectors.
And it comes even as the banking system faces considerable stress from non-
performing assets.
Economic and Political News
Indian economy to grow 7.7% in 2016-17: ICRA
Govt may permit 100% FDI in 25 more segments of NBFCs
Delhi HC extends stay on drug ban till March 28
Corporate News
SBI leads mobile banking chart with over 38% market share
FIPB turns down Apollo Hospitals' fund raising proposal
VA Tech Wabag records highest order intake in FY16
Market Outlook
March 22, 2016
Top Picks
Large Cap
Market Cap
CMP
Target
Upside
Company
Rationale
(` Cr)
(`)
(`)
(%)
To outpace battery industry growth due to better technological
Amara Raja Batteries
15,475
906
1,040
14.8
products leading to market share gains in both the automotive
OEM and replacement segments.
Earnings to grow strongly given the MHCV cyclical upturn.
Ashok Leyland
29,270
103
111
7.9
Focus on exports and LCV's provides additional growth
avenue.
Uptick in defense capex by government when coupled with
Bharat Electronics
28,249
1,177
1,414
20.1
BELs strong market positioning, indicate that good times are
ahead for BEL.
The stock is trading at attractive valuations and is factoring all
HCL Tech
1,16,018
823
1,038
26.2
the bad news.
Strong visibility for a robust 20% earnings trajectory, coupled
HDFC Bank
2,63,945
1,044
1,262
20.9
with high quality of earnings on account of high quality retail
business and strategic focus on highly rated corporates.
Back on the growth trend, expect a long term growth of 14%
Infosys
2,75,381
1,195
1,347
12.7
to be a US$20bn in FY2020.
LICHF continues to grow its retail loan book at a healthy pace
with improvement in asset quality. We expect the company to
LIC Housing Finance
23,734
470
592
25.8
post a healthy loan book which is likely to reflect in a strong
earnings growth.
Huge bid pipeline of re-development works at Delhi and other
NBCC
11,416
951
1,089
14.5
State Governments and opportunity from Smart City, positions
NBCC to report strong growth, going forward.
New launches to enable outpace industry growth; margins
TVS Motors
14,495
305
330
8.2
expansion to boost earnings.
Source: Company, Angel Research
Mid Cap
Market Cap
CMP
Target
Upside
Company
Rationale
(` Cr)
(`)
(`)
(%)
Favorable outlook for the AC industry to augur well for
Cooling products business which is out pacing the market
Blue Star
3,375
375
439
17.0
growth. EMPPAC division's profitability to improve once
operating environment turns around.
Commencement of new projects, downtrend in the interest rate
IL&FS Transport
2,421
74
93
26.4
cycle, to lead to stock re-rating
Economic recovery to have favourable impact on advertising &
circulation revenue growth. Further, the acquisition of a radio
Jagran Prakashan
4,882
149
189
26.5
business (Radio City) would also boost the company's revenue
growth.
Speedier execution and speedier sales, strong revenue visibilty
Mahindra Lifespace
1,735
423
554
31.0
in short-to-long run, attractive valuations
Massive capacity expansion along with rail advantage at ICD
Navkar Corporation
2,312
162
265
63.4
as well CFS augurs well for the company
Earnings boost on back of stable material prices and
Radico Khaitan
1,322
99
156
56.9
favourable pricing environment. Valuation discount to peers
provides additional comfort
Strong brands and distribution network would boost growth
Siyaram Silk Mills
912
973
1,354
39.2
going ahead. Stock currently trades at an inexpensive
valuation.
Source: Company, Angel Research
Market Outlook
March 22, 2016
Key Upcoming Events
Global economic events release calendar
Date
Time
Country
Event Description
Unit
Period
Bloomberg Data
Last Reported Estimated
Mar 22, 2016 3:00PM
UK
CPI (YoY)
% Change
Feb
0.30
0.40
2:00PM
Germany
PMI Manufacturing
Value
Mar P
50.50
50.80
2:00PM
Germany
PMI Services
Value
Mar P
55.30
55.00
Mar 23, 2016 8:30PM
Euro Zone
Euro-Zone Consumer Confidence
Value
Mar A
(8.80)
(8.30)
7:30PM
US
New home sales
Thousands
Feb
494.00
510.00
Mar 24, 2016 6:00PM
US
Initial Jobless claims
Thousands
Mar 19
265.00
268.00
Mar 25, 2016 6:00PM
US
GDP Qoq (Annualised)
% Change
4Q T
1.00
1.00
Mar 29, 2016 7:30PM
US
Consumer Confidence
S.A./ 1985=100
Mar
92.20
94.00
Mar 31, 2016 1:25PM
Germany
Unemployment change (000's)
Thousands
Mar
(10.00)
--
2:00PM
UK
GDP (YoY)
% Change
4Q F
1.90
--
Apr 1, 2016
2:00PM
UK
PMI Manufacturing
Value
Mar
50.80
--
6:30AM
China
PMI Manufacturing
Value
Mar
49.00
49.50
6:00PM
US
Change in Nonfarm payrolls
Thousands
Mar
242.00
200.00
6:00PM
US
Unnemployment rate
%
Mar
4.90
4.90
Apr 5, 2016
11:00AM
India
RBI Reverse Repo rate
%
Apr 5
5.75
--
11:00AM
India
RBI Repo rate
%
Apr 5
6.75
--
11:00AM
India
RBI Cash Reserve ratio
%
Apr 5
4.00
--
Apr 8, 2016
India
Imports YoY%
% Change
Mar
(5.00)
--
India
Exports YoY%
% Change
Mar
(5.66)
--
2:00PM
UK
Industrial Production (YoY)
% Change
Feb
0.20
--
Apr 11, 2016
7:00AM
China
Consumer Price Index (YoY)
% Change
Mar
2.30
--
Apr 12, 2016
5:30PM
India
Industrial Production YoY
% Change
Feb
(1.50)
--
Apr 13, 2016
US
Producer Price Index (mom)
% Change
Mar
(0.60)
--
China
Exports YoY%
% Change
Mar
(25.40)
--
Apr 14, 2016 12:00PM
India
Monthly Wholesale Prices YoY%
% Change
Mar
(0.91)
--
6:00PM
US
Consumer price index (mom)
% Change
Mar
(0.20)
--
2:30PM
Euro Zone
Euro-Zone CPI (YoY)
%
Mar F
(0.20)
--
4:30PM
UK
BOE Announces rates
% Ratio
Apr 14
0.50
0.50
Apr 15, 2016
6:45PM
US
Industrial Production
%
Mar
(0.49)
--
7:30AM
China
Industrial Production (YoY)
% Change
Mar
5.90
--
7:30AM
China
Real GDP (YoY)
% Change
1Q
6.80
--
Apr 19, 2016
6:00PM
US
Housing Starts
Thousands
Mar
1,178.00
--
6:00PM
US
Building permits
Thousands
Mar
1,167.00
--
Apr 20, 2016
2:00PM
UK
Jobless claims change
% Change
Mar
(18.00)
--
Apr 21, 2016
5:15PM
Euro Zone
ECB announces interest rates
%
Apr 21
--
--
Source: Bloomberg, Angel Research
Market Outlook
March 22, 2016
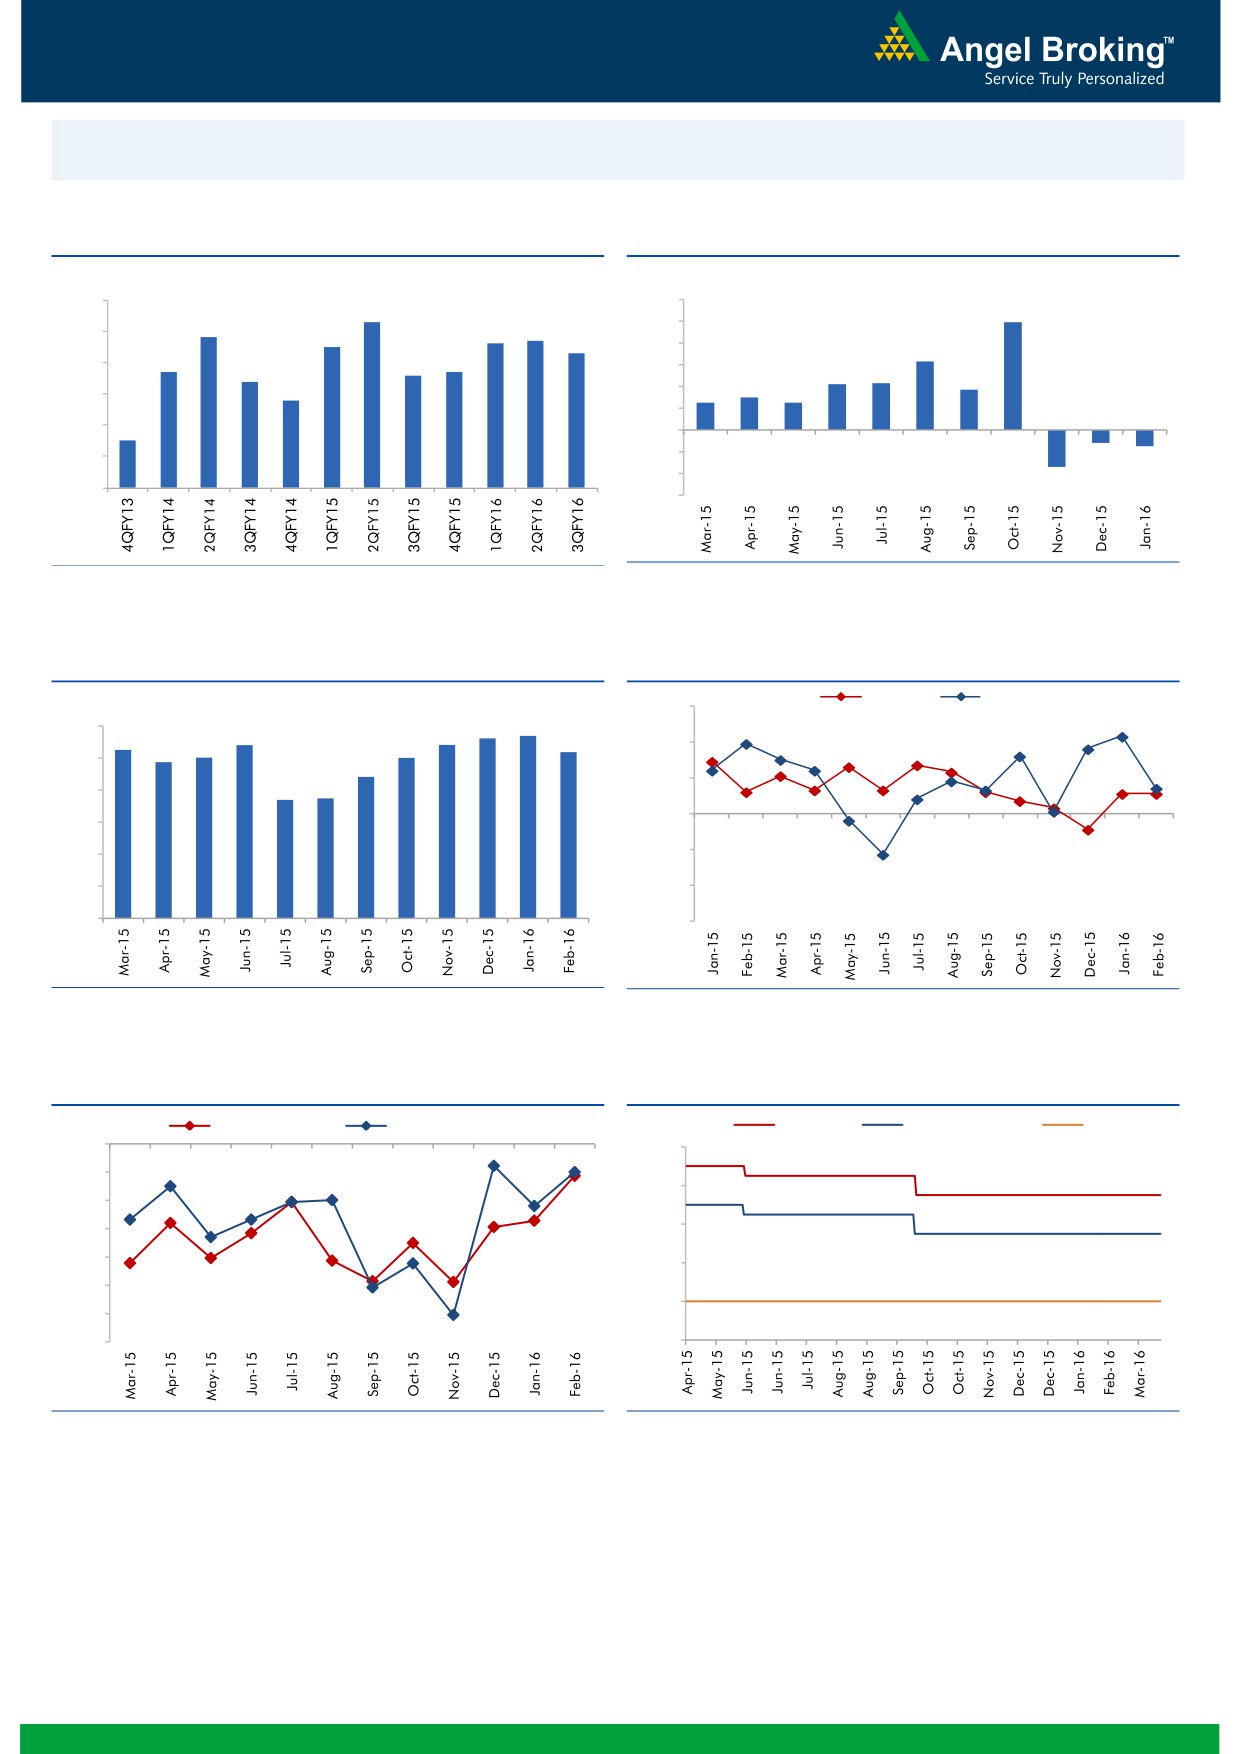
Macro watch
Exhibit 1: Quarterly GDP trends
Exhibit 2: IIP trends
(%)
(%)
9.0
12.0
8.3
9.9
7.8
7.7
10.0
8.0
7.5
7.6
7.3
8.0
6.3
6.7
6.6
6.7
7.0
6.4
6.0
4.2
4.3
3.7
5.8
4.0
2.5
3.0
2.5
6.0
2.0
5.0
4.5
-
4.0
(2.0)
(1.2)
(1.5)
(4.0)
3.0
(3.4)
(6.0)
Source: CSO, Angel Research
Source: MOSPI, Angel Research
Exhibit 3: Monthly CPI inflation trends
Exhibit 4: Manufacturing and services PMI
Mfg. PMI
Services PMI
(%)
56.0
5.6
5.7
6.0
5.4
5.4
5.3
5.2
4.9
5.0
5.0
54.0
5.0
4.4
3.7
3.7
52.0
4.0
50.0
3.0
2.0
48.0
1.0
46.0
-
44.0
Source: MOSPI, Angel Research
Source: Market, Angel Research; Note: Level above 50 indicates expansion
Exhibit 5: Exports and imports growth trends
Exhibit 6: Key policy rates
(%)
Exports yoy growth
Imports yoy growth
(%)
Repo rate
Reverse Repo rate
CRR
0.0
8.00
(5.0)
7.00
(10.0)
6.00
(15.0)
(20.0)
5.00
(25.0)
4.00
(30.0)
(35.0)
3.00
Source: Bloomberg, Angel Research
Source: RBI, Angel Research
Market Outlook
March 22, 2016
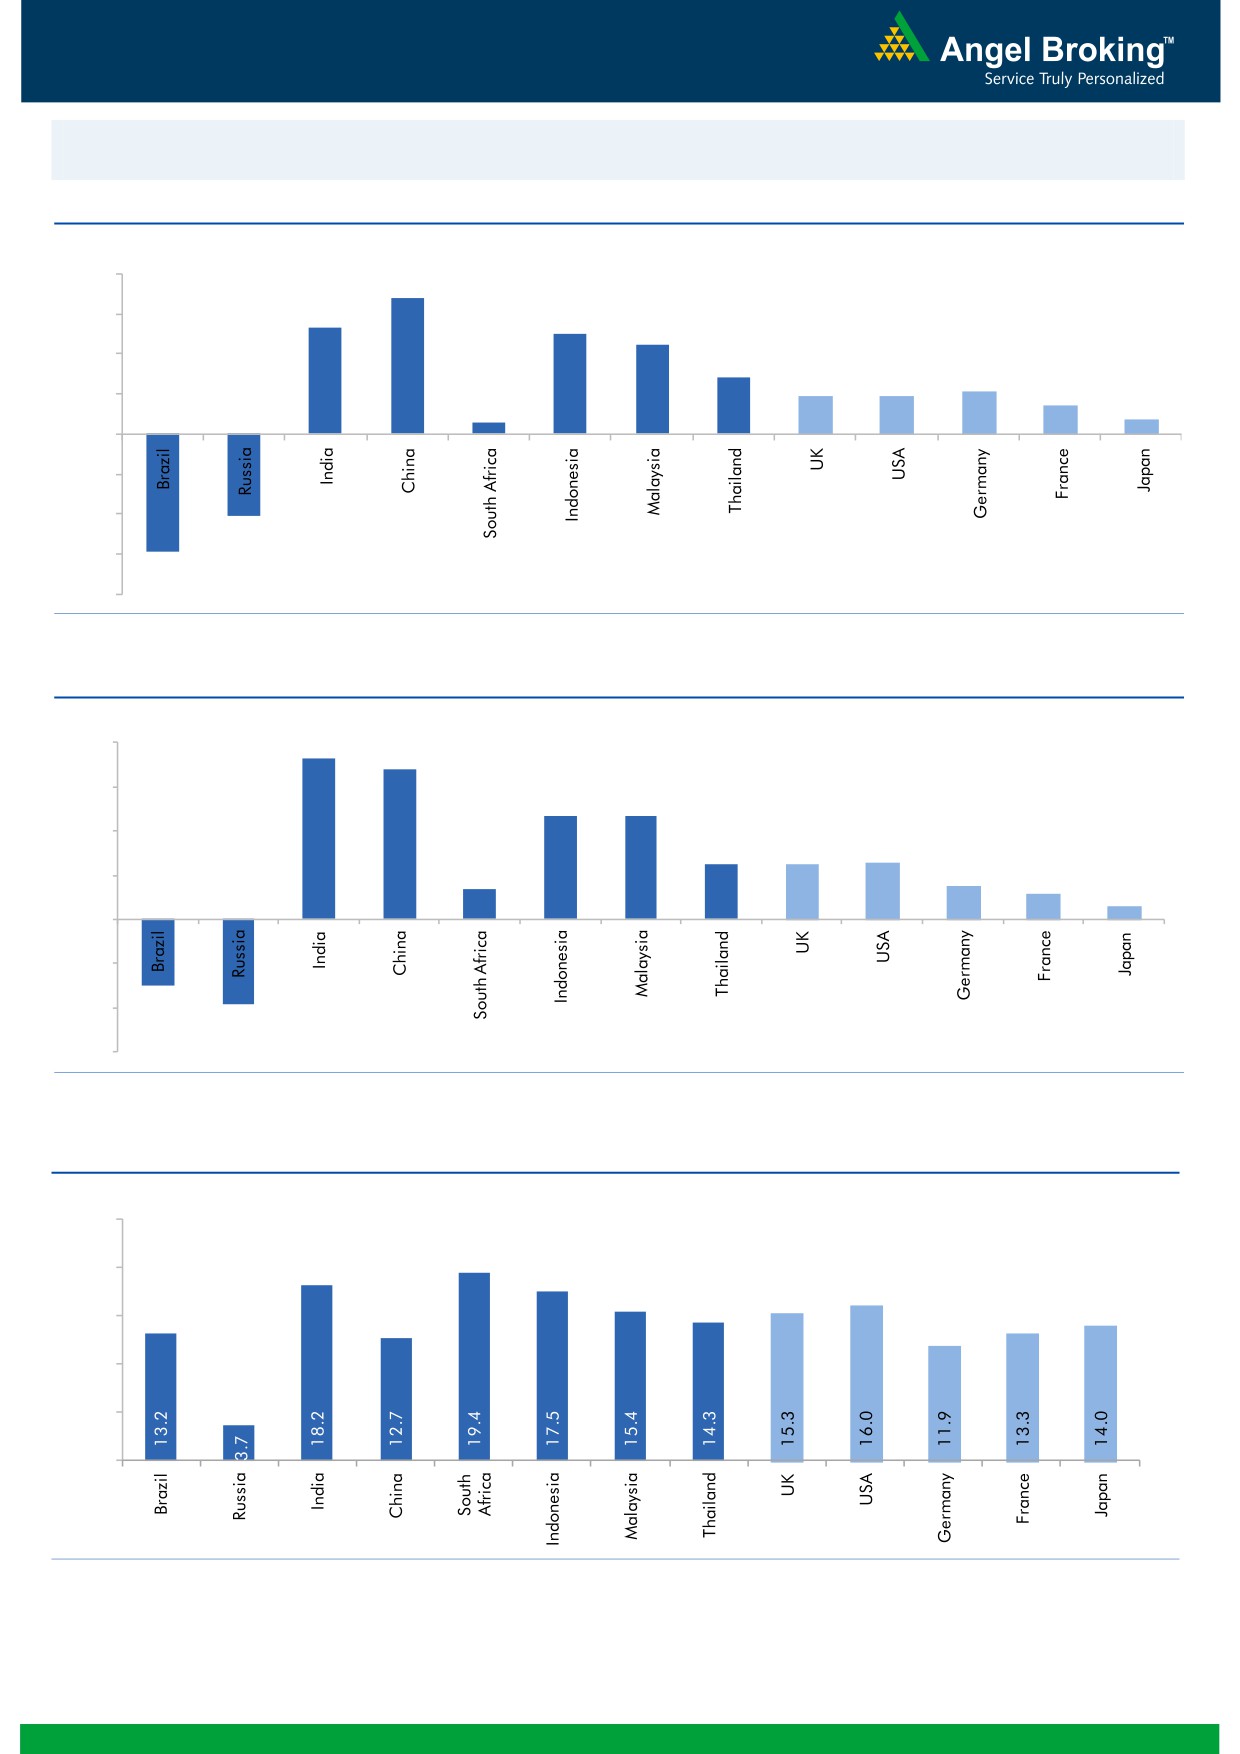
Global watch
Exhibit 1: Latest quarterly GDP Growth (%, yoy) across select developing and developed countries
(%)
8.0
6.8
6.0
5.3
5.0
4.5
4.0
2.8
1.9
1.9
2.1
1.4
2.0
0.6
0.7
-
(2.0)
(4.0)
(4.1)
(6.0)
(5.9)
(8.0)
Source: Bloomberg, Angel Research
Exhibit 2: 2015 GDP Growth projection by IMF (%, yoy) across select developing and developed countries
(%)
8.0
7.3
6.8
6.0
4.7
4.7
4.0
2.5
2.5
2.6
1.4
1.5
2.0
1.2
0.6
-
(2.0)
(3.0)
(4.0)
(3.8)
(6.0)
Source: IMF, Angel Research
Exhibit 3: One year forward P-E ratio across select developing and developed countries
(x)
25.0
20.0
15.0
10.0
5.0
-
Source: IMF, Angel Research
Market Outlook
March 22, 2016
Exhibit 4: Relative performance of indices across globe
Returns (%)
Country
Name of index
Closing price
1M
3M
1YR
Brazil
Bovespa
51,172
23.4
13.1
4.7
Russia
Micex
1,905
8.6
11.5
18.4
India
Nifty
7,704
8.4
(1.8)
(11.7)
China
Shanghai Composite
3,019
5.2
(14.3)
(10.8)
South Africa
Top 40
47,812
7.2
6.4
2.4
Mexico
Mexbol
45,482
4.4
4.7
3.4
Indonesia
LQ45
853
1.3
12.4
(9.7)
Malaysia
KLCI
1,718
2.3
4.8
(3.6)
Thailand
SET 50
899
10.3
7.4
(11.5)
USA
Dow Jones
17,624
7.4
(0.7)
(2.7)
UK
FTSE
6,185
3.6
1.3
(11.9)
Japan
Nikkei
16,725
5.6
(11.4)
(10.7)
Germany
DAX
9,949
5.1
(5.0)
(17.1)
France
CAC
4,428
4.4
(4.3)
(12.0)
Source: Bloomberg, Angel Research
Stock Watch
March 22, 2016
Company Name
Reco
CMP
Target
Mkt Cap
Sales ( Čcr )
OPM(%)
EPS (Č)
PER(x)
P/BV(x)
RoE(%)
EV/Sales(x)
(Č)
Price ( Č)
( Č cr )
FY16E FY17E
FY16E
FY17E
FY16E
FY17E
FY16E
FY17E
FY16E
FY17E
FY16E
FY17E
FY16E
FY17E
Agri / Agri Chemical
Rallis
Neutral
173
-
3,370
2,097
2,415
14.4
14.4
9.5
11.0
18.2
15.8
3.6
3.1
21.1
21.3
1.6
1.4
United Phosphorus
Accumulate
446
480
19,103
12,500
14,375
18.3
18.3
29.8
35.9
15.0
12.4
2.8
2.3
20.0
20.3
1.6
1.3
Auto & Auto Ancillary
Ashok Leyland
Accumulate
103
111
29,270
17,995
21,544
11.4
11.6
3.4
4.7
30.3
21.9
5.3
4.9
17.7
22.2
1.6
1.3
Bajaj Auto
Accumulate
2,312
2,585
66,896
22,709
25,860
20.9
20.1
129.0
143.6
17.9
16.1
5.5
4.7
30.7
29.4
2.5
2.2
Bharat Forge
Neutral
875
-
20,364
7,351
8,318
19.9
19.7
31.2
36.5
28.0
24.0
5.0
4.2
19.3
19.2
2.9
2.5
Eicher Motors
Accumulate
18,356
20,044
49,858
15,556
16,747
15.5
17.3
464.8
597.5
39.5
30.7
14.4
10.6
36.2
34.3
3.1
2.9
Gabriel India
Buy
84
101
1,213
1,415
1,544
8.7
9.0
4.6
5.4
18.4
15.6
3.3
3.0
18.1
18.9
0.8
0.7
Hero Motocorp
Neutral
2,803
-
55,967
28,244
30,532
15.5
15.9
156.7
168.5
17.9
16.6
7.1
6.1
39.9
36.4
1.8
1.7
Jamna Auto Industries Buy
135
160
1,076
1,281
1,473
11.2
11.5
7.6
9.2
17.7
14.6
4.5
3.7
25.4
25.2
0.9
0.8
L G Balakrishnan & Bros Neutral
437
-
685
1,254
1,394
11.6
11.8
35.9
41.7
12.2
10.5
1.7
1.5
13.5
13.8
0.7
0.6
Mahindra and Mahindra Accumulate
1,228
1,364
76,239
38,416
42,904
13.7
13.9
54.8
63.4
22.4
19.4
3.5
3.1
15.4
15.8
1.6
1.4
Maruti
Neutral
3,670
-
110,866
57,865
68,104
16.4
16.7
176.3
225.5
20.8
16.3
4.0
3.4
19.4
21.2
1.7
1.4
Minda Industries
Accumulate
926
1,047
1,470
2,523
2,890
8.7
9.0
55.0
65.4
16.8
14.2
3.3
2.6
19.3
18.7
0.7
0.6
Motherson Sumi
Buy
254
313
33,551
39,343
45,100
8.8
9.1
10.1
12.5
25.1
20.3
8.0
6.2
35.3
34.4
0.9
0.8
Rane Brake Lining
Buy
365
465
289
454
511
11.5
12.0
25.2
31.0
14.5
11.8
2.2
2.0
14.9
16.6
0.8
0.7
Setco Automotive
Neutral
30
-
406
594
741
12.7
13.7
1.7
3.2
17.9
9.5
1.9
1.6
10.4
16.9
1.1
0.9
Tata Motors
Neutral
375
-
108,140
259,686
273,957
13.0
13.4
25.9
29.5
14.5
12.7
1.9
1.7
8.0
9.0
0.6
0.6
TVS Motor
Accumulate
305
330
14,495
11,263
13,122
6.9
8.5
9.2
15.0
33.2
20.3
7.6
6.0
22.7
29.6
1.3
1.1
Amara Raja Batteries
Accumulate
906
1,040
15,475
4,892
5,871
17.4
17.6
28.8
37.1
31.5
24.4
7.3
5.9
23.4
24.1
3.1
2.5
Exide Industries
Buy
136
162
11,556
6,950
7,784
14.4
14.8
6.6
7.3
20.6
18.6
2.6
2.4
12.6
12.8
1.4
1.2
Apollo Tyres
Neutral
178
-
9,068
12,056
12,714
17.2
16.4
23.0
20.3
7.8
8.8
1.4
1.2
17.7
13.6
0.8
0.8
Ceat
Neutral
1,126
-
4,554
6,041
6,597
14.1
13.7
99.5
111.9
11.3
10.1
2.2
1.9
19.6
18.5
0.9
0.8
JK Tyres
Neutral
83
-
1,889
7,446
7,669
15.2
14.0
19.6
18.4
4.3
4.5
1.1
0.9
25.2
19.5
0.7
0.6
Swaraj Engines
Accumulate
861
919
1,070
552
630
14.2
14.7
44.6
54.1
19.3
15.9
4.5
4.1
23.2
25.6
1.8
1.5
Subros
Neutral
86
-
518
1,293
1,527
11.8
11.9
4.2
6.7
20.6
12.9
1.6
1.4
7.7
11.5
0.7
0.6
Indag Rubber
Neutral
163
-
427
283
329
17.0
17.2
13.0
15.4
12.6
10.6
2.7
2.3
21.8
21.6
1.2
1.0
Capital Goods
ACE
Neutral
37
-
362
660
839
4.7
8.2
1.0
3.9
36.6
9.4
1.1
1.0
3.2
11.3
0.7
0.6
BEML
Accumulate
1,068
1,157
4,449
3,277
4,006
6.0
8.9
36.2
64.3
29.5
16.6
2.0
1.9
5.7
11.7
1.4
1.1
Bharat Electronics
Buy
1,177
1,414
28,249
7,737
8,634
16.8
17.2
54.0
61.5
21.8
19.1
3.1
2.8
39.3
45.6
2.8
2.4
Stock Watch
March 22, 2016
Company Name
Reco
CMP
Target
Mkt Cap
Sales ( Čcr )
OPM(%)
EPS (Č)
PER(x)
P/BV(x)
RoE(%)
EV/Sales(x)
(Č)
Price ( Č)
( Č cr )
FY16E
FY17E
FY16E
FY17E
FY16E
FY17E
FY16E
FY17E
FY16E
FY17E
FY16E
FY17E
FY16E
FY17E
Capital Goods
Voltas
Buy
275
353
9,089
5,363
5,963
8.0
9.1
11.0
13.8
25.0
19.9
3.8
3.4
16.2
17.9
1.6
1.5
BGR Energy
Neutral
102
-
738
3,615
3,181
9.5
9.4
16.7
12.4
6.1
8.3
0.6
0.6
10.0
7.0
0.6
0.8
BHEL
Neutral
112
-
27,401
33,722
35,272
10.8
11.7
10.5
14.2
10.7
7.9
0.8
0.7
7.0
9.0
0.9
0.9
Blue Star
Buy
375
439
3,375
3,548
3,977
6.3
6.9
13.7
17.2
27.4
21.9
6.9
4.5
26.1
25.4
1.0
0.9
Crompton Greaves
Neutral
48
-
2,983
13,484
14,687
4.9
6.2
4.5
7.1
10.6
6.7
0.8
0.7
7.2
10.8
0.4
0.3
Greaves Cotton
Neutral
123
-
3,015
1,655
1,755
16.6
16.8
7.4
7.8
16.7
15.8
3.3
3.2
21.1
20.6
1.8
1.7
Inox Wind
Buy
271
458
6,023
4,980
5,943
17.0
17.5
26.6
31.6
10.2
8.6
3.1
2.2
35.0
30.0
1.4
1.1
KEC International
Neutral
121
-
3,112
8,791
9,716
6.1
6.8
5.4
8.2
22.4
14.8
2.2
2.1
10.0
14.0
0.6
0.5
Thermax
Neutral
774
-
9,220
6,413
7,525
7.4
8.5
30.5
39.3
25.4
19.7
3.9
3.4
15.0
17.0
1.4
1.2
VATech Wabag
Neutral
532
-
2,902
2,722
3,336
7.9
8.1
19.5
24.6
27.3
21.6
2.9
2.5
11.1
12.4
1.1
0.9
Cement
ACC
Neutral
1,375
-
25,816
13,151
14,757
16.4
18.3
63.9
83.4
21.5
16.5
2.8
2.5
13.3
16.1
1.8
1.5
Ambuja Cements
Neutral
232
-
36,012
11,564
12,556
19.4
20.7
8.9
10.1
26.1
23.0
3.3
3.1
12.8
13.8
2.8
2.5
HeidelbergCement
Neutral
80
-
1,814
1,772
1,926
13.3
15.4
1.0
3.0
80.1
26.7
2.0
1.9
2.6
7.9
1.6
1.4
India Cements
Neutral
85
-
2,602
4,216
4,840
18.0
19.5
4.0
9.9
21.2
8.6
0.8
0.8
4.0
9.5
0.9
0.8
JK Cement
Neutral
628
-
4,390
3,661
4,742
10.1
15.8
7.5
28.5
83.7
22.0
2.5
2.2
7.5
22.9
1.7
1.3
J K Lakshmi Cement
Neutral
338
-
3,975
2,947
3,616
16.7
19.9
11.5
27.2
29.4
12.4
2.8
2.4
9.8
20.8
1.8
1.4
Mangalam Cements
Neutral
226
-
603
1,053
1,347
10.5
13.3
8.4
26.0
26.9
8.7
1.1
1.1
4.3
12.5
1.0
0.7
Orient Cement
Neutral
151
-
3,096
1,854
2,524
21.2
22.2
7.7
11.1
19.6
13.6
2.8
2.4
13.3
15.7
2.4
1.7
Ramco Cements
Neutral
422
-
10,037
4,036
4,545
20.8
21.3
15.1
18.8
27.9
22.4
3.4
3.0
12.9
14.3
3.0
2.6
Shree Cement^
Neutral
12,595
-
43,877
7,150
8,742
26.7
28.6
228.0
345.5
55.2
36.5
8.1
6.8
15.7
20.3
5.9
4.7
UltraTech Cement
Neutral
3,222
-
88,411
24,669
29,265
18.2
20.6
82.0
120.0
39.3
26.9
4.2
3.7
11.3
14.7
3.6
3.1
Construction
ITNL
Buy
74
93
2,421
7,360
8,825
34.0
35.9
7.0
9.0
10.5
8.2
0.4
0.3
3.2
3.7
3.7
3.6
KNR Constructions
Buy
509
603
1,430
937
1,470
14.3
14.0
44.2
38.6
11.5
13.2
2.3
2.0
15.4
15.4
1.6
1.0
Larsen & Toubro
Accumulate
1,228
1,310
114,367
58,870
65,708
8.3
10.3
42.0
53.0
29.2
23.2
2.0
1.8
8.8
11.2
2.2
2.0
Gujarat Pipavav Port
Neutral
177
-
8,557
629
684
51.0
52.2
6.4
5.9
27.7
30.0
3.6
3.4
15.9
12.7
13.3
12.0
MBL Infrastructures
Buy
152
285
631
2,313
2,797
12.2
14.6
19.0
20.0
8.0
7.6
0.8
0.8
11.3
10.6
1.0
0.9
Nagarjuna Const.
Neutral
73
-
4,056
7,892
8,842
8.8
9.1
3.0
5.3
24.3
13.8
1.2
1.1
5.0
8.5
0.8
0.6
PNC Infratech
Accumulate
489
558
2,507
1,873
2,288
13.2
13.5
24.0
32.0
20.4
15.3
2.0
1.8
12.1
12.3
1.4
1.2
Simplex Infra
Neutral
238
-
1,175
5,955
6,829
10.3
10.5
16.0
31.0
14.9
7.7
0.8
0.7
5.3
9.9
0.7
0.6
Stock Watch
March 22, 2016
Company Name
Reco
CMP
Target
Mkt Cap
Sales ( Čcr )
OPM(%)
EPS (Č)
PER(x)
P/BV(x)
RoE(%)
EV/Sales(x)
(Č)
Price ( Č)
( Č cr )
FY16E
FY17E
FY16E
FY17E
FY16E
FY17E
FY16E
FY17E
FY16E
FY17E
FY16E
FY17E
FY16E
FY17E
Construction
Power Mech Projects
Neutral
568
-
836
1,539
1,801
12.8
12.7
59.0
72.1
9.6
7.9
1.5
1.2
18.6
16.8
0.6
0.5
Sadbhav Engineering
Accumulate
269
289
4,619
3,481
4,219
10.7
10.8
8.2
11.7
32.8
23.0
3.1
2.8
10.3
13.5
1.6
1.3
NBCC
Accumulate
951
1,089
11,416
5,816
7,382
6.9
7.7
29.6
39.8
32.1
23.9
5.8
4.6
24.1
26.7
1.7
1.3
MEP Infra
Neutral
39
-
630
1,956
1,876
28.1
30.5
1.3
3.0
29.8
12.9
6.3
4.2
21.2
32.8
1.7
1.7
SIPL
Neutral
86
-
3,041
675
1,042
62.4
64.7
-
-
3.2
3.7
-
-
16.2
10.9
Engineers India
Neutral
166
-
5,593
1,667
1,725
13.5
16.0
9.7
11.4
17.1
14.6
2.0
1.9
11.7
13.4
2.2
2.2
Financials
Allahabad Bank
Neutral
54
-
3,234
8,569
9,392
2.8
2.9
16.3
27.5
3.3
2.0
0.3
0.2
7.6
11.9
-
-
Axis Bank
Accumulate
444
494
105,640
26,473
31,527
3.5
3.6
35.7
43.5
12.4
10.2
2.1
1.8
17.9
18.9
-
-
Bank of Baroda
Neutral
147
-
33,917
18,485
21,025
1.9
2.0
13.5
21.1
10.9
7.0
0.9
0.8
7.3
10.6
-
-
Bank of India
Neutral
99
-
8,038
15,972
17,271
1.9
2.0
15.3
33.4
6.5
3.0
0.3
0.3
3.6
7.6
-
-
Canara Bank
Neutral
193
-
10,477
15,441
16,945
2.0
2.1
46.6
70.4
4.1
2.7
0.4
0.3
8.0
11.2
-
-
Dena Bank
Neutral
29
-
1,871
3,440
3,840
2.1
2.3
7.3
10.0
4.0
2.9
0.3
0.3
6.1
7.9
-
-
Federal Bank
Neutral
50
-
8,667
3,477
3,999
3.0
3.0
5.0
6.2
10.1
8.1
1.0
0.9
10.6
11.9
-
-
HDFC
Neutral
1,152
-
182,005
10,358
11,852
3.3
3.3
41.1
47.0
28.1
24.5
5.3
4.9
24.7
24.9
-
-
HDFC Bank
Buy
1,044
1,262
263,945
38,309
47,302
4.3
4.3
49.3
61.1
21.2
17.1
3.7
3.1
18.5
19.7
-
-
ICICI Bank
Accumulate
235
254
136,515
34,279
39,262
3.3
3.3
21.0
24.4
11.2
9.6
1.9
1.6
14.4
14.7
-
-
IDBI Bank
Neutral
70
-
13,338
9,625
10,455
1.8
1.8
8.5
14.2
8.2
4.9
0.5
0.5
5.9
9.3
-
-
Indian Bank
Neutral
107
-
5,149
6,160
6,858
2.5
2.5
24.5
29.8
4.4
3.6
0.4
0.3
7.7
8.6
-
-
LIC Housing Finance
Buy
470
592
23,734
3,101
3,745
2.5
2.5
33.0
40.2
14.3
11.7
2.7
2.3
19.7
20.5
-
-
Oriental Bank
Neutral
93
-
2,778
7,643
8,373
2.4
2.4
37.2
45.4
2.5
2.0
0.2
0.2
8.2
9.4
-
-
Punjab Natl.Bank
Neutral
87
-
16,985
23,638
26,557
2.8
2.8
17.9
27.2
4.8
3.2
0.5
0.4
8.5
12.0
-
-
South Ind.Bank
Neutral
18
-
2,404
1,965
2,185
2.5
2.5
2.5
3.3
7.1
5.4
0.7
0.6
9.5
11.7
-
-
St Bk of India
Neutral
197
-
152,655
79,958
86,061
2.6
2.6
13.4
20.7
14.7
9.5
1.2
1.1
11.5
12.8
-
-
Union Bank
Neutral
131
-
8,981
12,646
14,129
2.3
2.4
31.0
39.1
4.2
3.3
0.5
0.4
9.8
11.4
-
-
Vijaya Bank
Neutral
31
-
2,698
3,536
3,827
1.9
1.9
5.5
6.7
5.7
4.7
0.5
0.4
7.8
8.8
-
-
Yes Bank
Neutral
832
-
34,954
7,190
9,011
3.2
3.3
58.2
69.7
14.3
11.9
2.6
2.2
19.2
19.6
-
-
FMCG
Asian Paints
Neutral
860
-
82,448
16,553
19,160
16.0
16.2
17.7
21.5
48.6
40.0
12.9
11.6
29.4
31.2
4.8
4.2
Britannia
Neutral
2,731
-
32,768
8,481
9,795
14.0
14.1
65.5
78.3
41.7
34.9
19.7
16.2
38.3
41.2
3.8
3.2
Colgate
Neutral
849
-
23,088
4,836
5,490
19.5
19.7
48.5
53.2
17.5
16.0
12.8
11.2
99.8
97.5
4.7
4.1
Stock Watch
March 22, 2016
Company Name
Reco
CMP
Target
Mkt Cap
Sales ( Čcr )
OPM(%)
EPS (Č)
PER(x)
P/BV(x)
RoE(%)
EV/Sales(x)
(Č)
Price ( Č)
( Č cr )
FY16E FY17E
FY16E
FY17E
FY16E
FY17E
FY16E
FY17E
FY16E
FY17E
FY16E
FY17E
FY16E
FY17E
FMCG
Dabur India
Accumulate
253
267
44,453
9,370
10,265
17.1
17.2
7.3
8.1
34.5
31.2
10.4
8.5
33.7
30.6
4.7
4.2
GlaxoSmith Con*
Neutral
5,976
-
25,132
4,919
5,742
17.2
17.4
168.3
191.2
35.5
31.3
10.1
8.6
28.8
28.9
4.7
4.0
Godrej Consumer
Neutral
1,339
-
45,587
10,168
12,886
16.1
16.1
32.1
38.4
41.7
34.9
8.5
7.8
19.7
21.0
4.6
3.6
HUL
Neutral
880
-
190,496
34,940
38,957
17.5
17.7
20.8
24.7
42.3
35.6
47.1
37.6
110.5
114.2
5.3
4.7
ITC
Accumulate
330
359
265,584
36,804
38,776
37.9
37.9
12.2
12.9
27.1
25.6
7.5
6.6
27.7
25.8
6.8
6.4
Marico
Neutral
247
-
31,874
6,551
7,766
15.7
16.0
10.4
12.5
23.8
19.8
6.9
5.8
33.2
32.4
4.8
4.0
Nestle*
Buy
5,258
6,646
50,696
11,291
12,847
22.2
22.3
158.9
184.6
33.1
28.5
17.3
15.6
55.0
57.3
4.3
3.8
Tata Global
Buy
120
144
7,567
8,635
9,072
9.8
9.9
6.5
7.6
18.5
15.8
1.8
1.8
6.8
7.4
0.8
0.8
IT
HCL Tech^
Buy
823
1,038
116,018
42,038
47,503
21.2
21.5
51.5
57.7
16.0
14.3
3.5
2.7
21.5
18.8
2.4
1.9
Infosys
Accumulate
1,195
1,347
275,381
61,850
69,981
27.5
27.5
59.4
65.7
20.1
18.2
4.3
3.7
21.2
20.1
3.7
3.2
TCS
Buy
2,444
2,854
481,504
108,487
122,590
28.3
28.5
122.8
138.4
19.9
17.7
7.6
6.9
38.0
38.9
4.0
3.5
Tech Mahindra
Accumulate
490
530
47,446
26,524
29,177
16.2
17.0
28.8
33.6
17.0
14.6
3.3
2.8
19.3
19.1
1.6
1.3
Wipro
Buy
557
680
137,702
50,808
56,189
23.7
23.8
37.3
40.7
14.9
13.7
2.9
2.6
19.2
17.7
2.2
1.8
Media
D B Corp
Accumulate
311
356
5,711
2,241
2,495
27.8
27.9
21.8
25.6
14.3
12.1
3.7
3.3
26.7
28.5
2.5
2.2
HT Media
Neutral
79
-
1,843
2,495
2,603
11.2
11.2
7.3
8.6
10.9
9.2
0.9
0.8
7.4
8.1
0.2
0.2
Jagran Prakashan
Buy
149
189
4,882
2,170
2,355
27.2
26.2
8.9
9.9
16.8
15.1
3.5
3.1
20.9
20.5
2.1
2.0
Sun TV Network
Neutral
364
-
14,360
2,779
3,196
70.2
70.5
22.8
27.3
16.0
13.4
3.9
3.6
26.7
28.3
4.9
4.3
Hindustan Media
Neutral
248
-
1,820
920
1,031
20.0
20.0
19.2
20.9
12.9
11.9
2.1
1.8
16.4
15.3
1.5
1.3
Ventures
Metals & Mining
Coal India
Buy
297
380
187,470
76,167
84,130
19.9
22.3
22.4
25.8
13.2
11.5
4.8
4.7
35.5
41.0
1.8
1.6
Hind. Zinc
Neutral
172
-
72,464
14,641
14,026
50.4
50.4
17.7
16.0
9.7
10.7
1.5
1.4
16.2
13.2
2.6
2.4
Hindalco
Neutral
86
-
17,749
104,356
111,186
8.7
9.5
6.7
11.1
12.8
7.8
0.5
0.4
3.5
5.9
0.7
0.6
JSW Steel
Neutral
1,215
-
29,372
42,308
45,147
16.4
20.7
(10.3)
49.5
24.6
1.4
1.3
(1.0)
5.6
1.7
1.6
NMDC
Neutral
98
-
38,934
8,237
10,893
46.6
44.5
10.0
11.7
9.9
8.4
1.1
1.0
12.5
13.0
4.5
3.4
SAIL
Neutral
43
-
17,697
45,915
53,954
7.2
10.5
1.5
4.4
28.5
9.8
0.4
0.4
2.3
4.1
1.0
0.9
Vedanta
Neutral
94
-
27,868
71,445
81,910
26.2
26.3
12.9
19.2
7.3
4.9
0.5
0.5
7.2
8.9
0.8
0.6
Tata Steel
Neutral
303
-
29,418
126,760
137,307
8.9
11.3
6.4
23.1
47.6
13.1
1.0
0.9
2.0
7.1
0.8
0.8
Oil & Gas
Cairn India
Neutral
157
-
29,445
11,323
12,490
49.4
51.0
20.7
20.7
7.6
7.6
0.5
0.5
6.4
6.1
1.7
1.0
GAIL
Neutral
362
-
45,925
64,856
70,933
9.1
9.6
24.0
28.9
15.1
12.5
1.3
1.2
8.8
9.6
0.9
0.8
ONGC
Neutral
217
-
185,697
154,564
167,321
36.8
37.4
28.6
32.5
7.6
6.7
1.0
0.9
12.7
13.5
1.4
1.3
Stock Watch
March 22, 2016
Company Name
Reco
CMP
Target
Mkt Cap
Sales ( Čcr )
OPM(%)
EPS (Č)
PER(x)
P/BV(x)
RoE(%)
EV/Sales(x)
(Č)
Price ( Č)
( Č cr )
FY16E FY17E
FY16E
FY17E
FY16E
FY17E
FY16E
FY17E
FY16E
FY17E
FY16E
FY17E
FY16E
FY17E
Oil & Gas
Petronet LNG
Neutral
254
-
19,080
29,691
31,188
5.8
6.2
12.8
13.4
19.9
19.0
3.0
2.6
15.8
14.8
0.7
0.7
Indian Oil Corp
Buy
395
455
95,795
359,607
402,760
5.9
6.1
42.5
48.7
9.3
8.1
1.2
1.1
14.1
14.4
0.4
0.3
Reliance Industries
Accumulate
1,036
1,150
335,741
304,775
344,392
12.6
13.4
91.3
102.6
11.4
10.1
1.3
1.2
11.8
12.0
1.0
0.9
Pharmaceuticals
Alembic Pharma
Neutral
611
-
11,522
3,274
3,802
26.9
19.4
35.0
28.7
17.5
21.3
7.7
5.8
55.6
31.2
3.5
2.9
Aurobindo Pharma
Buy
743
856
43,475
14,923
17,162
22.0
23.0
35.7
42.8
20.8
17.4
6.1
4.6
34.0
30.2
3.3
2.8
Aventis*
Neutral
4,169
-
9,602
2,082
2,371
17.4
20.8
118.2
151.5
35.3
27.5
5.2
4.2
19.9
25.5
4.3
3.6
Cadila Healthcare
Neutral
341
-
34,935
10,224
11,840
21.0
22.0
14.6
17.6
23.4
19.4
6.4
5.0
30.8
29.0
3.5
2.9
Cipla
Accumulate
536
605
43,057
13,979
16,447
20.2
18.6
25.7
27.5
20.9
19.5
3.4
2.9
17.6
16.1
3.1
2.6
Dr Reddy's
Buy
3,183
3,933
54,280
16,838
19,575
25.0
23.1
167.5
178.8
19.0
17.8
4.0
3.3
23.1
20.4
3.2
2.7
Dishman Pharma
Neutral
339
-
2,739
1,733
1,906
21.5
21.5
17.0
19.9
20.0
17.1
2.0
1.8
10.5
11.2
2.1
1.8
GSK Pharma*
Neutral
3,438
-
29,121
2,870
3,158
20.0
22.1
59.5
68.3
57.8
50.3
17.1
17.5
28.5
34.3
9.6
8.8
Indoco Remedies
Neutral
267
-
2,464
1,033
1,199
15.9
18.2
9.4
13.6
28.4
19.7
4.2
3.6
15.7
19.7
2.5
2.1
Ipca labs
Buy
559
900
7,057
3,363
3,909
12.9
18.6
13.4
28.0
41.7
20.0
3.0
2.6
7.4
14.0
2.4
2.1
Lupin
Neutral
1,535
-
69,177
13,092
16,561
25.0
27.0
50.4
68.3
30.5
22.5
6.3
5.0
22.8
24.7
5.0
3.8
Sun Pharma
Accumulate
836
950
201,113
28,163
32,610
25.8
30.7
17.4
26.9
48.0
31.1
4.6
3.9
13.0
16.6
6.6
5.5
Power
Tata Power
Neutral
59
-
15,998
35,923
37,402
22.6
22.8
4.1
5.2
14.6
11.5
1.1
1.0
7.5
9.3
1.4
1.3
NTPC
Accumulate
128
146
105,130
87,271
99,297
23.5
23.5
11.8
13.3
10.9
9.6
1.2
1.1
11.5
12.2
2.2
2.0
Power Grid
Buy
138
170
72,222
20,702
23,361
86.7
86.4
12.1
13.2
11.4
10.5
1.7
1.5
15.6
15.1
8.4
7.8
Real Estate
MLIFE
Buy
423
554
1,735
697
1,011
14.9
19.3
13.8
20.1
30.6
21.0
1.1
1.1
3.8
5.3
3.8
2.6
Telecom
Bharti Airtel
Neutral
354
-
141,328
101,748
109,191
32.1
31.7
12.0
12.5
29.5
28.3
2.0
1.9
6.9
6.7
2.0
1.8
Idea Cellular
Neutral
102
-
36,707
34,282
36,941
32.0
31.5
5.9
6.2
17.3
16.4
1.6
1.4
9.9
9.3
1.6
1.6
zOthers
Abbott India
Neutral
4,639
-
9,857
2,715
3,153
14.5
14.1
134.3
152.2
34.6
30.5
8.6
7.1
27.4
25.6
3.3
2.8
Bajaj Electricals
Buy
197
237
1,991
4,719
5,287
5.2
5.8
8.6
12.7
23.0
15.6
2.6
2.3
11.4
14.8
0.4
0.4
Finolex Cables
Neutral
256
-
3,911
2,520
2,883
12.2
12.0
12.7
14.2
20.2
18.0
2.8
2.4
13.6
13.5
1.3
1.1
Goodyear India*
Buy
477
582
1,101
1,800
1,600
11.7
11.5
58.7
52.9
8.1
9.0
1.8
1.6
24.6
18.7
0.4
0.4
Hitachi
Neutral
1,147
-
3,118
1,779
2,081
7.8
8.8
21.8
33.4
52.6
34.3
8.5
6.9
17.4
22.1
1.8
1.5
Jyothy Laboratories
Neutral
283
-
5,128
1,620
1,847
11.5
11.5
7.3
8.5
38.8
33.4
5.0
4.7
13.3
14.4
3.0
2.6
MRF
Buy
34,748
45,575
14,737
20,316
14,488
21.4
21.1
5,488.0
3,798.0
6.3
9.2
2.2
1.8
41.1
21.2
0.7
0.9
Page Industries
Neutral
11,668
-
13,014
1,929
2,450
19.8
20.1
229.9
299.0
50.8
39.0
22.4
15.6
52.1
47.1
6.8
5.3
Stock Watch
March 22, 2016
Company Name
Reco
CMP
Target
Mkt Cap
Sales ( Čcr )
OPM(%)
EPS (Č)
PER(x)
P/BV(x)
RoE(%)
EV/Sales(x)
(Č)
Price ( Č)
( Č cr )
FY16E
FY17E
FY16E
FY17E
FY16E
FY17E
FY16E
FY17E
FY16E
FY17E
FY16E
FY17E
FY16E
FY17E
zOthers
Relaxo Footwears
Neutral
383
-
4,598
1,767
2,152
12.3
12.5
19.3
25.1
19.9
15.3
4.9
3.8
27.7
27.8
2.7
2.2
Siyaram Silk Mills
Buy
973
1,354
912
1,636
1,815
11.5
11.5
89.9
104.1
10.8
9.3
1.8
1.6
17.9
17.8
0.7
0.6
Styrolution ABS India* Neutral
570
-
1,002
1,271
1,440
8.6
9.2
32.0
41.1
17.8
13.9
1.8
1.6
10.7
12.4
0.8
0.7
TVS Srichakra
Buy
2,428
3,217
1,859
2,035
2,252
15.9
15.3
248.6
268.1
9.8
9.1
4.3
3.1
43.6
33.9
1.0
0.8
HSIL
Accumulate
284
302
2,052
2,123
2,384
16.1
16.5
15.0
18.9
18.9
15.0
1.5
1.4
8.0
9.4
1.3
1.2
Kirloskar Engines India
Neutral
211
-
3,050
2,403
2,554
8.6
9.9
9.2
10.5
23.0
20.1
2.2
2.1
9.7
10.7
0.9
0.8
Ltd
M M Forgings
Buy
442
614
534
511
615
21.7
21.6
43.1
55.8
10.3
7.9
1.9
1.5
19.9
21.2
1.3
0.9
Banco Products (India) Neutral
106
-
759
1,208
1,353
11.0
12.3
10.8
14.5
9.8
7.3
1.1
1.0
11.9
14.5
0.6
0.5
Competent Automobiles Neutral
135
-
83
1,040
1,137
3.2
3.1
25.7
28.0
5.3
4.8
0.8
0.7
15.0
14.3
0.1
0.1
Nilkamal
Neutral
1,122
-
1,674
1,871
2,031
10.7
10.5
63.2
69.8
17.8
16.1
2.9
2.5
17.6
16.6
0.9
0.8
Visaka Industries
Buy
104
144
164
1,086
1,197
9.9
10.3
21.5
28.8
4.8
3.6
0.5
0.4
9.6
11.6
0.4
0.3
Transport Corporation of
Neutral
284
-
2,162
2,830
3,350
8.8
9.0
14.4
18.3
19.8
15.5
3.1
2.7
15.4
17.1
0.9
0.8
India
Elecon Engineering
Neutral
57
-
621
1,359
1,482
10.3
13.7
0.8
3.9
71.0
14.7
1.2
1.1
1.6
7.8
0.8
0.7
Surya Roshni
Buy
136
201
597
2,992
3,223
8.1
8.4
14.7
18.3
9.3
7.4
0.9
0.8
9.7
11.0
0.5
0.4
MT Educare
Neutral
171
-
682
286
366
18.3
17.7
7.7
9.4
22.2
18.3
4.7
4.1
20.2
21.1
2.3
1.7
Radico Khaitan
Buy
99
156
1,322
1,517
1,635
12.7
13.4
5.8
7.1
17.1
14.0
1.5
1.3
8.6
9.6
1.3
1.2
Garware Wall Ropes
Buy
335
473
732
862
974
11.2
11.2
24.9
29.6
13.5
11.3
2.0
1.7
15.1
15.4
0.9
0.7
Wonderla Holidays
Neutral
357
-
2,019
206
308
44.0
43.6
9.0
12.9
39.7
27.7
5.4
4.9
13.7
17.8
9.7
6.5
Linc Pen & Plastics
Neutral
196
-
289
340
371
8.3
8.9
10.8
13.2
18.1
14.8
2.9
2.5
16.0
17.1
0.9
0.8
The Byke Hospitality
Neutral
154
-
619
222
287
20.5
20.5
5.6
7.6
27.4
20.4
5.2
4.2
18.9
20.8
2.8
2.2
Interglobe Aviation
Neutral
849
-
30,592
17,022
21,122
20.7
14.5
63.9
53.7
13.3
15.8
19.9
16.3
149.9
103.2
1.8
1.5
Coffee Day Enterprises
Neutral
230
-
4,728
2,692
2,964
17.0
18.6
-
4.7
-
48.4
2.8
2.7
0.2
5.5
2.2
2.0
Ltd
Navneet Education
Neutral
82
-
1,946
998
1,062
24.1
24.0
5.8
6.1
14.2
13.4
3.1
2.8
22.0
20.6
2.0
1.9
Navkar Corporation
Buy
162
265
2,312
365
436
38.3
37.5
5.6
5.9
28.8
27.6
1.8
1.7
6.3
6.1
7.2
6.2
Source: Company, Angel Research; Note: *December year end; #September year end; &October year end; Price as on March 21, 2016
Market Outlook
March 22, 2016
Research Team Tel: 022 - 39357800
DISCLAIMER
Angel Broking Private Limited (hereinafter referred to as “Angel”) is a registered Member of National Stock Exchange of India Limited,
Bombay Stock Exchange Limited and Metropolitian Stock Exchange of India Limited. It is also registered as a Depository Participant with
CDSL and Portfolio Manager with SEBI. It also has registration with AMFI as a Mutual Fund Distributor. Angel Broking Private Limited is a
registered entity with SEBI for Research Analyst in terms of SEBI (Research Analyst) Regulations, 2014 vide registration number
INH000000164. Angel or its associates has not been debarred/ suspended by SEBI or any other regulatory authority for accessing
/dealing in securities Market. Angel or its associates including its relatives/analyst do not hold any financial interest/beneficial ownership
of more than 1% in the company covered by Analyst. Angel or its associates/analyst has not received any compensation / managed or co
-managed public offering of securities of the company covered by Analyst during the past twelve months. Angel/analyst has not served as
an officer, director or employee of company covered by Analyst and has not been engaged in market making activity of the company
covered by Analyst.
This document is solely for the personal information of the recipient, and must not be singularly used as the basis of any investment
decision. Nothing in this document should be construed as investment or financial advice. Each recipient of this document should make
such investigations as they deem necessary to arrive at an independent evaluation of an investment in the securities of the companies
referred to in this document (including the merits and risks involved), and should consult their own advisors to determine the merits and
risks of such an investment.
Reports based on technical and derivative analysis center on studying charts of a stock's price movement, outstanding positions and
trading volume, as opposed to focusing on a company's fundamentals and, as such, may not match with a report on a company's
fundamentals.
The information in this document has been printed on the basis of publicly available information, internal data and other reliable sources
believed to be true, but we do not represent that it is accurate or complete and it should not be relied on as such, as this document is for
general guidance only. Angel Broking Pvt. Limited or any of its affiliates/ group companies shall not be in any way responsible for any
loss or damage that may arise to any person from any inadvertent error in the information contained in this report. Angel Broking Pvt.
Limited has not independently verified all the information contained within this document. Accordingly, we cannot testify, nor make any
representation or warranty, express or implied, to the accuracy, contents or data contained within this document. While Angel Broking
Pvt. Limited endeavors to update on a reasonable basis the information discussed in this material, there may be regulatory, compliance,
or other reasons that prevent us from doing so.
This document is being supplied to you solely for your information, and its contents, information or data may not be reproduced,
redistributed or passed on, directly or indirectly.
Neither Angel Broking Pvt. Limited, nor its directors, employees or affiliates shall be liable for any loss or damage that may arise from or
in connection with the use of this information.
Note: Please refer to the important ‘Stock Holding Disclosure' report on the Angel website (Research Section). Also, please refer to the
latest update on respective stocks for the disclosure status in respect of those stocks. Angel Broking Pvt. Limited and its affiliates may have
investment positions in the stocks recommended in this report.