Market Outlook
October 21, 2015
Market Cues
Domestic Indices
Chg (%)
(Pts)
(Close)
Indian markets are expected to open on flat note tracking the SGX Nifty and most its
BSE Sensex
(0.2)
(58)
27,307
Asian peers.
Nifty
(0.2)
(13)
8,262
Following the lackluster performance seen in the previous session, US Markets
Mid Cap
0.5
59
11,184
continued to experience choppy trading and closed lower on Tuesday.
Small Cap
0.2
21
11,606
The European markets edged lower on Tuesday, dragged down by energy and
Bankex
(0.1)
(18)
20,371
mining stocks as investors continued to fret about slowing growth in China.
The Indian shares fell on Tuesday, pressured by mixed global cues, a weaker rupee
Global Indices
Chg (%)
(Pts)
(Close)
and profit taking after three days of gains.
Dow Jones
(0.1)
(13)
17,217
News & Result Analysis
Nasdaq
(0.5)
(23)
4,881
Cipla- Gets a 483 on its Indore plant
FTSE
(0.1)
(7)
6,345
HCL Technologies set to buy Volvo's IT arm for $138 mn in all-cash deal
Nikkei
0.4
76
18,207
Result Review: Sanofi India, Hero Motocorp
Hang Seng
(0.4)
(86)
22,989
Result Preview: Wipro, Bajaj Auto
Shanghai Com
1.1
39
3,425
Detailed analysis on Pg2
Investor’s Ready Reckoner
Advances / Declines
Bse
Nse
Key Domestic & Global Indicators
Advances
1,419
827
Stock Watch: Latest investment recommendations on 150+ stocks
Declines
1,365
708
Refer Pg8 onwards
Unchanged
166
76
Top Picks
CMP
Target
Upside
Volumes (` Cr)
Company
Sector
Rating
(`)
(`)
(%)
BSE
3,377
Axis Bank
Financials
Buy
509
674
32.5
NSE
17,526
HCL Tech
IT
Buy
865
1,132
30.9
ICICI Bank
Financials
Buy
286
370
29.3
Net Inflows (` Cr)
Net
Mtd
Ytd
Power Grid
Power
Buy
136
170
24.9
FII
1,063
4,679 1,22,744
TCS
IT
Buy
2,527
3,165
25.3
More Top Picks on Pg5
MFs
(131)
985
79,990
Key Upcoming Events
Top Gainers
Price (`)
Chg (%)
Previous
Consensus
Date
Region
Event Description
Reading
Expectations
Adanipower
31
8.7
Oct 22
US
Initial Jobless claims
255.0
265.0
Torntpower
186
7.4
Oct 22
Euro Zone
Euro-Zone Consumer Confidence
(7.10)
(7.40)
Hcc
25
6.4
Oct 22
Euro Zone
ECB announces interest rates
0.05
0.05
Bajfinance
5,306
5.8
Oct 28
US
FOMC rate decision
0.25
0.25
Renuka
11
5.6
Top Losers
Price (`)
Chg (%)
Gati
152
(7.0)
Vedl
101
(6.4)
Jetairways
396
(5.2)
Amtekauto
44
(4.8)
Cairn
154
(3.7)
As on October 20, 2015
Market Outlook
October 21, 2015
Cipla- Gets a 483 on its Indore plant
The USFDA has issued a ‘Form 483’ to Cipla’s Indore Facility, used for exporting
drugs to US. According to the US regulator, Form
483 is issued to firm
management at the conclusion of an inspection when the investigator has
observed any conditions that in their judgement may constitute violations of the
Food Drug and Cosmetic Act and related Acts. The FDA has reportedly highlighted
9 observations. While full details not know, it’s been reported that the observations
are not data integrated related, and should not lead to serious consequences for
the company. While the exact sales from the Indore plant are not know, US
contributes around 8% of its overall sales in FY2015. As of now we are not
changing our estimates. In a worst case scenario the impact on EPS will be 5-6%,
assuming all sales in US are catered by Indore, which is not the case. We remain
neutral on the stock.
HCL Technologies set to buy Volvo's IT arm for $138 mn in
all-cash deal
HCL Technologies will buy Swedish commercial vehicles major Volvo Group's
external IT business for $138 million (around Rs 895 crore) in all-cash deal. Volvo
Group will also outsource its IT infrastructure operations to HCL Technologies for
an undisclosed contract value for five years. The Volvo Group and HCL have
signed a Letter of Intent, awaiting the signing of the final contract, Volvo Group
said in a statement from Stockholm.
In India, HCL Technologies said in a filing to the BSE that it will be "acquiring from
the Volvo Group its external IT business relating to provision of IT infrastructure,
mainframe service and application operation services for an all cash consideration
of SEK 1.1 billion ($138 million)". Volvo group derived revenue of SEK 1.6 billion
($190 million) from external customers during the last 12 months.
According to HCL, it has signed a letter on intent with the Volvo Group for
undertaking its infrastructure and operation services. The total contract value which
is for five yeas is not disclosed.
According to Volvo, approximately 2,600 Volvo personnel globally will be affected
by the transaction. They will be given the offer to move over to HCL Technologies
and will continue to work closely with their colleagues in Volvo's IT services
division. We recommend a buy on stock.
Result Review
Sanofi India (CMP: `4,005 / TP: /Upside:)
During the quarter the company has reported healthy numbers both on top-line
and bottom-line front. On top-line front, the company grew by ~13% yoy to
`553cr (our estimates was `536). On the bottom-line front, the company has
reported PAT growth around ~17% yoy to ~`73cr (our estimates was `70cr) on
back of healthy improvement in operating margin. We maintain our neutral stance
on the stock.
Market Outlook
October 21, 2015
Y/E
Sales OPM
PAT
EPS ROE P/E P/BV EV/EBITDA EV/Sales
March
(` cr)
(%)
(` cr)
(`)
(%)
(x)
(x)
(x)
(x)
FY2015E
2,156
15.1
253
109.7
18.4
36.5
5.0
26.2
4.0
FY2016E
2,455
16.8
308
133.9
22.5
29.9
4.1
19.6
3.3
Hero Motocorp (CMP: `2,605 / TP: /Upside: )
Hero Motocorp 2QFY2016 results were ahead of estimates as the company
springed a positive surprise on the operating front. Hero managed to improve the
margins despite volume declines (volumes were down 7%) and posted a record
five year highest operating margin of 15.8%. Revenues at Rs 6,837 cr declined
marginally by 1% and were in line with our assumptions. However, subdued
commodity prices coupled with cost control initiatives helped Hero to improve
margins steeply by 230 bp yoy and better our estimates of 14.7% despite the
sluggish topline. Strong operating profits led to the company reporting a robust
profit of Rs 772 cr which beat our expectations of Rs 725 cr. We currently have
Neutral rating on the stock but would review our estimates post interaction with the
management.
Y/E
Sales OPM
PAT
EPS ROE P/E P/BV EV/EBITDA EV/Sales
March
(` cr)
(%)
(` cr)
(`)
(%)
(x)
(x)
(x)
(x)
FY2016E
28,500
14.1
2,933
146.9
37.8
17.7
6.7
12.0
1.6
FY2017E
32,764
14.3
3,335
167.0
36.5
15.6
5.6
9.9
1.4
Result Preview
Wipro (CMP: `572 / TP: `719 /Upside:25.7%)
Wipro is expected to post its 2QFY2016 results today. Wipro is expected to post a
1.8% qoq growth to end the period at US$1826mn V/sUS$1794mn in
4QFY2015. In rupee terms, the company is expected to post a 3.8% qoq growth of
`12,703cr V/s `12,238cr in 4QFY2015. On the EBIDTA front, the margins are
likely to come in at 21.3% almost same as the last year. On EBIT front, the
company is expected to post a 18.7% V/s 18.5% in 4QFY2015. We expect the Net
Profit to grow 1.6% qoq to end the period at `2,223cr. We currently have buy
rating on the stock.
Y/E
Sales OPM
PAT
EPS ROE P/E P/BV EV/EBITDA EV/Sales
March
(` cr)
(%)
(` cr)
(`)
(%)
(x)
(x)
(x)
(x)
FY2016E
52,414
23.7
9,483
38.4
19.5
14.9
2.9
9.7
2.2
FY2017E
58,704
23.8
10,449
42.4
18.0
13.5
2.6
7.9
1.8
Bajaj Auto (CMP: `2,440 / TP: ` /Upside: )
Bajaj Auto is slated to announce its 2QFY2016 results today. Bajaj’s topline is
expected to remain flat at `5,960 cr. We expect the volumes as well as realization
to remain flat on yoy basis. On the EBIDTA front, the margins are likely to improve
220 bp yoy to 21.1% on account favourable currency realisation. EBIDTA is
Market Outlook
October 21, 2015
estimated to grow 12% yoy to `1,258 cr. We expect the Net Profit to grow 10% yoy
to `919 cr. We currently have Neutral rating on the stock.
Y/E
Sales OPM
PAT
EPS ROE P/E P/BV EV/EBITDA EV/Sales
March
(` cr)
(%)
(` cr)
(`)
(%)
(x)
(x)
(x)
(x)
FY2016E
23,544
19.8
3,672
127.0
30.3
19.2
5.8
12.7
2.6
FY2017E
27,245
19.8
4,147
143.4
29.4
17.0
5.0
10.5
2.2
Economic and Political News
Odisha to firm up 300 Mw through power banking
Oil & gas industry seeks slashing of `4,500 per tonne cess on crude
Maharashtra FDA chief pitches for Make in India in food processing
Corporate News
Syngene Q2 profit up 31% to `52.3cr
Telecom major Airtel sells 8,300 mobile towers in Africa for $1.7 billion
JLR to launch updated 'Range Rover Evoque' in India next month
Market Outlook
October 21, 2015
Top Picks ★★★★★
Large Cap
Market Cap
CMP
Target
Upside
Company
Rationale
(` Cr)
(`)
(`)
(%)
Healthy pace of branch expansion, backed by distribution
Axis Bank
1,20,962
509
674
32.5
network, will be the driving force for the bank’s retail business
and overall earnings.
The stock is trading at attractive valuations and is factoring all
HCL Tech
1,21,634
865
1,132
30.9
the bad news.
Due to its robust franchise and capital adequacy position, the
bank is well positioned to grow by at least a few percentage
ICICI Bank
1,66,187
286
370
29.3
points higher than the average industry growth rate from a
structural point of view.
Back on the growth trend , expect a long term growth of 14% to
Infosys
2,58,487
1,125
1,306
16.1
be a US$20bn in FY2020.
Government thrust on Renewable sector and strong order book
Inox Wind
8,924
402
505
25.6
would drive future growth.
LICHF continues to grow its retail loan book at a healthy pace
with improvement in asset quality. We expect the company to
LIC HFL
23,878
473
570
20.5
post a healthy loan book which is likely to reflect in a strong
earnings growth.
Direct beneficiary of the huge investments lined up in the power
Power Grid
71,228
136
170
24.9
transmission sector.
Growth to pick up from 2HFY2017, attractive given the risk-
TCS
4,97,868
2,527
3,165
25.3
reward.
Tech Mahindra
52,649
547
646
18.1
Acquisitions, to drive growth, normalised valuations attractive.
An improving liability franchise, capital adequacy well above
Yes Bank
32,267
770
906
17.6
Basel III requirements and lowest NPA ratio in the industry, will
help Yes Bank to deliver a stronger growth.
Source: Company, Angel Research
Mid Cap
Market Cap
CMP
Target
Upside
Company
Rationale
(` Cr)
(`)
(`)
(%)
Bajaj Electricals
2,564
254
341
34.2
Visible turnaround in E&P business to drive the earnings
Garware Wall Ropes
781
357
390
9.2
Higher exports & easing material prices to drive profitability
Comfortable balance sheet to support strong growth; this
MBL Infrastructures
932
225
360
60.1
coupled with attractive valuation to lead to rerating.
New product introductions and increased sourcing by clients to
Minda Industries
810
510
652
27.8
enable outpace industry growth
Strong brand & quality teaching with innovative technologies &
MT Educare
574
144
169
17.2
higher government educational spending to boost growth
Earnings boost on back of stable material prices and favourable
Radico Khaitan
1,325
100
112
12.4
pricing environment. Valuation discount to peers provides
additional comfort
Structural shift in the Lighting industry towards LED lighting will
Surya Roshni
631
144
183
27.0
drive growth.
Tree House
1,241
293
449
53.1
Robust expansion plan for pre-schools to drive growth
Source: Company, Angel Research
Market Outlook
October 21, 2015
Quarterly Bloomberg Brokers Consensus Estimate
Mahindra & Mahindra Ltd - October 21, 2015
Particulars (` cr)
2QFY16E
2QFY15
y-o-y (%)
1QFY16
q-o-q (%)
Net sales
8,597
9,418
(8.7)
9,708
(11.4)
EBITDA
1,120
1,009
11.0
1,252
(10.6)
EBITDA margin (%)
13.0
10.7
12.9
Net profit
909
947
(4.0)
852
6.7
Bajaj Auto Ltd - October 21, 2015
Particulars (` cr)
2QFY16E
2QFY15
y-o-y (%)
1QFY16
q-o-q (%)
Net sales
6,020
5,827
3.3
5,505
9.4
EBITDA
1,265
1,127
12.3
1,140
11.0
EBITDA margin (%)
21.0
19.3
20.7
Net profit
901
591
52.4
1,015
(11.2)
HDFC Bank Ltd - October 21, 2015
Particulars (` cr)
2QFY16E
2QFY15
y-o-y (%)
1QFY16
q-o-q (%)
PAT
2,882
2,381
21.0
2,696
6.9
Wipro Ltd Consol - October 21, 2015
Particulars (` cr)
2QFY16E
2QFY15
y-o-y (%)
1QFY16
q-o-q (%)
Net sales
12,813
11,684
9.7
12,238
4.7
EBITDA
2,713
2,481
9.3
2,606
4.1
EBITDA margin (%)
21.2
21.2
21.3
Net profit
2,227
2,085
6.8
2,188
1.8
JSW Steel Ltd Consol - October 21, 2015
Particulars (` cr)
2QFY16E
2QFY15
y-o-y (%)
1QFY16
q-o-q (%)
Net sales
11,058
13,692
(19.2)
11,382
(2.8)
EBITDA
1,583
2,791
(43.3)
1,627
(2.7)
EBITDA margin (%)
14.3
20.4
14.3
Net profit
(169)
749
0.0
(107)
0.0
Cairn India Ltd Consol - October 21, 2015
Particulars (` cr)
2QFY16E
2QFY15
y-o-y (%)
1QFY16
q-o-q (%)
Net sales
2,263
3,982
(43.2)
2,627
(13.9)
EBITDA
940
2,656
(64.6)
1,290
(27.1)
EBITDA margin (%)
41.5
66.7
49.1
Net profit
588
2,278
(74.2)
835
(29.5)
Idea Cellular Ltd Consol - October 21, 2015
Particulars (` cr)
2QFY16E
2QFY15
y-o-y (%)
1QFY16
q-o-q (%)
Net sales
8,751
7,566
15.7
8,795
(0.5)
EBITDA
3,082
2,491
23.8
3,228
(4.5)
EBITDA margin (%)
35.2
32.9
36.7
Net profit
823
756
8.9
931
(11.6)
Market Outlook
October 21, 2015
Asian Paints Ltd Consol - October 23, 2015
Particulars (` cr)
2QFY16E
2QFY15
y-o-y (%)
1QFY16
q-o-q (%)
Net sales
3,906
3,587
8.9
3,578
9.2
EBITDA
672
536
25.3
684
(1.7)
EBITDA margin (%)
17.2
15.0
19.1
Net profit
440
347
26.8
455
(3.2)
Godrej Consumer Products Ltd Consol - October 24, 2015
Particulars (` cr)
2QFY16E
2QFY15
y-o-y (%)
1QFY16
q-o-q (%)
Net sales
2,286
2,048
11.7
2,095
9.1
EBITDA
414
342
21.1
315
31.1
EBITDA margin (%)
18.1
16.7
15.0
Net profit
281
235
19.6
199
40.8
Market Outlook
October 21, 2015
Key Upcoming Events
Result Calendar
Date
Company
Oct 21, 2015
Bajaj Auto, HDFC Bank, Wipro, KPIT Cummins, NIIT, JSW Steel , Cairn India
Oct 22, 2015
Cadila Healthcare
Oct 23, 2015
Rallis, Asian Paints
Oct 24, 2015
Godrej Consumer, Persistent
Oct 25, 2015
Oct 26, 2015
United Phosphorus, Blue Star, HDFC, Hindustan Media Ventures, Hitachi
Oct 27, 2015
Maruti, TVS Motor, CEAT, Thermax, Axis Bank, Sesa Goa, Lupin, Alembic Pharma
Exide Industries, Amara Raja Batteries, JK Tyre, Ambuja Cements, Syndicate Bank, Dabur India, Sun TV Network, HT
Oct 28, 2015
Media, Kirloskar Engines India Ltd, Elecon Engineering, Transport Corporation of India
Bharat Forge, Crompton Greaves, Areva, Shriram Trans., Nestle, Colgate, MRF, L G Balakrishnan & Bros, Dr Reddy's,
Oct 29, 2015
Glenmark Pharma., Dishman Pharma, NTPC
Oct 30, 2015
Apollo Tyres, Subros, ICICI Bank, Kotak Mah. Bank, Ipca labs, Indoco Remedies
Oct 31, 2015
IDFC, IOB, GSK Pharma
Oct 30, 2015
Apollo Tyres, Subros, ICICI Bank, Kotak Mah. Bank, Indoco Remedies
Nov 2, 2015
LMW, India Cements, Indian Bank, Electrosteel Castings, GIPCL
Nov 3, 2015
ABB, Power Fin.Corpn., Tech Mahindra, Hexaware, PVR, Finolex Cables, PTC India
Source: Bloomberg, Angel Research
Global economic events release calendar
Date
Time
Country
Event Description
Unit
Period
Bloomberg Data
Last Reported Estimated
Oct 22, 2015 6:00PM US
Initial Jobless claims
Thousands
Oct 17
255.00
265.00
7:30PM Euro Zone
Euro-Zone Consumer Confidence
Value
Oct A
(7.10)
(7.40)
7:30PM US
Existing home sales
Million
Sep
5.31
5.39
5:15PM Euro Zone
ECB announces interest rates
%
Oct 22
0.05
0.05
Oct 23, 2015 1:00PM Germany
PMI Services
Value
Oct P
54.10
53.90
1:00PM Germany
PMI Manufacturing
Value
Oct P
52.30
51.70
Oct 26, 2015 7:30PM US
New home sales
Thousands
Sep
552.00
549.00
Oct 27, 2015 3:00PM UK
GDP (YoY)
% Change
3Q A
2.40
--
7:30PM US
Consumer Confidence
S.A./ 1985=100
Oct
103.04
102.00
Oct 28, 2015 11:30PM US
FOMC rate decision
%
Oct 28
0.25
0.25
Oct 29, 2015 2:25PM Germany
Unemployment change (000's)
Thousands
Oct
2.00
--
6:00PM US
GDP Qoq (Annualised)
% Change
3Q A
3.90
1.90
Nov 1, 2015
6:30AM China
PMI Manufacturing
Value
Oct
49.80
--
Nov 2, 2015
3:00PM UK
PMI Manufacturing
Value
Oct
51.50
--
Nov 5, 2015
5:30PM UK
BOE Announces rates
% Ratio
Nov 5
0.50
0.50
Nov 6, 2015
3:00PM UK
Industrial Production (YoY)
% Change
Sep
1.90
--
7:00PM US
Change in Nonfarm payrolls
Thousands
Oct
142.00
--
7:00PM US
Unnemployment rate
%
Oct
5.10
--
Source: Bloomberg, Angel Research
Market Outlook
October 21, 2015
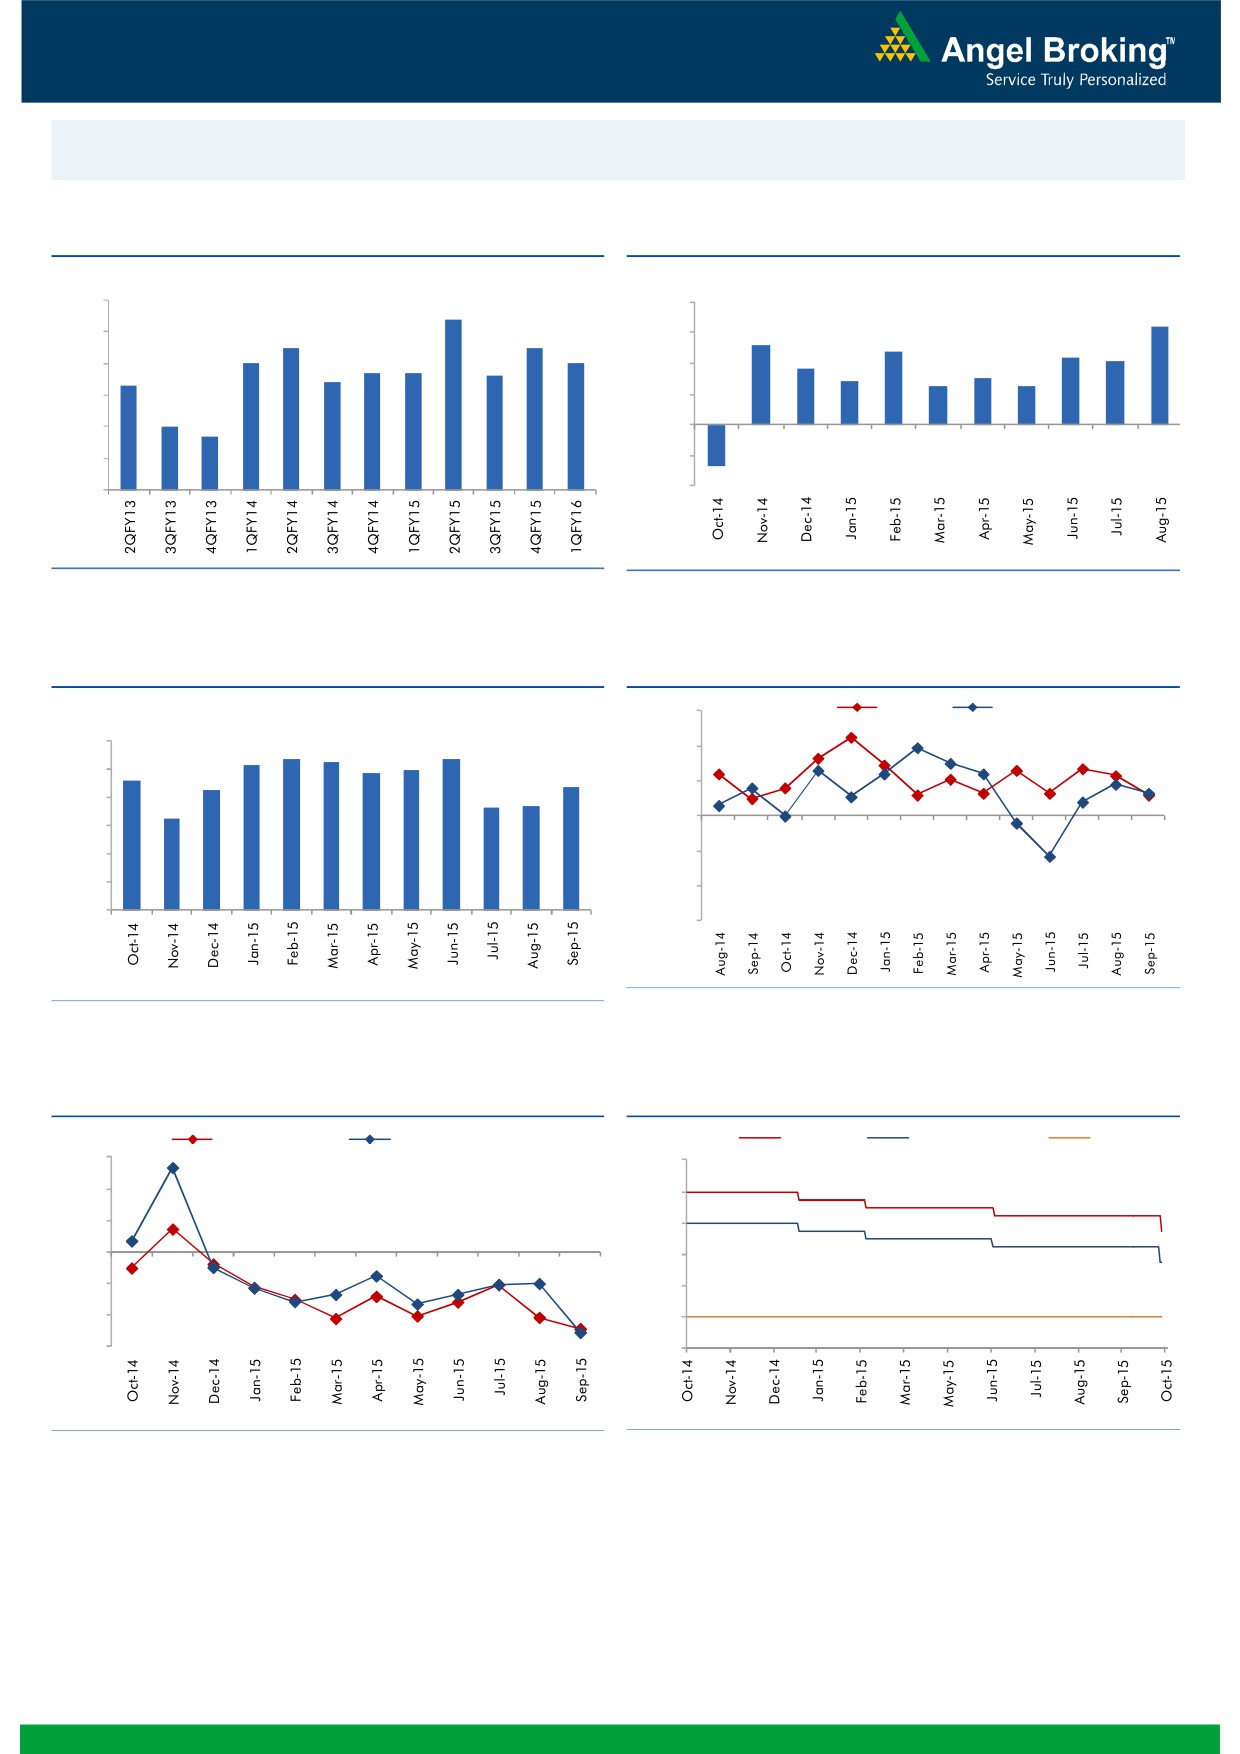
Macro watch
Exhibit 1: Quarterly GDP trends
Exhibit 2: IIP trends
(%)
(%)
9.0
8.4
8.0
6.4
7.5
7.5
5.2
8.0
6.0
4.8
7.0
7.0
4.4
4.1
6.7
6.7
6.6
3.6
7.0
6.4
4.0
2.8
3.0
6.3
2.5
2.5
6.0
2.0
5.0
4.7
5.0
-
4.0
(2.0)
3.0
(4.0)
(2.7)
Source: CSO, Angel Research
Source: MOSPI, Angel Research
Exhibit 3: Monthly CPI inflation trends
Exhibit 4: Manufacturing and services PMI
(%)
56.0
Mfg. PMI
Services PMI
6.0
5.4
5.3
5.4
54.0
5.2
5.0
4.9
4.6
5.0
4.3
4.4
52.0
3.7
3.7
4.0
3.3
50.0
3.0
2.0
48.0
1.0
46.0
-
44.0
Source: Market, Angel Research; Note: Level above 50 indicates expansion
Source: MOSPI, Angel Research
Exhibit 5: Exports and imports growth trends
Exhibit 6: Key policy rates
(%)
Exports yoy growth
Imports yoy growth
(%)
Repo rate
Reverse Repo rate
CRR
30.0
9.00
20.0
8.00
10.0
7.00
0.0
6.00
(10.0)
5.00
(20.0)
4.00
(30.0)
3.00
Source: Bloomberg, Angel Research
Source: RBI, Angel Research
Market Outlook
October 21, 2015
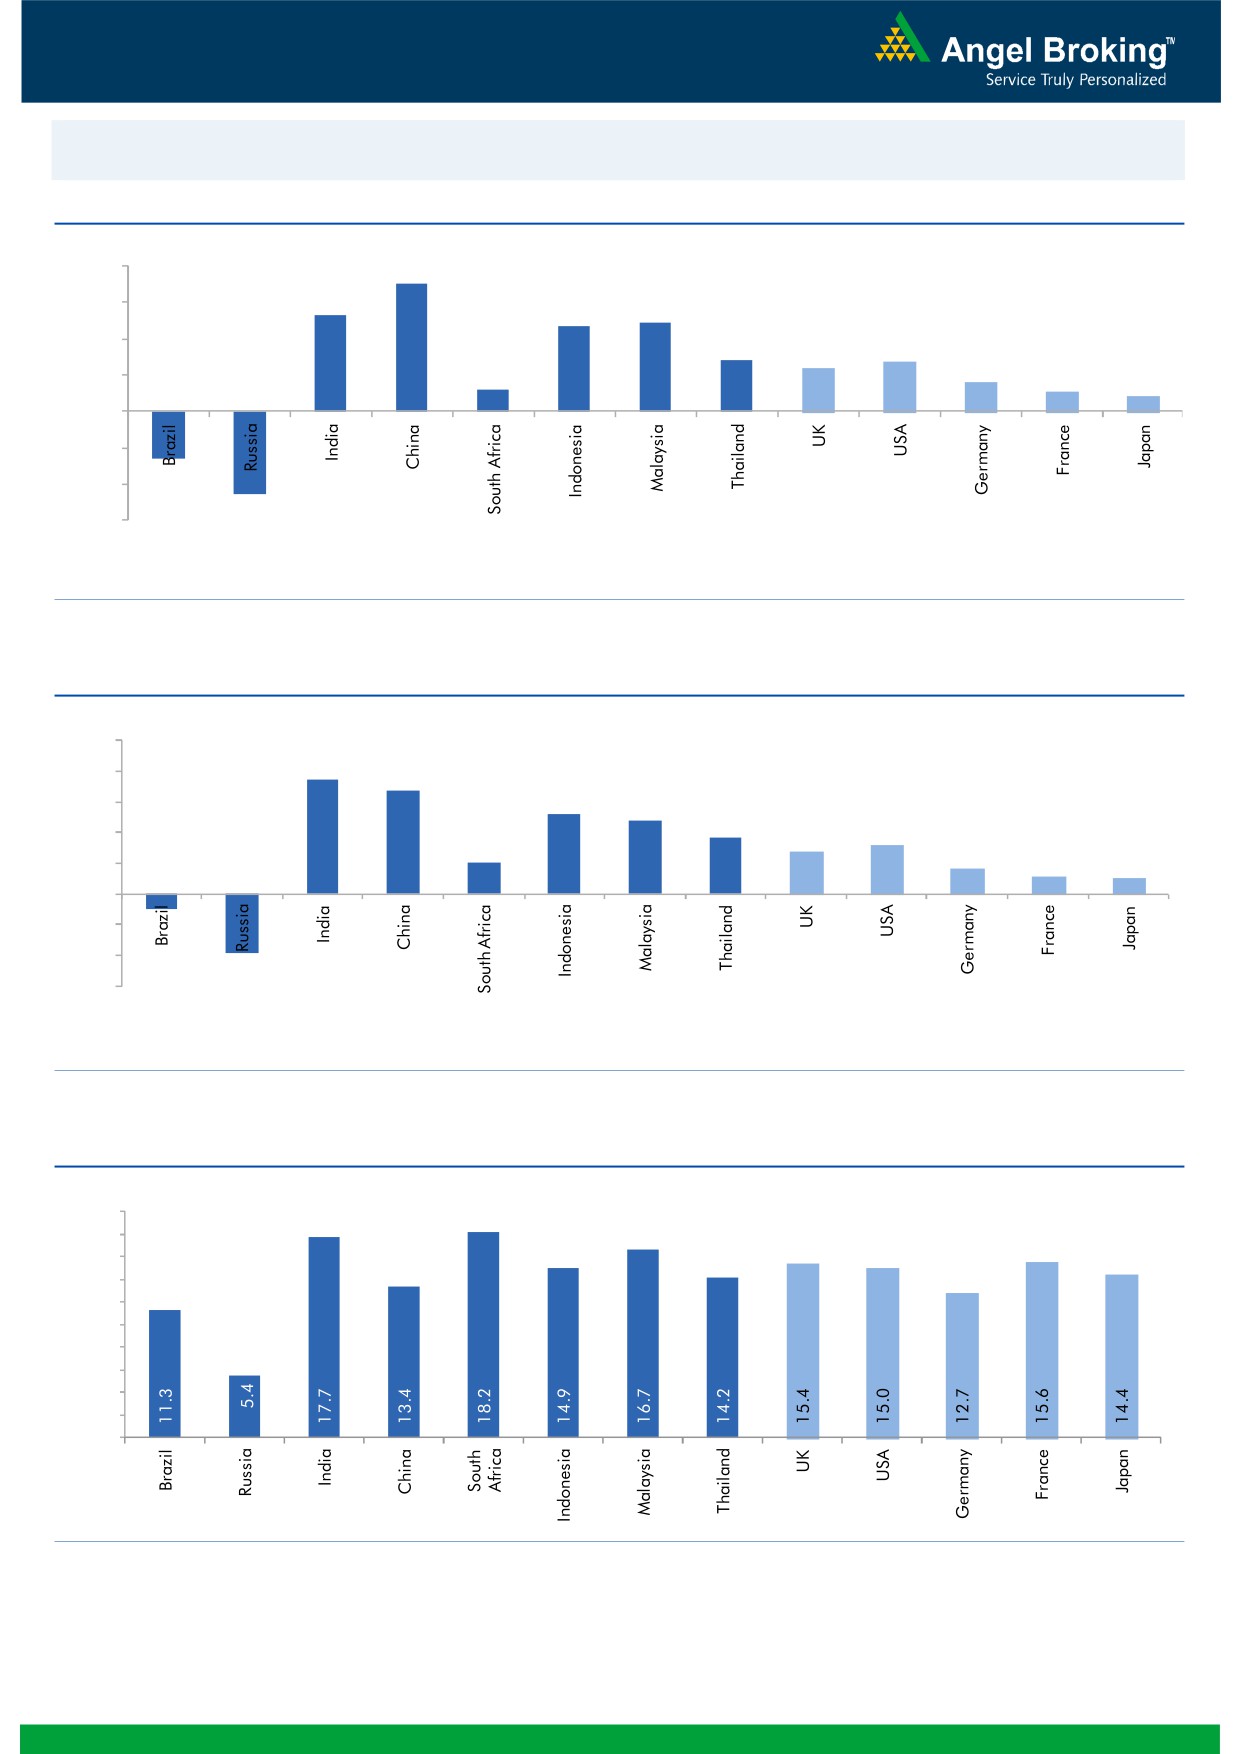
Global watch
Exhibit 1: Latest quarterly GDP Growth (%, yoy) across select developing and developed countries
(%)
8.0
7.0
6.0
5.3
4.9
4.7
4.0
2.8
2.7
2.4
1.6
2.0
1.2
1.1
0.8
-
(2.0)
(2.6)
(4.0)
(4.6)
(6.0)
Source: Bloomberg, Angel Research
Exhibit 2: 2015 GDP Growth projection by IMF (%, yoy) across select developing and developed countries
(%)
10.0
7.5
8.0
6.8
5.2
6.0
4.8
3.7
3.1
4.0
2.7
2.0
1.6
1.2
1.0
2.0
-
(2.0)
(4.0)
(1.0)
(3.8)
(6.0)
Source: IMF, Angel Research
Exhibit 3: One year forward P-E ratio across select developing and developed countries
(x)
20.0
18.0
16.0
14.0
12.0
10.0
8.0
6.0
4.0
2.0
-
Source: IMF, Angel Research
Market Outlook
October 21, 2015
Exhibit 4: Relative performance of indices across globe
Returns (%)
Country
Name of index
Closing price
1M
3M
1YR
Brazil
Bovespa
47,077
(3.0)
(8.8)
(18.9)
Russia
Micex
1,723
0.7
5.3
24.4
India
Nifty
8,262
5.5
(4.0)
5.1
China
Shanghai Composite
3,425
9.8
(12.9)
44.0
South Africa
Top 40
47,410
2.8
0.0
10.9
Mexico
Mexbol
44,654
2.5
(1.6)
3.3
Indonesia
LQ45
789
7.5
(5.1)
(3.8)
Malaysia
KLCI
1,705
3.5
(1.3)
(5.1)
Thailand
SET 50
916
1.4
(5.0)
(11.0)
USA
Dow Jones
17,217
5.1
(3.9)
3.6
UK
FTSE
6,345
3.9
(6.3)
(0.9)
Japan
Nikkei
18,207
1.3
(11.0)
16.7
Germany
DAX
10,148
2.3
(11.9)
14.2
France
CAC
4,674
3.0
(8.0)
13.2
Source: Bloomberg, Angel Research
Stock Watch
October 21, 2015
Company Name
Reco
CMP
Target
Mkt Cap
Sales ( Čcr )
OPM(%)
EPS (Č)
PER(x)
P/BV(x)
RoE(%)
EV/Sales(x)
(Č)
Price ( Č)
( Č cr )
FY16E FY17E
FY16E
FY17E
FY16E
FY17E
FY16E
FY17E
FY16E
FY17E
FY16E
FY17E
FY16E
FY17E
Agri / Agri Chemical
Rallis
Neutral
213
-
4,146
2,075
2,394
14.4
14.4
9.5
11.0
22.4
19.4
4.5
3.9
21.1
21.3
2.0
1.8
United Phosphorus
Accumulate
482
510
20,648
13,698
15,752
17.6
17.6
32.1
38.5
15.0
12.5
2.9
2.4
21.4
21.3
1.6
1.3
Auto & Auto Ancillary
Ashok Leyland
Accumulate
96
102
27,320
18,763
22,357
11.1
11.2
3.6
4.8
26.7
20.0
4.9
4.5
18.7
22.6
1.4
1.2
Bajaj Auto
Neutral
2,438
-
70,556
23,544
27,245
19.8
19.8
127.0
143.4
19.2
17.0
5.8
5.0
30.3
29.4
2.6
2.2
Eicher Motors
Buy
18,161
22,859
49,294
11,681
15,550
15.3
16.9
358.5
564.3
50.7
32.2
15.2
11.3
29.8
34.9
4.1
3.1
Hero Motocorp
Neutral
2,605
-
52,020
28,500
32,764
14.1
14.3
146.9
167.0
17.7
15.6
6.7
5.7
37.8
36.5
1.7
1.4
L G Balakrishnan & Bros Neutral
486
-
763
1,254
1,394
11.6
11.8
35.9
41.7
13.6
11.7
1.8
1.6
13.5
13.8
0.7
0.6
Mahindra and Mahindra Accumulate
1,251
1,357
77,696
37,986
42,660
12.8
13.2
51.6
61.9
24.2
20.2
3.6
3.2
14.6
15.6
1.7
1.4
Maruti
Accumulate
4,511
4,960
136,258
58,102
68,587
16.7
16.9
182.0
225.5
24.8
20.0
4.9
4.2
19.9
21.0
2.1
1.7
Minda Industries
Buy
510
652
810
2,567
2,965
7.3
8.0
38.8
54.3
13.2
9.4
1.9
1.6
14.4
16.8
0.4
0.3
Rane Brake Lining
Accumulate
320
366
253
454
511
11.1
11.4
23.8
28.1
13.4
11.4
1.9
1.7
14.2
15.3
0.7
0.6
Setco Automotive
Neutral
230
-
615
594
741
12.7
13.7
8.4
15.8
27.4
14.6
2.8
2.5
10.4
16.9
1.5
1.2
Tata Motors
Accumulate
383
424
110,580
264,038
297,882
13.8
13.9
34.5
38.9
11.1
9.9
1.9
1.6
17.6
16.8
0.6
0.6
TVS Motor
Neutral
246
-
11,680
11,702
13,713
6.8
7.7
10.1
14.5
24.3
17.0
6.0
4.8
24.5
28.3
1.0
0.8
Amara Raja Batteries
Neutral
1,023
-
17,482
5,101
6,224
17.8
17.6
31.1
39.2
32.9
26.1
8.2
6.5
24.8
24.8
3.4
2.7
Exide Industries
Neutral
155
-
13,205
7,363
8,247
13.7
14.5
6.6
7.7
23.5
20.2
3.0
2.7
12.6
13.3
1.5
1.4
Apollo Tyres
Neutral
195
-
9,901
12,576
12,978
16.8
16.1
22.3
19.9
8.7
9.8
1.5
1.3
17.2
13.4
0.9
0.9
Ceat
Neutral
1,265
-
5,117
6,041
6,597
14.3
14.2
101.5
116.6
12.5
10.9
2.5
2.1
20.0
19.1
1.0
0.9
JK Tyres
Neutral
109
-
2,467
7,446
7,669
15.2
14.0
19.6
18.4
5.6
5.9
1.4
1.2
25.2
19.5
0.7
0.6
Swaraj Engines
Neutral
910
-
1,130
552
630
14.2
14.7
44.6
54.1
20.4
16.8
4.7
4.3
23.2
25.6
1.9
1.6
Subros
Neutral
89
-
535
1,268
1,488
11.6
11.9
3.7
6.6
24.1
13.5
1.6
1.5
6.8
11.4
0.7
0.6
Indag Rubber
Neutral
184
-
482
283
329
17.0
17.2
13.0
15.4
14.2
11.9
3.1
2.6
21.8
21.6
1.4
1.2
Capital Goods
ACE
Neutral
45
-
447
660
839
4.7
8.2
1.0
3.9
45.2
11.6
1.4
1.3
3.2
11.3
0.8
0.7
BEML
Neutral
1,241
-
5,166
3,277
4,006
6.0
8.9
29.2
64.3
42.5
19.3
2.4
2.2
5.7
11.7
1.7
1.3
BGR Energy
Neutral
122
-
883
3,615
3,181
9.5
9.4
16.7
12.4
7.3
9.9
0.7
0.7
10.0
7.0
0.7
0.8
BHEL
Neutral
212
-
51,889
33,722
35,272
10.8
11.7
10.5
14.2
20.2
14.9
1.5
1.4
7.0
9.0
1.6
1.5
Blue Star
Accumulate
356
387
3,205
3,649
4,209
5.0
5.9
9.2
14.7
39.0
24.2
7.0
6.6
9.1
17.5
1.0
0.8
Crompton Greaves
Accumulate
186
204
11,642
13,484
14,687
4.9
6.2
4.5
7.1
41.3
26.2
2.9
2.7
7.2
10.8
1.0
0.9
Inox Wind
Buy
402
505
8,924
4,980
5,943
17.0
17.5
26.6
31.6
15.1
12.7
4.5
3.3
35.0
30.0
1.9
1.6
Stock Watch
October 21, 2015
Company Name
Reco
CMP
Target
Mkt Cap
Sales ( Čcr )
OPM(%)
EPS (Č)
PER(x)
P/BV(x)
RoE(%)
EV/Sales(x)
(Č)
Price ( Č)
( Č cr )
FY16E
FY17E
FY16E
FY17E
FY16E
FY17E
FY16E
FY17E
FY16E
FY17E
FY16E
FY17E
FY16E
FY17E
Capital Goods
KEC International
Neutral
144
-
3,705
8,791
9,716
6.1
6.8
5.4
8.2
26.7
17.6
2.7
2.4
10.0
14.0
0.6
0.6
Thermax
Neutral
872
-
10,392
6,413
7,525
7.4
8.5
30.5
39.3
28.6
22.2
4.4
3.8
15.0
17.0
1.6
1.3
Cement
ACC
Accumulate
1,382
1,548
25,948
11,856
14,092
14.5
17.8
47.6
76.1
29.0
18.2
3.0
2.7
10.6
15.7
2.0
1.7
Ambuja Cements
Accumulate
210
233
32,574
10,569
12,022
20.7
22.2
8.7
10.7
24.1
19.6
3.1
2.9
13.0
15.2
2.7
2.3
India Cements
Buy
83
112
2,562
4,716
5,133
15.9
16.9
3.7
7.5
22.5
11.1
0.8
0.8
3.8
7.3
0.8
0.7
JK Cement
Buy
651
767
4,548
4,056
4,748
14.5
17.0
22.6
41.1
28.8
15.8
2.6
2.3
9.3
15.3
1.6
1.3
J K Lakshmi Cement
Accumulate
380
430
4,470
2,947
3,616
16.7
19.9
11.5
27.2
33.0
14.0
3.1
2.7
9.8
20.8
1.9
1.5
Mangalam Cements
Neutral
230
-
615
1,053
1,347
10.5
13.3
8.4
26.0
27.4
8.9
1.2
1.1
4.3
12.5
1.0
0.7
Orient Cement
Accumulate
173
183
3,548
1,854
2,524
21.2
22.2
7.7
11.1
22.5
15.6
3.2
2.8
13.3
15.7
2.7
1.9
Ramco Cements
Neutral
343
-
8,160
4,036
4,545
20.8
21.3
15.1
18.8
22.7
18.2
2.8
2.5
12.9
14.3
2.5
2.2
Shree Cement^
Neutral
12,819
-
44,656
7,150
8,742
26.7
28.6
228.0
345.5
56.2
37.1
8.3
6.9
15.7
20.3
6.0
4.8
UltraTech Cement
Accumulate
2,915
3,282
79,984
27,562
31,548
20.4
22.3
111.9
143.3
26.1
20.3
3.7
3.2
15.2
16.8
3.0
2.5
Construction
ITNL
Neutral
94
-
3,082
7,360
8,825
34.0
35.9
1.0
5.0
93.7
18.7
0.4
0.4
0.3
1.4
3.9
3.7
KNR Constructions
Neutral
604
-
1,699
915
1,479
14.3
13.9
20.3
37.2
29.8
16.2
2.7
2.4
9.6
15.6
2.0
1.3
Larsen & Toubro
Buy
1,573
2,013
146,388
68,920
82,446
10.9
11.5
57.0
73.0
27.6
21.6
2.5
2.4
13.6
15.5
2.3
1.9
Gujarat Pipavav Port
Neutral
186
-
8,997
721
784
53.1
53.6
8.2
9.1
22.6
20.5
3.6
3.0
20.0
18.3
12.0
10.7
MBL Infrastructures
Buy
225
360
932
2,313
2,797
12.2
14.6
19.0
20.0
11.8
11.2
1.2
1.1
11.3
10.6
1.1
1.0
Nagarjuna Const.
Neutral
82
-
4,573
7,892
8,842
8.3
9.1
2.4
5.3
34.3
15.5
1.4
1.3
4.2
8.6
0.8
0.7
PNC Infratech
Neutral
513
-
2,633
1,798
2,132
13.2
13.5
22.0
30.0
23.3
17.1
2.1
1.9
11.5
11.4
1.6
1.3
Simplex Infra
Neutral
343
-
1,695
6,241
7,008
10.4
10.7
20.0
36.0
17.1
9.5
1.4
1.3
6.8
11.1
0.8
0.7
Financials
Allahabad Bank
Neutral
80
-
4,792
8,438
9,521
2.8
2.8
21.9
27.0
3.6
3.0
0.4
0.3
10.2
11.5
-
-
Axis Bank
Buy
509
674
120,962
26,941
32,298
3.5
3.6
37.4
46.4
13.6
11.0
2.8
2.4
18.7
20.0
-
-
Bank of Baroda
Neutral
176
-
40,611
19,027
21,737
1.9
2.0
16.9
24.5
10.4
7.2
1.0
0.9
9.1
12.1
-
-
Bank of India
Neutral
142
-
11,277
16,438
18,706
1.9
2.0
19.2
40.9
7.4
3.5
0.4
0.4
4.5
9.1
-
-
Canara Bank
Neutral
300
-
16,314
15,491
17,269
2.0
2.0
61.6
70.9
4.9
4.2
0.6
0.5
10.5
11.1
-
-
Dena Bank
Neutral
43
-
2,742
3,498
3,977
2.1
2.3
7.8
10.7
5.5
4.0
0.4
0.4
6.5
8.4
-
-
Federal Bank
Neutral
65
-
11,225
3,527
4,135
3.0
3.1
5.2
6.7
12.6
9.8
1.3
1.2
10.8
12.7
-
-
HDFC
Neutral
1,313
-
207,094
10,883
12,799
3.5
3.4
43.0
50.6
30.6
25.9
6.1
5.5
25.9
26.7
-
-
HDFC Bank
Buy
1,095
1,265
275,780
38,059
46,851
4.4
4.5
50.0
62.7
21.9
17.5
3.8
3.3
18.8
20.2
-
-
Stock Watch
October 21, 2015
Company Name
Reco
CMP
Target
Mkt Cap
Sales ( Čcr )
OPM(%)
EPS (Č)
PER(x)
P/BV(x)
RoE(%)
EV/Sales(x)
(Č)
Price ( Č)
( Č cr )
FY16E
FY17E
FY16E
FY17E
FY16E
FY17E
FY16E
FY17E
FY16E
FY17E
FY16E
FY17E
FY16E
FY17E
Financials
ICICI Bank
Buy
286
370
166,187
35,810
41,871
3.4
3.5
22.0
26.2
13.0
10.9
2.3
1.9
15.0
15.6
-
-
IDBI Bank
Neutral
85
-
13,634
9,860
10,978
1.8
1.9
9.3
15.6
9.2
5.5
0.6
0.6
6.4
10.1
-
-
Indian Bank
Neutral
137
-
6,563
6,267
7,171
2.4
2.5
25.4
32.1
5.4
4.3
0.4
0.4
8.0
9.3
-
-
LIC Housing Finance
Buy
473
570
23,878
2,934
3,511
2.3
2.3
30.9
36.8
15.3
12.9
2.5
2.1
16.8
17.5
-
-
Oriental Bank
Neutral
145
-
4,339
7,730
8,595
2.4
2.5
38.8
47.4
3.7
3.1
0.3
0.3
8.6
9.8
-
-
Punjab Natl.Bank
Neutral
138
-
27,117
23,446
26,624
2.8
2.9
17.8
27.5
7.8
5.0
0.8
0.6
8.5
12.1
-
-
South Ind.Bank
Neutral
22
-
3,031
1,930
2,215
2.4
2.4
2.6
3.6
8.6
6.2
0.9
0.8
9.9
12.5
-
-
St Bk of India
Buy
254
295
197,524
83,847
96,307
2.8
2.8
20.1
25.1
12.7
10.1
1.4
1.2
11.5
13.1
-
-
Union Bank
Neutral
174
-
11,968
12,755
14,439
2.3
2.4
31.5
39.9
5.5
4.4
0.6
0.5
9.9
11.6
-
-
Vijaya Bank
Neutral
38
-
3,243
3,594
3,969
1.8
1.9
5.8
7.1
6.5
5.3
0.6
0.5
8.2
9.3
-
-
Yes Bank
Buy
770
906
32,267
7,204
9,078
3.2
3.2
57.8
69.5
13.3
11.1
2.4
2.0
19.6
22.6
-
-
FMCG
Asian Paints
Neutral
875
-
83,896
16,553
19,160
16.0
16.2
17.7
21.5
49.5
40.7
13.1
11.8
29.4
31.2
4.9
4.2
Britannia
Neutral
3,298
-
39,570
8,065
9,395
9.6
10.2
47.2
65.5
69.9
50.4
23.2
21.9
38.3
41.2
4.8
4.1
Colgate
Neutral
939
-
25,544
4,836
5,490
19.5
19.7
48.5
53.2
19.4
17.7
14.2
12.4
99.8
97.5
5.2
4.6
Dabur India
Neutral
271
-
47,619
9,370
10,265
17.1
17.2
7.3
8.1
37.0
33.5
11.2
9.1
33.7
30.6
5.0
4.6
GlaxoSmith Con*
Neutral
6,025
-
25,337
4,919
5,742
17.2
17.4
168.3
191.2
35.8
31.5
10.2
8.6
28.8
28.9
4.7
4.0
Godrej Consumer
Neutral
1,236
-
42,081
10,168
12,886
16.1
16.1
32.1
38.4
38.5
32.2
7.8
7.2
19.7
21.0
4.2
3.3
HUL
Neutral
787
-
170,372
34,940
38,957
17.5
17.7
20.8
24.7
37.9
31.9
42.1
33.7
110.5
114.2
4.7
4.2
ITC
Buy
348
409
279,242
41,068
45,068
37.8
37.4
13.9
15.9
25.0
21.9
8.4
7.4
34.1
33.8
6.4
5.8
Marico
Neutral
395
-
25,478
6,551
7,766
15.7
16.0
10.4
12.5
38.1
31.6
11.0
9.2
33.2
32.4
3.8
3.2
Nestle*
Neutral
6,533
-
62,992
11,291
12,847
22.2
22.3
158.9
184.6
41.1
35.4
21.5
19.3
55.0
57.3
5.4
4.7
Tata Global
Neutral
139
-
8,791
8,635
9,072
9.8
9.9
6.5
7.6
21.5
18.3
2.1
2.1
6.8
7.4
1.0
0.9
IT
HCL Tech^
Buy
865
1,132
121,634
42,038
47,503
23.5
23.5
56.4
62.9
15.3
13.8
3.6
2.7
23.2
19.8
2.5
2.0
Infosys
Buy
1,125
1,306
258,487
60,250
66,999
28.0
28.0
58.3
63.7
19.3
17.7
4.1
3.5
20.9
19.7
3.6
3.1
TCS
Buy
2,527
3,165
497,868
111,274
126,852
28.4
28.7
125.4
143.9
20.2
17.6
8.0
7.4
39.9
42.2
4.1
3.5
Tech Mahindra
Buy
547
646
52,649
25,566
28,890
16.0
17.0
26.3
31.9
20.8
17.2
3.7
3.2
17.9
18.6
1.8
1.6
Wipro
Buy
572
719
141,266
52,414
58,704
23.7
23.8
38.4
42.3
14.9
13.5
2.9
2.6
19.5
18.0
2.3
1.9
Media
D B Corp
Accumulate
317
356
5,814
2,241
2,495
27.8
27.9
21.8
25.6
14.5
12.4
3.8
3.4
26.7
28.5
2.5
2.3
HT Media
Neutral
93
-
2,173
2,495
2,603
11.2
11.2
7.3
8.6
12.8
10.9
1.0
0.9
7.4
8.1
0.4
0.4
Stock Watch
October 21, 2015
Company Name
Reco
CMP
Target
Mkt Cap
Sales ( Čcr )
OPM(%)
EPS (Č)
PER(x)
P/BV(x)
RoE(%)
EV/Sales(x)
(Č)
Price ( Č)
( Č cr )
FY16E FY17E
FY16E
FY17E
FY16E
FY17E
FY16E
FY17E
FY16E
FY17E
FY16E
FY17E
FY16E
FY17E
Media
Jagran Prakashan
Accumulate
144
156
4,711
1,939
2,122
26.0
26.0
8.3
9.2
17.4
15.7
3.0
2.7
17.5
17.1
2.4
2.2
Sun TV Network
Neutral
375
-
14,764
2,779
3,196
70.2
70.5
22.8
27.3
16.4
13.7
4.1
3.7
26.7
28.3
5.1
4.4
Hindustan Media
Accumulate
273
292
2,003
920
1,031
20.0
20.0
19.2
20.9
14.2
13.1
2.3
2.0
16.4
15.3
1.7
1.5
Ventures
Metals & Mining
Coal India
Buy
335
400
211,535
72,015
78,415
21.2
21.5
21.7
25.3
15.4
13.3
5.2
5.2
33.1
39.1
2.2
2.0
Hind. Zinc
Neutral
159
-
67,225
15,258
16,495
44.2
45.6
17.6
19.2
9.0
8.3
1.4
1.3
15.9
15.3
2.1
1.6
Hindalco
Neutral
84
-
17,428
104,356
111,186
8.7
9.5
6.7
11.1
12.6
7.6
0.5
0.4
3.5
5.9
0.7
0.6
JSW Steel
Neutral
894
-
21,603
48,125
53,595
18.8
21.0
46.9
97.5
19.1
9.2
0.9
0.9
4.4
9.5
1.3
1.1
NMDC
Neutral
102
-
40,242
8,237
10,893
46.6
44.5
10.0
11.7
10.2
8.7
1.1
1.0
12.5
13.0
4.7
3.6
SAIL
Neutral
55
-
22,819
45,915
53,954
7.2
10.5
1.5
4.4
36.7
12.6
0.5
0.5
2.3
4.1
1.1
1.0
Vedanta
Neutral
101
-
30,018
71,445
81,910
26.2
26.3
12.9
19.2
7.9
5.3
0.6
0.5
7.2
8.9
0.9
0.7
Tata Steel
Neutral
241
-
23,387
136,805
149,228
11.3
11.9
26.4
36.8
9.1
6.5
0.7
0.7
6.0
8.0
0.7
0.6
Oil & Gas
Cairn India
Neutral
154
-
28,863
11,323
12,490
49.4
51.0
20.7
20.7
7.4
7.5
0.5
0.5
6.4
6.1
1.6
1.0
GAIL
Neutral
326
-
41,365
64,856
70,933
9.1
9.6
24.0
28.9
13.6
11.3
1.2
1.1
8.8
9.6
0.8
0.7
ONGC
Neutral
253
-
216,539
154,564
167,321
36.8
37.4
28.6
32.5
8.9
7.8
1.1
1.0
12.7
13.5
1.6
1.5
Petronet LNG
Accumulate
192
210
14,393
39,007
40,785
3.8
4.2
9.2
11.0
21.0
17.5
2.3
2.1
11.6
12.7
0.4
0.4
Indian Oil Corp
Accumulate
402
455
97,713
359,607
402,760
5.9
6.1
42.5
48.7
9.5
8.3
1.3
1.1
14.1
14.4
0.4
0.3
Reliance Industries
Neutral
955
-
309,416
313,085
362,904
13.1
13.8
78.4
92.9
12.2
10.3
1.3
1.2
10.8
11.6
1.4
1.3
Pharmaceuticals
Alembic Pharma
Neutral
722
-
13,615
2,601
3,115
21.2
20.2
20.8
23.9
34.7
30.2
11.2
8.4
37.2
31.8
5.3
4.3
Aurobindo Pharma
Accumulate
811
872
47,380
14,923
17,162
23.0
23.0
38.2
43.6
21.2
18.6
6.5
4.9
36.0
30.2
3.5
3.0
Aventis*
Neutral
4,010
-
9,234
2,156
2,455
15.1
16.8
109.7
133.9
36.6
29.9
5.0
4.1
18.4
22.5
4.0
3.3
Cadila Healthcare
Neutral
432
-
44,267
10,224
11,840
20.0
21.0
71.0
85.6
6.1
5.1
1.6
1.3
30.1
28.5
4.4
3.7
Cipla
Neutral
672
-
54,005
14,359
16,884
21.3
19.7
28.4
30.5
23.7
22.1
4.2
3.6
19.3
17.5
3.8
3.1
Dr Reddy's
Neutral
4,315
-
73,583
18,213
21,214
22.6
22.7
163.0
192.5
26.5
22.4
5.4
4.5
22.5
20.0
4.0
3.4
Dishman Pharma
Neutral
368
-
2,972
1,716
1,888
20.2
20.2
16.3
21.6
22.6
17.1
2.1
1.9
9.7
11.7
1.9
1.6
GSK Pharma*
Neutral
3,299
-
27,945
2,870
3,158
20.0
22.1
59.5
68.3
55.5
48.3
16.4
16.8
28.5
34.3
9.2
8.4
Indoco Remedies
Neutral
327
-
3,016
1,088
1,262
18.2
18.2
13.1
15.5
25.0
21.1
4.9
4.1
21.2
21.1
2.8
2.4
Ipca labs
Accumulate
754
800
9,511
3,507
4,078
17.6
18.6
25.8
32.0
29.2
23.6
3.8
3.3
13.8
14.9
3.0
2.5
Lupin
Neutral
2,075
-
93,413
14,864
17,244
26.9
26.9
62.1
71.1
33.4
29.2
8.1
6.4
27.4
24.6
6.0
5.1
Sun Pharma
Accumulate
902
950
216,988
28,163
32,610
25.8
30.7
17.4
26.9
51.8
33.5
4.9
4.3
13.0
16.6
7.2
6.0
Stock Watch
October 21, 2015
Company Name
Reco
CMP
Target
Mkt Cap
Sales ( Čcr )
OPM(%)
EPS (Č)
PER(x)
P/BV(x)
RoE(%)
EV/Sales(x)
(Č)
Price ( Č)
( Č cr )
FY16E FY17E
FY16E
FY17E
FY16E
FY17E
FY16E
FY17E
FY16E
FY17E
FY16E
FY17E
FY16E
FY17E
Power
Tata Power
Neutral
71
-
19,176
35,923
37,402
22.6
22.8
4.1
5.2
17.5
13.8
1.3
1.3
7.5
9.3
1.5
1.4
NTPC
Buy
128
157
105,377
87,064
98,846
23.5
23.5
11.7
13.2
10.9
9.7
1.2
1.1
11.4
12.1
2.2
2.0
Power Grid
Buy
136
170
71,228
20,702
23,361
86.7
86.4
12.1
13.2
11.3
10.3
1.7
1.5
15.6
15.1
8.4
7.8
Telecom
Bharti Airtel
Neutral
362
-
144,586
101,748
109,191
32.1
31.7
12.0
12.5
30.1
28.9
2.1
1.9
6.9
6.7
2.1
1.9
Idea Cellular
Neutral
151
-
54,480
34,282
36,941
32.0
31.5
5.9
6.2
25.7
24.4
2.4
2.1
9.9
9.3
2.2
2.0
zOthers
Abbott India
Neutral
5,549
-
11,792
2,715
3,153
14.5
14.1
134.3
152.2
41.3
36.5
10.3
8.5
27.4
25.6
4.1
3.4
Bajaj Electricals
Buy
254
341
2,564
4,719
5,287
5.2
5.8
8.6
12.7
29.7
20.1
3.4
3.0
11.4
14.8
0.5
0.5
Finolex Cables
Neutral
249
-
3,804
2,728
3,036
10.8
11.0
14.4
16.8
17.3
14.9
2.6
2.3
15.2
15.3
1.1
1.0
Goodyear India*
Buy
566
655
1,306
1,953
1,766
12.4
12.0
67.4
59.6
8.4
9.5
2.1
1.8
27.7
20.2
0.4
0.4
Hitachi
Neutral
1,493
-
4,061
1,806
2,112
9.0
9.2
28.6
29.1
52.2
51.4
13.0
10.5
28.1
22.6
2.3
2.0
Jyothy Laboratories
Neutral
314
-
5,687
1,620
1,847
11.5
11.5
7.3
8.5
43.1
37.1
5.6
5.2
13.3
14.4
3.4
2.9
MRF
Neutral
42,081
-
17,847
20,727
14,841
19.3
18.6
4,905.8
3,351.9
8.6
12.6
2.7
2.2
37.6
19.6
0.8
1.1
Page Industries
Neutral
14,329
-
15,982
1,929
2,450
19.8
20.1
229.9
299.0
62.3
47.9
27.5
19.1
52.1
47.1
8.3
6.5
Relaxo Footwears
Neutral
536
-
6,437
1,767
2,152
12.3
12.5
19.3
25.1
27.9
21.4
6.8
5.3
27.7
27.8
3.7
3.0
Siyaram Silk Mills
Buy
961
1,221
901
1,653
1,873
11.7
12.2
99.3
122.1
9.7
7.9
1.7
1.5
19.5
20.2
0.7
0.6
Styrolution ABS India*
Neutral
818
-
1,438
1,271
1,440
8.6
9.2
32.0
41.1
25.5
19.9
2.6
2.3
10.7
12.4
1.1
1.0
Tree House
Buy
293
449
1,241
259
324
56.8
56.8
17.0
21.7
17.2
13.5
1.7
1.6
10.1
11.5
4.7
3.9
TVS Srichakra
Accumulate
2,981
3,210
2,283
2,127
2,388
15.2
14.9
237.7
267.5
12.5
11.1
5.3
3.8
51.7
39.8
1.1
1.0
HSIL
Neutral
308
-
2,225
2,182
2,404
16.3
16.5
15.8
18.9
19.5
16.3
1.6
1.5
8.4
9.4
1.4
1.2
Kirloskar Engines India
Accumulate
279
297
4,041
2,634
3,252
10.1
12.0
10.9
17.4
25.6
16.0
2.9
2.6
11.4
16.8
1.2
0.9
Ltd
M M Forgings
Buy
555
797
669
563
671
22.1
22.9
51.0
66.5
10.9
8.4
2.3
1.8
23.1
24.1
1.4
1.1
Banco Products (India)
Neutral
136
-
975
1,208
1,353
11.0
12.3
10.8
14.5
12.7
9.4
1.5
1.3
11.9
14.5
0.8
0.7
Competent Automobiles Neutral
159
-
97
1,007
1,114
3.1
3.1
23.7
28.2
6.7
5.6
0.9
0.8
13.9
14.6
0.1
0.1
Nilkamal
Neutral
975
-
1,455
1,948
2,147
10.6
10.3
60.0
67.0
16.2
14.6
2.5
2.2
16.8
16.1
0.8
0.7
Visaka Industries
Accumulate
150
166
238
1,158
1,272
8.6
9.5
23.7
32.7
6.3
4.6
0.6
0.6
10.1
12.5
0.4
0.3
Transport Corporation of
Neutral
297
-
2,259
2,830
3,350
8.8
9.0
14.4
18.3
20.7
16.2
3.2
2.8
15.4
17.1
0.9
0.8
India
Elecon Engineering
Accumulate
79
87
856
1,452
1,596
14.0
14.7
4.4
6.2
17.8
12.6
1.5
1.3
8.6
11.2
0.9
0.8
Surya Roshni
Buy
144
183
631
2,992
3,223
8.3
8.5
14.7
18.3
9.8
7.9
0.9
0.8
9.8
11.0
0.5
0.5
MT Educare
Buy
144
169
574
286
366
18.3
17.7
7.7
9.4
18.7
15.4
3.9
3.4
20.2
21.1
1.9
1.4
Stock Watch
October 21, 2015
Company Name
Reco
CMP
Target Mkt Cap
Sales ( Čcr )
OPM(%)
EPS (Č)
PER(x)
P/BV(x)
RoE(%)
EV/Sales(x)
(Č)
Price ( Č)
( Č cr )
FY16E FY17E FY16E FY17E FY16E FY17E FY16E FY17E FY16E FY17E FY16E FY17E FY16E FY17E
zOthers
Radico Khaitan
Accumulate
100
112
1,325
1,565
1,687
11.9
12.4
5.4
6.6
18.4
15.1
1.5
1.4
8.0
9.0
1.3
1.3
Garware Wall Ropes
Accumulate
357
390
781
875
983
10.4
10.6
23.1
27.8
15.5
12.8
2.2
1.9
14.1
14.8
0.9
0.8
Wonderla Holidays
Accumulate
301
322
1,698
206
308
44.0
43.6
9.0
12.9
33.4
23.3
4.6
4.1
13.7
17.8
8.1
5.4
Linc Pen & Plastics
Accumulate
165
185
244
340
371
8.3
8.9
10.8
13.2
15.3
12.5
2.4
2.1
16.0
17.1
0.8
0.7
The Byke Hospitality
Accumulate
159
181
637
222
287
20.5
20.5
5.6
7.6
28.2
21.0
5.3
4.4
18.9
20.8
2.9
2.2
Source: Company, Angel Research; Note: *December year end; #September year end; &October year end; Price as on October 20, 2015
Market Outlook
October 21, 2015
Research Team Tel: 022 - 39357800
DISCLAIMER
Angel Broking Private Limited (hereinafter referred to as “Angel”) is a registered Member of National Stock Exchange of India Limited,
Bombay Stock Exchange Limited and Metropolitian Stock Exchange of India Limited. It is also registered as a Depository Participant with
CDSL and Portfolio Manager with SEBI. It also has registration with AMFI as a Mutual Fund Distributor. Angel Broking Private Limited is a
registered entity with SEBI for Research Analyst in terms of SEBI (Research Analyst) Regulations, 2014 vide registration number
INH000000164. Angel or its associates has not been debarred/ suspended by SEBI or any other regulatory authority for accessing
/dealing in securities Market. Angel or its associates including its relatives/analyst do not hold any financial interest/beneficial ownership
of more than 1% in the company covered by Analyst. Angel or its associates/analyst has not received any compensation / managed or co
-managed public offering of securities of the company covered by Analyst during the past twelve months. Angel/analyst has not served as
an officer, director or employee of company covered by Analyst and has not been engaged in market making activity of the company
covered by Analyst.
This document is solely for the personal information of the recipient, and must not be singularly used as the basis of any investment
decision. Nothing in this document should be construed as investment or financial advice. Each recipient of this document should make
such investigations as they deem necessary to arrive at an independent evaluation of an investment in the securities of the companies
referred to in this document (including the merits and risks involved), and should consult their own advisors to determine the merits and
risks of such an investment.
Reports based on technical and derivative analysis center on studying charts of a stock's price movement, outstanding positions and
trading volume, as opposed to focusing on a company's fundamentals and, as such, may not match with a report on a company's
fundamentals.
The information in this document has been printed on the basis of publicly available information, internal data and other reliable sources
believed to be true, but we do not represent that it is accurate or complete and it should not be relied on as such, as this document is for
general guidance only. Angel Broking Pvt. Limited or any of its affiliates/ group companies shall not be in any way responsible for any
loss or damage that may arise to any person from any inadvertent error in the information contained in this report. Angel Broking Pvt.
Limited has not independently verified all the information contained within this document. Accordingly, we cannot testify, nor make any
representation or warranty, express or implied, to the accuracy, contents or data contained within this document. While Angel Broking
Pvt. Limited endeavors to update on a reasonable basis the information discussed in this material, there may be regulatory, compliance,
or other reasons that prevent us from doing so.
This document is being supplied to you solely for your information, and its contents, information or data may not be reproduced,
redistributed or passed on, directly or indirectly.
Neither Angel Broking Pvt. Limited, nor its directors, employees or affiliates shall be liable for any loss or damage that may arise from or
in connection with the use of this information.
Note: Please refer to the important ‘Stock Holding Disclosure' report on the Angel website (Research Section). Also, please refer to the
latest update on respective stocks for the disclosure status in respect of those stocks. Angel Broking Pvt. Limited and its affiliates may have
investment positions in the stocks recommended in this report.