Market Outlook
July 21, 2016
Market Cues
Domestic Indices
Chg (%)
(Pts)
(Close)
Indian markets are expected to open flat tracking SGX Nifty.
BSE Sensex
0.5
128
27,916
Nifty
0.4
37
8,566
Following the pullback seen in the previous session, stocks moved back to the upside
during trading on Wednesday. The gains on the day lifted the Dow and the S&P 500
Mid Cap
0.9
109
12,181
to new record highs, while the tech-heavy Nasdaq showed an even stronger upward
Small Cap
1.0
118
12,027
move to reach its best levels of 2016.
Bankex
0.3
58
21,727
The European markets ended Wednesday's session in the green, rebounding from
yesterday's weak performance. Solid financial reports from companies like SAP,
Global Indices
Chg (%)
(Pts)
(Close)
Lonza and ASML Holding, as well as Microsoft and Morgan Stanley in the U.S.,
Dow Jones
0.2
36
18,595
provided a boost to investor sentiment.
Nasdaq
1.1
54
5,090
Indian markets rose for a second consecutive session on Wednesday amid increased
FTSE
0.5
32
6,729
buying by foreign investors, as monsoon rains covered the whole county and Bihar
Nikkei
(0.2)
(41)
16,682
Chief Minister and Janata Dal (United) chief Nitish Kumar pledged his support for
the Goods and Services Tax (GST) Bill.
Hang Seng
1.0
209
21,882
Shanghai Com
(0.3)
(9)
3,028
News Analysis
Advances / Declines
BSE
NSE
Aurobindo Pharma: Gets 180-day exclusivity for generic Crestor
Advances
1,673
1,074
Review: DHFL
Declines
1,042
519
Detailed analysis on Pg2
Unchanged
176
81
Investor’s Ready Reckoner
Key Domestic & Global Indicators
Volumes (` Cr)
Stock Watch: Latest investment recommendations on 150+ stocks
BSE
3,196
Refer Pg5 onwards
NSE
19,151
Top Picks
CMP
Target
Upside
Net Inflows (` Cr)
Net
Mtd
Ytd
Company
Sector
Rating
(`)
(`)
(%)
FII
711
5,680
25,223
Amara Raja
Auto/Auto Ancillary
Buy
874
1,076
23.1
MFs
35
(439)
8,906
HCL Tech
IT
Buy
729
1,000
37.1
LIC Housing
Financials
Buy
505
592
17.3
Top Gainers
Price (`)
Chg (%)
Bharat Electronics
Capital Goods
Accumulate
1,250
1,414
13.2
Wockpharma
1,038
12.7
Navkar Corporation Others
Buy
208
265
27.2
More Top Picks on Pg3
Mfsl
560
10.0
Abirlanuvo
1,318
6.0
Key Upcoming Events
Prestige
187
5.8
Previous
Consensus
Date
Region
Event Description
Reading
Expectations
Edelweiss
81
5.5
July 21 Euro Zone
ECB announces interest rates
0.0
-
July 21 US
Initial Jobless claims
254.00
265.00
Top Losers
Price (`)
Chg (%)
July 21 US
Existing home sales
5.53
5.48
Pvr
1,081
(3.0)
July 22 Germany
PMI Services
53.70
53.20
6.(
Jppower
6
(2.5)
More Events on Pg4
Hathway
32
(2.4)
Skfindia
1,379
(2.3)
Dabur
304
(2.2)
As on July 20, 2016
Market Outlook
July 21, 2016
Aurobindo Pharma: Gets 180-day exclusivity for generic Crestor
Company received final approval from US Food & Drug Administration (USFDA) to
manufacture and market Rosuvastatin Calcium tablets 5 mg, 10 mg, 20 mg and
40 mg, a generic equivalent of Crestor tablets, indicated for hyperlipidemia or
mixed dyslipidemia. Rosuvastatin Calcium Tablets is an antihyperlipidemic to
prevent cardiovascular disease. It is used to reduce elevated total-C, LDL-C, ApoB,
non HDL-C, and TG levels and to increase HDL-C in patients with primary
hypercholesterolemia and mixed dyslipidemia.
According to IMS, the approved product has an estimated market size of US$
6.7bn for the twelve months ending May 2016. Aurobindo Pharma said it was one
of the first ANDA applicants to submit a substantially complete ANDA with a
paragraph IV certification; therefore, Aurobindo is eligible for 180 days of generic
drug shared exclusivity. The product is launched in the US market. Along with
Aurobindo Glenmark and Sun Pharmaceuticals, also get the approval to launch
the drug in the market. Though the exact number of generic player expected in the
market during the 180-day exclusivity are not know, we believe that the company
can gross sales of US$150-200mn, in a competitive environment, though upsides
could be higher in case the competition is less than 4-5 players expected. Thus we
maintain our accumulate with a price target of `880.
Result Review
DHFL - BUY CMP -`220 TP-`270
DHFL came out with a decent set of results for the quarter with a PAT growth of
16% YoY AUM grew by 20% YoY. Sanctions for the quarter stood at Rs 8800 cr
growing 12% over same period last year, while disbursal during the quarter stood
at Rs 6215 cr growing by 26% YoY. The company continued to grow its LAP and
developer loan books which has contributed to the growth during the quarter. This
can be reflected from the fact that while the share of Individual loans has gone
down to 71.5% from 72.3% in Q4FY16, the share of LAP has gone up to 16%
from 15.7% and that of developer loans to 9.8% from 9.5% during the same
period. While GNPAs has gone up a tad higher than expected it still is in
comfortable zone. We expect the company will be able to maintain the current
NIM going ahead, which together with healthy loan book growth makes it a good
play on the upswing in housing demand going ahead.
At the CMP of Rs 219 the stock is trading at a valuation of 1x its FY18E Adj Book
Value of Rs 215. While the return ratios of the company are comparable to
midsized NBFCs it is trading at a discount in terms of valuations. We expect the
valuations gap to narrow down gradually. We maintain our rating on the stock
with a target price of Rs 270.
Market Outlook
July 21, 2016
Economic and Political News
Govt says DBT scheme saves ` 21k cr in LPG subsidy in 2 yrs
Restaurant sector to contribute ` 22,400 crore in taxes in 2016
Nabard sanctions `177 cr for Punjab
Corporate News
Tata Steel aims to double Indian workforce's productivity
SKF India Q1 net up 29.89% at `60.4 crore
Telcos invested `4.31 lakh crore in FY15
Quarterly Bloomberg Brokers Consensus Estimate
Hindalco Industries Ltd - July 21, 2016
Particulars (` cr)
1QFY17E 1QFY16 y-o-y (%) 4QFY16
q-o-q (%)
Net sales
8,619
8,517
1.2
8,543
0.9
EBITDA
936
877
6.6
1,166
(19.8)
EBITDA margin
10.9
10.3
13.7
(%)
Net profit
209
107
94.6
356
(41.5)
HDFC Bank Ltd - July 21, 2016
Particulars (` cr)
1QFY17E 1QFY16 y-o-y (%) 4QFY16
q-o-q (%)
Net profit
3,254
2,696
20.7
3,374
(3.6)
Kotak Mahindra Bank Ltd - July 21, 2016
Particulars (` cr)
1QFY17E 1QFY16 y-o-y (%) 4QFY16
q-o-q (%)
Net profit
740
190
289.9
696
6.4
Market Outlook
July 21, 2016
Top Picks ★★★★★
Large Cap
Market Cap
CMP
Target
Upside
Company
Rationale
(` Cr)
(`)
(`)
(%)
To outpace battery industry growth due to better technological
Amara Raja Batteries
14,935
874
1,076
23.1
products leading to market share gains in both the automotive
OEM and replacement segments.
Uptick in defense capex by government, coupled with BELs
Bharat Electronics
29,992
1,250
1,414
13.2
strong market positioning, indicate good times ahead for BEL.
HCL Tech
1,02,901
729
1,000
37.1
Stock is trading at attractive valuations & factors all bad news.
Back on the growth trend, expect a long term growth of 14% to
Infosys
2,48,771
1,083
1,374
26.9
be a US$20bn in FY2020.
Continues to grow its retail loan book at healthy pace with
LIC Housing Fin.
25,463
505
592
17.3
improvement in asset quality. Expect LICHF to post a healthy
loan book which is likely to reflect in a strong earnings growth.
Strong market positioning within the domestic AC markets to
Voltas
11,081
335
407
21.5
continue, EMP business set to revive
Source: Company, Angel Research
Mid Cap
Market Cap
CMP
Target
Upside
Company
Rationale
(` Cr)
(`)
(`)
(%)
Among the top 4 players in the consumer durables segment.
Bajaj Electricals
2,394
237
268
13.1
Improved profitability backed by turn around in E&P segment.
Strong order book lends earnings visibility.
Favourable outlook for AC industry to augur well for Cooling
Blue Star
4,271
448
495
10.5
products business. EMPPAC division's profitability to improve
once operating environment turns around.
With a focus on the low and medium income (LMI) consumer
Dewan Housing
6,412
220
270
22.9
segment, the company has increased its presence in tier-II & III
cities where the growth opportunity is immense.
Strong loan growth backed by diversified loan portfolio and
Equitas Holdings
5,866
175
235
34.4
adequate CAR. ROE & ROA likely to remain decent as risk of
dilution remains low. Attractive valuations considering growth.
Expectations of above average monsoon augurs well for
Goodyear India
1,216
527
631
19.7
Goodyear India as it derives ~50% of its turnover from farm
tyre segment.
Commencement of new projects, downtrend in the interest rate
IL&FS Transport
2,609
79
93
17.3
cycle, to lead to stock re-rating
Economic recovery to have favourable impact on advertising &
Jagran Prakashan
5,888
180
205
13.8
circulation revenue growth. Further, the acquisition of a radio business
(Radio City) would also boost the company's revenue growth.
Speedier execution and speedier sales, strong revenue visibility
Mahindra Lifespace
1,897
462
554
19.9
in short-to-long run, attractive valuations
Massive capacity expansion along with rail advantage at ICD
Navkar Corporation
2,971
208
265
27.2
as well CFS augurs well for the company
Earnings boost on back of stable material prices and
Radico Khaitan
1,204
91
125
38.1
favourable pricing environment. Valuation discount to peers
provides additional comfort
Strong brands and distribution network would boost growth
Siyaram Silk Mills
986
1,052
1,347
28.0
going ahead. Stock currently trades at an inexpensive
valuation.
Source: Company, Angel Research
Market Outlook
July 21, 2016
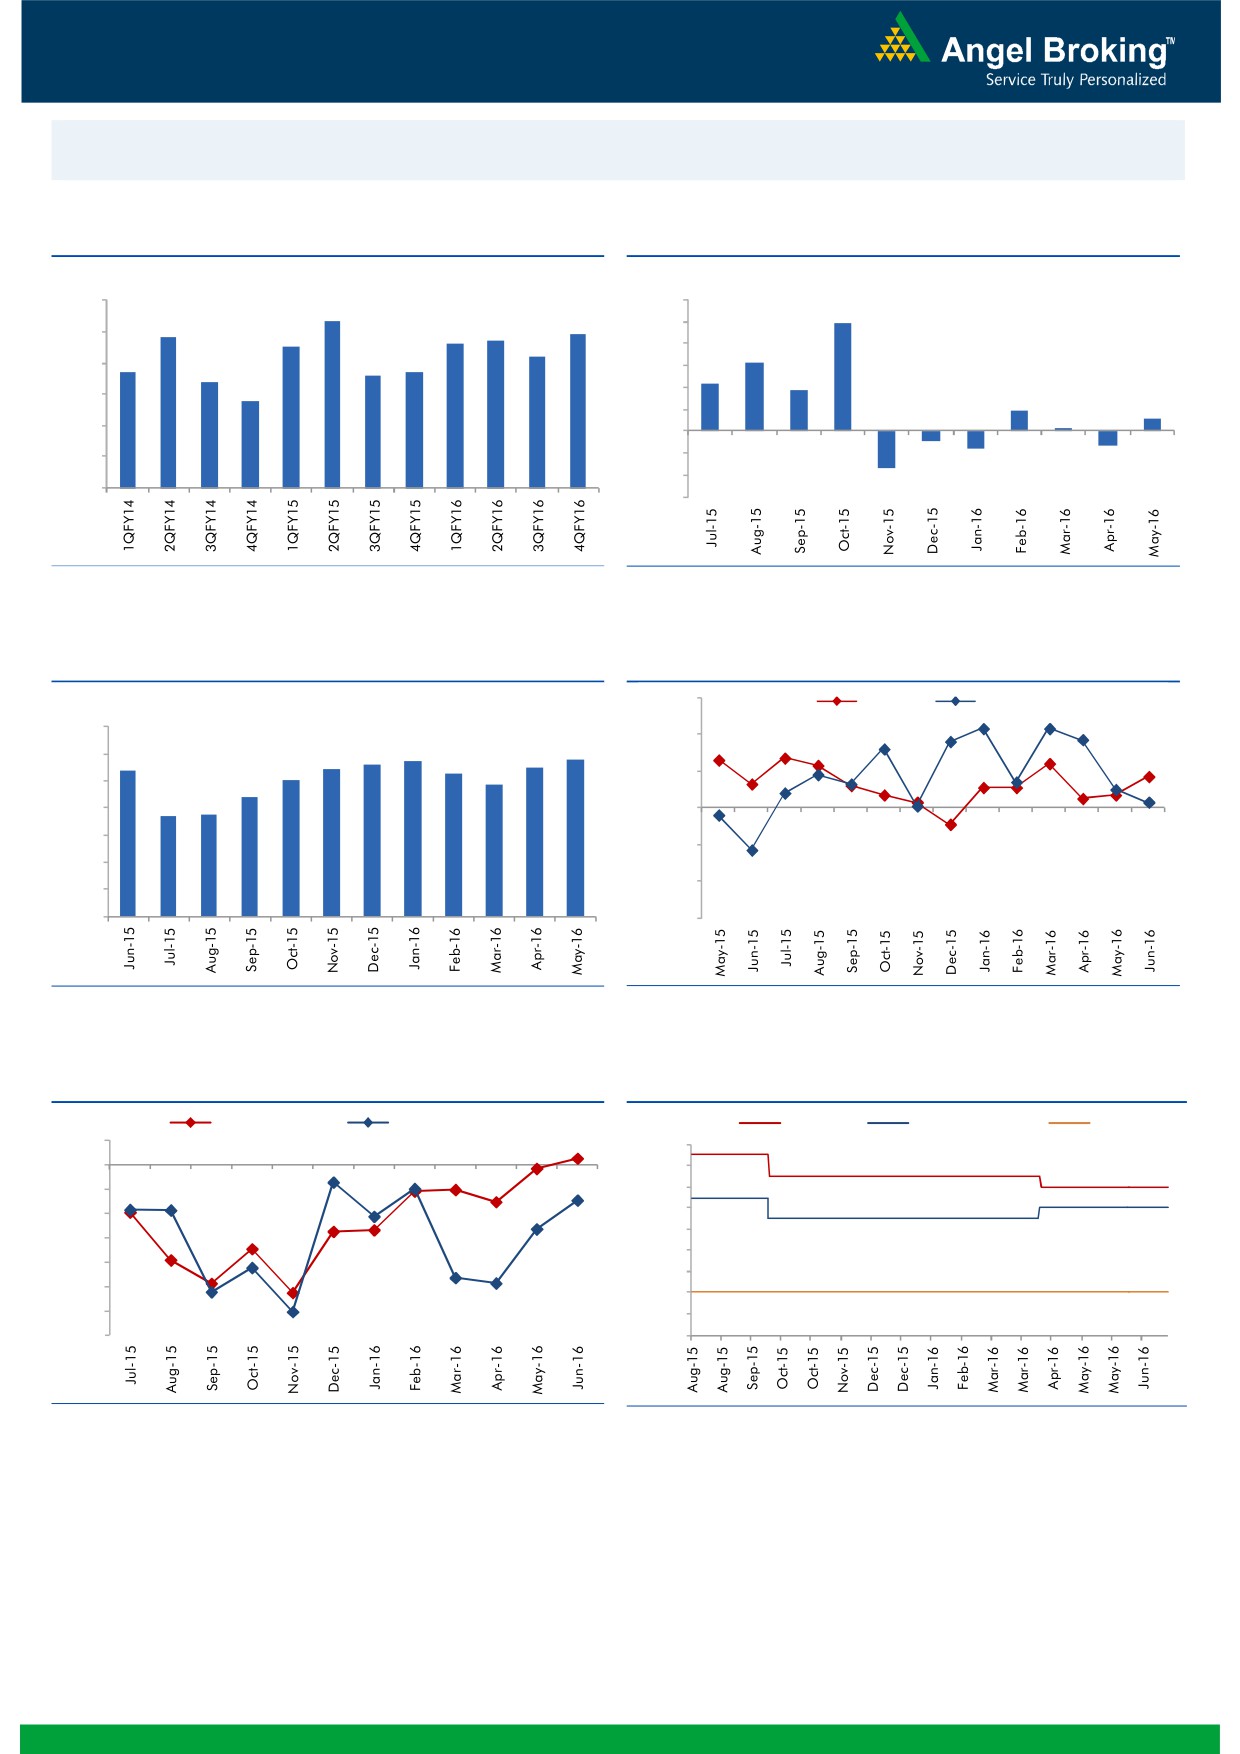
Macro watch
Exhibit 1: Quarterly GDP trends
Exhibit 2: IIP trends
(%)
(%)
9.0
12.0
8.3
9.9
7.8
7.7
7.9
10.0
8.0
7.5
7.6
7.2
8.0
6.3
6.7
6.6
6.7
7.0
6.4
6.0
4.3
3.7
5.8
4.0
6.0
1.9
1.2
2.0
0.3
5.0
-
4.0
(2.0)
(0.9)
(1.3)
(1.6)
(4.0)
3.0
(3.4)
(6.0)
Source: CSO, Angel Research
Source: MOSPI, Angel Research
Exhibit 3: Monthly CPI inflation trends
Exhibit 4: Manufacturing and services PMI
56.0
Mfg. PMI
Services PMI
(%)
7.0
54.0
5.7
5.8
5.4
5.4
5.6
5.5
6.0
5.3
5.0
4.8
52.0
5.0
4.4
3.7
3.7
4.0
50.0
3.0
48.0
2.0
46.0
1.0
-
44.0
Source: MOSPI, Angel Research
Source: Market, Angel Research; Note: Level above 50 indicates expansion
Exhibit 5: Exports and imports growth trends
Exhibit 6: Key policy rates
(%)
Exports yoy growth
Imports yoy growth
(%)
Repo rate
Reverse Repo rate
CRR
5.0
7.50
0.0
7.00
(5.0)
6.50
(10.0)
6.00
5.50
(15.0)
5.00
(20.0)
4.50
(25.0)
4.00
(30.0)
3.50
(35.0)
3.00
Source: Bloomberg, Angel Research
Source: RBI, Angel Research
Market Outlook
July 21, 2016
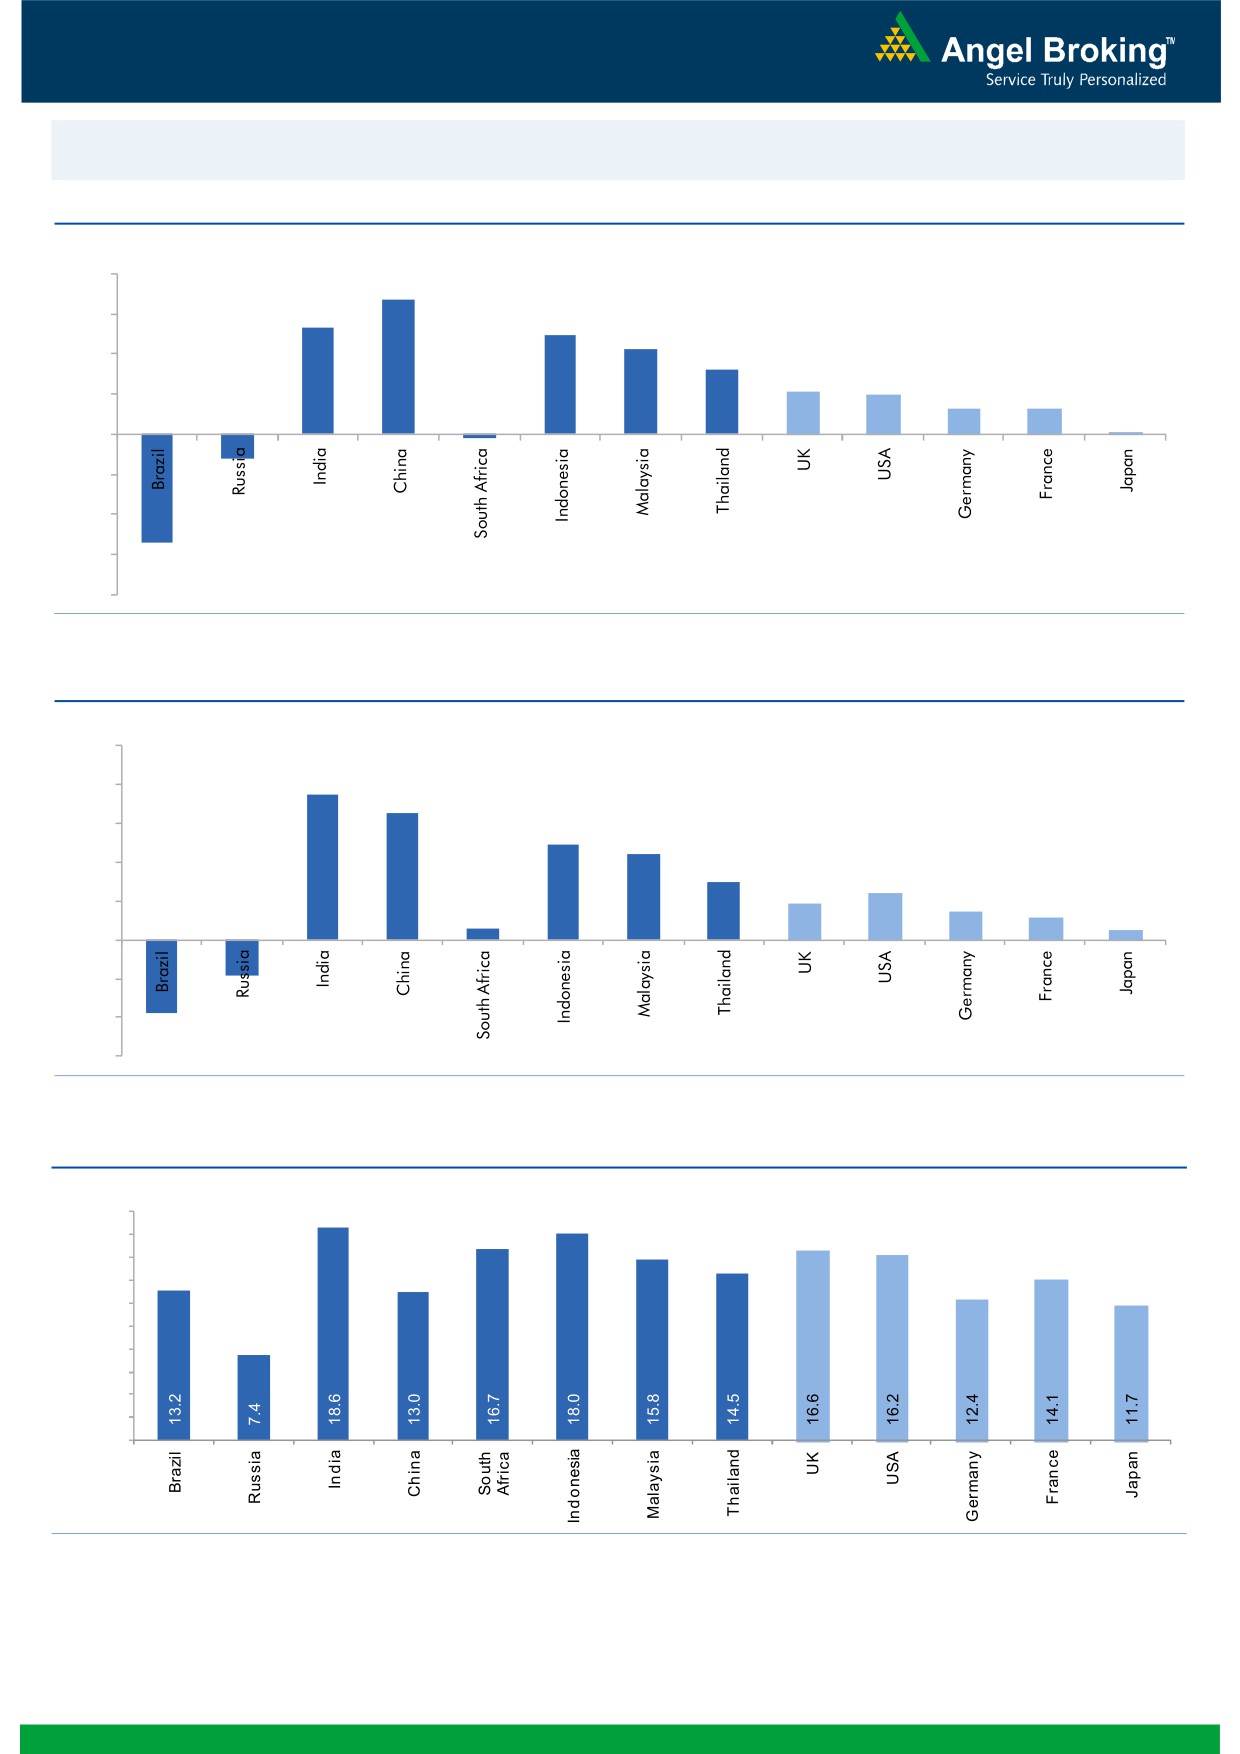
Global watch
Exhibit 1: Latest quarterly GDP Growth (%, yoy) across select developing and developed countries
(%)
8.0
6.7
6.0
5.3
4.9
4.2
4.0
3.2
2.1
2.0
2.0
1.3
1.3
0.1
-
(2.0)
(4.0)
(1.2)
(6.0)
(0.2)
(5.4)
(8.0)
Source: Bloomberg, Angel Research
Exhibit 2: 2016 GDP Growth projection by IMF (%, yoy) across select developing and developed countries
(%)
10.0
7.5
8.0
6.5
6.0
4.9
4.4
4.0
3.0
2.4
1.9
1.5
2.0
1.1
0.6
0.5
(3.8)
(1.8)
-
(2.0)
(4.0)
(6.0)
Source: IMF, Angel Research
Exhibit 3: One year forward P-E ratio across select developing and developed countries
(x)
20.0
18.0
16.0
14.0
12.0
10.0
8.0
6.0
4.0
2.0
-
Source: IMF, Angel Research
Market Outlook
July 21, 2016
Exhibit 4: Relative performance of indices across globe
Returns (%)
Country
Name of index
Closing price
1M
3M
1YR
Brazil
Bovespa
56,578
12.4
5.3
6.9
Russia
Micex
1,915
0.7
0.4
17.7
India
Nifty
8,566
4.8
8.2
1.3
China
Shanghai Composite
3,028
5.4
(0.3)
(23.6)
South Africa
Top 40
46,201
(1.7)
(1.4)
(2.5)
Mexico
Mexbol
47,505
3.8
4.3
6.3
Indonesia
LQ45
906
10.3
8.1
7.7
Malaysia
KLCI
1,670
2.6
(3.4)
(2.7)
Thailand
SET 50
959
5.2
11.5
(0.6)
USA
Dow Jones
18,595
5.2
3.0
4.2
UK
FTSE
6,729
8.5
5.1
1.1
Japan
Nikkei
16,682
6.9
(1.4)
(16.0)
Germany
DAX
10,142
1.8
(2.7)
(10.6)
France
CAC
4,380
0.9
(4.4)
(12.7)
Source: Bloomberg, Angel Research
Market Outlook
July 21, 2016
Key Upcoming Events
Result Calendar
Date
Company
July 21, 2016
HDFC Bank, Cairn India
July 22, 2016
Axis Bank
July 23, 2016
Mphasis, Persistent
July 26, 2016
IDFC, L G Balakrishnan & Bros
July 27, 2016
Asian Paints
July 28, 2016
GSK Pharma
July 29, 2016
Sesa Goa
August 05, 2016
LMW
Source: Bloomberg, Angel Research
Global economic events release calendar
Bloomberg Data
Date
Time
Country Event Description
Unit
Period
Last Reported Estimated
Jul 21, 2016
5:15 PM Euro Zone ECB announces interest rates
%
Jul 21
0.00
-
6:00 PM
US
Initial Jobless claims
Thousands
Jul 16
254.00
265.00
7:30 PM
US
Existing home sales
Million
Jun
5.53
5.48
July 22, 2016
1:00 PM Germany PMI Services
Value
Jul P
53.70
53.20
1:00 PM Germany PMI Manufacturing
Value
Jul P
54.50
53.40
2:00 PM
UK PMI Manufacturing
Value
Jul P
52.10
47.50
Jul 26, 2016
7:30 PM
US
Consumer Confidence
S.A./ 1985=100 Jul
98.00
95.25
7:30 PM
US
New home sales
Thousands
Jun
551.00
560.00
Jul 27, 2016
2:00 PM
UK GDP (YoY)
% Change
2Q A
2.00
11:30 PM
US
FOMC rate decision
%
Jul 27
0.50
0.50
Source: Bloomberg, Angel Research
Stock Watch
July 21, 2016
Company Name
Reco
CMP
Target
Mkt Cap
Sales ( Čcr )
OPM(%)
EPS (Č)
PER(x)
P/BV(x)
RoE(%)
EV/Sales(x)
(Č)
Price ( Č)
( Č cr )
FY16E FY17E
FY16E
FY17E
FY16E
FY17E
FY16E
FY17E
FY16E
FY17E
FY16E
FY17E
FY16E
FY17E
Agri / Agri Chemical
Rallis
Neutral
209
-
4,072
1,612
1,911
13.3
13.3
7.4
9.5
28.3
22.0
4.5
4.1
16.7
18.4
2.6
2.2
United Phosphorus
Buy
552
684
23,676
13,083
15,176
18.5
18.5
31.5
37.4
17.5
14.8
3.5
2.9
21.4
21.4
2.0
1.7
Auto & Auto Ancillary
Ashok Leyland
Buy
93
111
26,595
17,995
21,544
11.4
11.6
3.4
4.7
27.5
19.9
4.8
4.4
17.7
22.2
1.4
1.2
Bajaj Auto
Neutral
2,769
-
80,126
22,709
25,860
20.9
20.1
129.0
143.6
21.5
19.3
6.6
5.7
30.7
29.4
2.9
2.5
Bharat Forge
Buy
746
875
17,370
7,351
8,318
19.9
19.7
31.2
36.5
23.9
20.4
4.3
3.6
19.3
19.2
2.5
2.2
Eicher Motors
Neutral
19,850
-
53,914
15,556
16,747
15.5
17.3
464.8
597.5
42.7
33.2
15.6
11.5
36.2
34.3
3.4
3.1
Gabriel India
Neutral
102
-
1,464
1,415
1,544
8.7
9.0
4.6
5.4
22.2
18.9
4.0
3.6
18.1
18.9
1.0
0.9
Hero Motocorp
Neutral
3,277
-
65,430
28,244
30,532
15.5
15.9
156.7
168.5
20.9
19.5
8.4
7.1
39.9
36.4
2.1
1.9
Jamna Auto Industries Neutral
175
-
1,395
1,281
1,473
11.2
11.5
7.6
9.2
23.0
19.0
5.8
4.8
25.4
25.2
1.1
1.0
L G Balakrishnan & Bros Neutral
500
-
785
1,254
1,394
11.6
11.8
35.9
41.7
13.9
12.0
1.9
1.7
13.5
13.8
0.7
0.7
Mahindra and Mahindra Neutral
1,461
-
90,711
38,416
42,904
13.7
13.9
54.8
63.4
26.7
23.0
4.1
3.7
15.4
15.8
2.0
1.8
Maruti
Neutral
4,468
-
134,972
57,865
68,104
16.4
16.7
176.3
225.5
25.3
19.8
4.9
4.2
19.4
21.2
2.1
1.7
Minda Industries
Neutral
1,170
-
1,856
2,523
2,890
8.7
9.0
55.0
65.4
21.3
17.9
4.1
3.3
19.3
18.7
0.8
0.7
Motherson Sumi
Accumulate
309
313
40,860
39,343
45,100
8.8
9.1
10.1
12.5
30.6
24.7
9.7
7.6
35.3
34.4
1.1
0.9
Rane Brake Lining
Buy
476
465
377
454
511
11.5
12.0
25.2
31.0
18.9
15.4
2.8
2.6
14.9
16.6
0.8
0.8
Setco Automotive
Neutral
49
-
651
594
741
12.7
13.7
1.7
3.2
28.7
15.2
3.0
2.6
10.4
16.9
1.5
1.3
Tata Motors
Neutral
494
-
142,570
259,686
273,957
13.0
13.4
25.9
29.5
19.1
16.7
2.5
2.2
8.0
9.0
0.7
0.7
TVS Motor
Accumulate
303
330
14,390
11,263
13,122
6.9
8.5
9.2
15.0
32.9
20.2
7.5
6.0
22.7
29.6
1.3
1.1
Amara Raja Batteries
Buy
874
1,076
14,935
4,690
5,429
17.5
17.5
28.5
35.3
30.7
24.7
7.1
5.8
23.1
25.9
3.1
2.7
Exide Industries
Neutral
177
-
15,003
6,950
7,784
14.4
14.8
6.6
7.3
26.7
24.2
3.4
3.1
12.6
12.8
1.9
1.7
Apollo Tyres
Buy
159
183
8,086
12,056
12,714
17.2
16.4
23.0
20.3
6.9
7.8
1.2
1.1
17.7
13.6
0.7
0.7
Ceat
Buy
878
1,119
3,553
6,041
6,597
14.1
13.7
99.5
111.9
8.8
7.9
1.7
1.5
19.6
18.5
0.7
0.6
JK Tyres
Neutral
90
-
2,031
7,446
7,669
15.2
14.0
19.6
18.4
4.6
4.9
1.2
1.0
25.2
19.5
0.7
0.6
Swaraj Engines
Neutral
1,138
-
1,413
552
630
14.2
14.7
44.6
54.1
25.5
21.0
5.9
5.4
23.2
25.6
2.4
2.1
Subros
Neutral
93
-
559
1,293
1,527
11.8
11.9
4.2
6.7
22.2
13.9
1.7
1.5
7.7
11.5
0.8
0.6
Indag Rubber
Neutral
185
-
487
283
329
17.0
17.2
13.0
15.4
14.3
12.0
3.1
2.6
21.8
21.6
1.5
1.2
Capital Goods
ACE
Neutral
46
-
457
660
839
4.7
8.2
1.0
3.9
46.2
11.8
1.4
1.3
3.2
11.3
0.8
0.7
BEML
Buy
959
1,157
3,994
3,277
4,006
6.0
8.9
36.2
64.3
26.5
14.9
1.8
1.7
5.7
11.7
1.2
0.9
Bharat Electronics
Accumulate
1,250
1,414
29,992
7,295
8,137
20.0
16.8
56.5
58.7
22.1
21.3
3.3
2.9
42.1
44.6
3.4
2.9
Stock Watch
July 21, 2016
Company Name
Reco
CMP
Target
Mkt Cap
Sales ( Čcr )
OPM(%)
EPS (Č)
PER(x)
P/BV(x)
RoE(%)
EV/Sales(x)
(Č)
Price ( Č)
( Č cr )
FY16E
FY17E
FY16E
FY17E
FY16E
FY17E
FY16E
FY17E
FY16E
FY17E
FY16E
FY17E
FY16E
FY17E
Capital Goods
Voltas
Buy
335
407
11,081
5,857
6,511
7.5
7.9
11.7
12.9
28.6
26.0
4.7
4.1
17.1
16.7
1.8
1.6
BGR Energy
Neutral
120
-
869
3,615
3,181
9.5
9.4
16.7
12.4
7.2
9.7
0.7
0.7
10.0
7.0
0.7
0.8
BHEL
Neutral
144
-
35,307
33,722
35,272
10.8
11.7
10.5
14.2
13.7
10.2
1.0
1.0
7.0
9.0
1.1
1.0
Blue Star
Accumulate
448
495
4,271
3,770
4,351
5.7
6.4
11.4
17.2
39.2
26.1
6.1
5.7
18.4
23.1
1.1
1.0
Crompton Greaves
Neutral
73
-
4,603
13,484
14,687
4.9
6.2
4.5
7.1
16.3
10.4
1.2
1.1
7.2
10.8
0.5
0.4
Greaves Cotton
Neutral
144
-
3,524
1,655
1,755
16.6
16.8
7.4
7.8
19.5
18.5
3.9
3.7
21.1
20.6
2.1
2.0
Inox Wind
Buy
229
286
5,079
4,406
5,605
15.5
15.7
20.4
24.8
11.2
9.2
2.6
1.9
27.9
25.9
1.4
1.1
KEC International
Neutral
140
-
3,602
8,791
9,716
6.1
6.8
5.4
8.2
25.9
17.1
2.6
2.4
10.0
14.0
0.6
0.6
Thermax
Neutral
925
-
11,017
6,413
7,525
7.4
8.5
30.5
39.3
30.3
23.5
4.7
4.1
15.0
17.0
1.6
1.3
VATech Wabag
Accumulate
592
681
3,224
2,722
3,336
7.9
8.1
19.5
24.6
30.3
24.1
3.2
2.8
11.1
12.4
1.3
1.1
Cement
ACC
Neutral
1,634
-
30,675
13,151
14,757
16.4
18.3
63.9
83.4
25.6
19.6
3.3
3.0
13.3
16.1
2.2
1.8
Ambuja Cements
Neutral
262
-
40,691
11,564
12,556
19.4
20.7
8.9
10.1
29.5
26.0
3.7
3.5
12.8
13.8
3.1
2.9
HeidelbergCement
Neutral
128
-
2,904
1,772
1,926
13.3
15.4
1.0
3.0
128.2
42.7
3.2
3.0
2.6
7.9
2.1
1.9
India Cements
Neutral
116
-
3,553
4,216
4,840
18.0
19.5
4.0
9.9
28.9
11.7
1.2
1.1
4.0
9.5
1.2
1.0
JK Cement
Neutral
705
-
4,927
3,661
4,742
10.1
15.8
7.5
28.5
94.0
24.7
2.8
2.5
7.5
22.9
1.8
1.4
J K Lakshmi Cement
Neutral
417
-
4,904
2,947
3,616
16.7
19.9
11.5
27.2
36.2
15.3
3.4
3.0
9.8
20.8
2.0
1.6
Mangalam Cements
Neutral
300
-
802
1,053
1,347
10.5
13.3
8.4
26.0
35.8
11.6
1.5
1.4
4.3
12.5
1.1
0.9
Orient Cement
Neutral
173
-
3,547
1,854
2,524
21.2
22.2
7.7
11.1
22.5
15.6
3.2
2.8
13.3
15.7
2.8
1.9
Ramco Cements
Neutral
564
-
13,423
4,036
4,545
20.8
21.3
15.1
18.8
37.3
30.0
4.6
4.1
12.9
14.3
3.9
3.4
Shree Cement^
Neutral
16,223
-
56,517
7,150
8,742
26.7
28.6
228.0
345.5
71.1
47.0
10.5
8.8
15.7
20.3
7.6
6.1
UltraTech Cement
Neutral
3,560
-
97,693
24,669
29,265
18.2
20.6
82.0
120.0
43.4
29.7
4.7
4.1
11.3
14.7
3.9
3.3
Construction
ITNL
Accumulate
79
93
2,609
7,360
8,682
34.0
32.2
7.0
8.6
11.3
9.2
0.4
0.4
3.2
2.5
3.7
3.6
KNR Constructions
Accumulate
572
603
1,609
937
1,470
14.3
14.0
44.2
38.6
13.0
14.8
2.6
2.2
15.4
15.4
1.8
1.2
Larsen & Toubro
Accumulate
1,571
1,700
146,456
58,870
65,708
8.3
10.3
42.0
53.0
37.4
29.7
2.6
2.4
8.8
11.2
2.7
2.4
Gujarat Pipavav Port
Neutral
174
-
8,388
629
684
51.0
52.2
6.4
5.9
27.1
29.4
3.6
3.3
15.9
12.7
13.8
12.5
MBL Infrastructures
Buy
139
285
574
2,313
2,797
12.2
14.6
19.0
20.0
7.3
6.9
0.8
0.7
11.3
10.6
1.0
0.9
Nagarjuna Const.
Neutral
79
-
4,403
7,892
8,842
8.8
9.1
3.0
5.3
26.4
14.9
1.3
1.2
5.0
8.5
0.8
0.7
PNC Infratech
Accumulate
570
647
2,924
1,873
2,288
13.2
13.5
24.0
32.0
23.7
17.8
2.3
2.1
12.1
12.3
1.7
1.4
Simplex Infra
Neutral
294
-
1,455
5,955
6,829
10.3
10.5
16.0
31.0
18.4
9.5
1.0
0.9
5.3
9.9
0.8
0.7
Stock Watch
July 21, 2016
Company Name
Reco
CMP
Target
Mkt Cap
Sales ( Čcr )
OPM(%)
EPS (Č)
PER(x)
P/BV(x)
RoE(%)
EV/Sales(x)
(Č)
Price ( Č)
( Č cr )
FY16E
FY17E
FY16E
FY17E
FY16E
FY17E
FY16E
FY17E
FY16E
FY17E
FY16E
FY17E
FY16E
FY17E
Construction
Power Mech Projects
Neutral
550
-
809
1,539
1,801
12.8
12.7
59.0
72.1
9.3
7.6
1.4
1.2
18.6
16.8
0.5
0.5
Sadbhav Engineering
Neutral
297
-
5,089
3,186
3,598
10.2
10.3
8.0
9.0
37.1
33.0
3.5
3.0
9.4
9.9
1.9
1.7
NBCC
Neutral
242
-
14,505
5,838
7,428
6.0
7.9
5.2
8.2
46.5
29.5
1.5
1.2
21.9
28.2
2.5
1.8
MEP Infra
Neutral
45
-
732
1,956
1,876
28.1
30.5
1.3
3.0
34.6
15.0
7.3
4.9
21.2
32.8
1.8
1.8
SIPL
Neutral
101
-
3,572
675
1,042
62.4
64.7
-
-
3.8
4.3
-
-
17.0
11.4
Engineers India
Neutral
207
-
6,990
1,667
1,725
13.5
16.0
9.7
11.4
21.4
18.2
2.5
2.4
11.7
13.4
3.1
3.1
Financials
Allahabad Bank
Neutral
77
-
5,538
8,569
9,392
2.8
2.9
16.3
27.5
4.7
2.8
0.4
0.4
7.6
11.9
-
-
Axis Bank
Neutral
558
-
133,289
26,204
29,738
3.6
3.5
34.5
35.4
16.2
15.8
2.6
2.3
16.8
14.9
-
-
Bank of Baroda
Neutral
158
-
36,337
18,802
21,088
2.0
2.2
(7.4)
13.0
12.1
1.3
1.0
(4.2)
7.3
-
-
Bank of India
Neutral
110
-
10,270
15,972
17,271
1.9
2.0
15.3
33.4
7.2
3.3
0.3
0.3
3.6
7.6
-
-
Canara Bank
Neutral
259
-
14,080
15,441
16,945
2.0
2.1
46.6
70.4
5.6
3.7
0.5
0.4
8.0
11.2
-
-
Dena Bank
Neutral
40
-
2,691
3,440
3,840
2.1
2.3
7.3
10.0
5.6
4.0
0.4
0.3
6.1
7.9
-
-
Dewan Housing Finance Buy
220
270
6,412
1,828
2,225
2.9
3.0
24.9
29.7
8.8
7.4
1.4
1.2
15.1
16.1
-
-
Equitas Holdings
Buy
175
235
5,866
679
1,076
12.4
11.7
6.2
6.7
28.3
26.1
3.5
2.6
13.3
12.5
-
-
Federal Bank
Neutral
63
-
10,782
3,279
3,787
2.8
2.9
3.9
5.5
15.9
11.3
1.3
1.2
8.4
10.8
-
-
HDFC
Neutral
1,335
-
211,051
10,358
11,852
3.3
3.3
41.1
47.0
32.5
28.4
6.2
5.6
24.7
24.9
-
-
HDFC Bank
Accumulate
1,232
1,262
311,936
38,606
47,696
4.4
4.5
48.8
61.4
25.3
20.1
4.3
3.7
18.7
20.0
-
-
ICICI Bank
Neutral
268
-
155,661
34,279
39,262
3.3
3.3
21.0
24.4
12.8
11.0
2.2
1.8
14.4
14.7
-
-
IDBI Bank
Neutral
74
-
15,143
9,625
10,455
1.8
1.8
8.5
14.2
8.6
5.2
0.5
0.5
5.9
9.3
-
-
Indian Bank
Neutral
155
-
7,421
6,160
6,858
2.5
2.5
24.5
29.8
6.3
5.2
0.5
0.4
7.7
8.6
-
-
LIC Housing Finance
Accumulate
505
592
25,463
3,179
3,758
2.6
2.6
32.9
40.6
15.3
12.4
2.8
2.4
19.6
20.7
-
-
Oriental Bank
Neutral
116
-
4,010
7,643
8,373
2.4
2.4
37.2
45.4
3.1
2.6
0.3
0.2
8.2
9.4
-
-
Punjab Natl.Bank
Neutral
129
-
25,409
23,122
26,022
2.8
2.8
7.0
21.6
18.5
6.0
0.9
0.9
3.4
10.0
-
-
South Ind.Bank
Neutral
22
-
2,917
1,965
2,185
2.5
2.5
2.5
3.3
8.7
6.5
0.9
0.8
9.5
11.7
-
-
St Bk of India
Neutral
231
-
179,243
79,958
86,061
2.6
2.6
13.4
20.7
17.2
11.2
1.4
1.3
11.5
12.8
-
-
Union Bank
Neutral
137
-
9,390
12,646
14,129
2.3
2.4
31.0
39.1
4.4
3.5
0.5
0.4
9.8
11.4
-
-
Vijaya Bank
Neutral
42
-
4,210
3,536
3,827
1.9
1.9
5.5
6.7
7.6
6.3
0.6
0.6
7.8
8.8
-
-
Yes Bank
Neutral
1,161
-
48,897
7,190
9,011
3.2
3.3
58.2
69.7
20.0
16.7
3.6
3.0
19.2
19.6
-
-
FMCG
Asian Paints
Neutral
1,029
-
98,735
15,534
17,445
17.7
16.8
18.4
19.6
56.0
52.5
19.8
18.7
34.6
35.6
6.2
5.5
Stock Watch
July 21, 2016
Company Name
Reco
CMP
Target
Mkt Cap
Sales ( Čcr )
OPM(%)
EPS (Č)
PER(x)
P/BV(x)
RoE(%)
EV/Sales(x)
(Č)
Price ( Č)
( Č cr )
FY16E FY17E
FY16E
FY17E
FY16E
FY17E
FY16E
FY17E
FY16E
FY17E
FY16E
FY17E
FY16E
FY17E
FMCG
Britannia
Neutral
2,805
-
33,656
8,481
9,795
14.0
14.1
65.5
78.3
42.8
35.8
20.3
16.6
38.3
41.2
4.0
3.4
Colgate
Neutral
949
-
25,817
4,136
4,632
22.5
23.3
22.2
25.3
42.8
37.5
26.0
23.2
68.6
67.5
6.0
5.4
Dabur India
Neutral
304
-
53,434
9,370
10,265
17.6
17.3
7.3
8.1
41.4
37.5
10.7
9.8
31.7
30.6
5.7
5.2
GlaxoSmith Con*
Neutral
6,375
-
26,812
4,519
5,142
19.6
19.8
164.3
191.2
38.8
33.3
10.7
9.2
30.8
29.9
5.2
4.5
Godrej Consumer
Neutral
1,614
-
54,959
9,003
10,335
18.1
18.7
34.1
41.8
47.3
38.6
10.2
8.8
23.9
24.8
6.3
5.5
HUL
Neutral
907
-
196,275
33,299
35,497
17.1
17.1
18.9
20.0
48.0
45.3
42.1
36.6
87.6
80.8
5.8
5.4
ITC
Neutral
251
-
302,736
36,837
39,726
38.8
38.7
8.2
9.0
30.8
27.9
8.6
7.5
27.8
26.9
7.6
7.0
Marico
Neutral
278
-
35,873
6,151
6,966
17.2
17.3
5.4
6.4
51.5
43.5
16.2
12.8
33.2
32.4
5.6
5.0
Nestle*
Neutral
6,660
-
64,210
9,393
10,507
22.2
22.3
106.8
121.8
62.4
54.7
21.9
19.7
34.8
36.7
6.4
5.7
Tata Global
Neutral
134
-
8,448
8,635
9,072
9.8
9.9
5.8
7.2
23.1
18.6
2.1
2.0
6.8
7.4
1.0
1.0
Procter & Gamble
Buy
6,345
7,369
20,596
2,588
2,939
23.3
23.2
130.2
146.2
48.7
43.4
97.2
93.2
27.6
25.3
7.4
6.5
Hygiene
IT
HCL Tech^
Buy
729
1,000
102,901
37,061
30,781
21.5
20.5
51.4
40.0
14.2
18.2
3.7
2.7
20.1
20.3
2.5
2.6
Infosys
Buy
1,083
1,374
248,771
62,441
70,558
27.5
27.5
59.0
65.3
18.4
16.6
3.7
3.4
22.2
22.4
3.8
3.2
TCS
Buy
2,493
3,004
491,277
108,646
122,770
28.3
28.3
123.7
141.0
20.2
17.7
6.7
6.1
33.1
34.6
4.0
3.5
Tech Mahindra
Buy
505
700
49,065
26,494
30,347
16.3
17.0
32.2
37.5
15.7
13.5
3.4
2.9
21.7
21.8
1.6
1.4
Wipro
Buy
539
680
133,073
50,808
56,189
23.7
23.8
37.3
40.7
14.4
13.2
2.8
2.5
19.2
17.7
2.2
1.9
Media
D B Corp
Neutral
395
-
7,255
2,025
2,187
27.4
27.4
17.4
18.9
22.7
20.9
5.1
4.7
22.9
23.7
3.4
3.1
HT Media
Neutral
79
-
1,835
2,495
2,673
12.9
13.2
6.8
7.2
11.6
11.0
0.9
0.9
7.5
7.8
0.4
0.3
Jagran Prakashan
Accumulate
180
205
5,888
2,107
2,355
33.5
28.0
10.1
10.8
17.9
16.7
4.2
3.6
23.3
21.7
2.9
2.6
Sun TV Network
Neutral
400
-
15,775
2,510
2,763
71.8
71.5
21.9
24.8
18.3
16.1
4.3
3.9
22.8
24.3
5.4
4.9
Hindustan Media
Neutral
273
-
2,004
914
1,016
21.7
21.5
21.9
23.3
12.5
11.7
2.2
1.9
18.0
16.2
1.6
1.4
Ventures
Metals & Mining
Coal India
Buy
329
380
207,966
76,167
84,130
19.9
22.3
22.4
25.8
14.7
12.8
5.3
5.2
35.5
41.0
2.0
1.7
Hind. Zinc
Neutral
194
-
81,992
14,641
14,026
50.4
50.4
17.7
16.0
11.0
12.1
1.7
1.5
16.2
13.2
3.3
3.2
Hindalco
Neutral
136
-
28,043
104,356
111,186
8.7
9.5
6.7
11.1
20.2
12.3
0.7
0.7
3.5
5.9
0.8
0.7
JSW Steel
Neutral
1,619
-
39,132
42,308
45,147
16.4
20.7
(10.3)
49.5
32.7
1.8
1.7
(1.0)
5.6
1.9
1.8
NMDC
Neutral
94
-
37,447
8,237
10,893
46.6
44.5
10.0
11.7
9.5
8.1
1.1
0.9
12.5
13.0
4.5
3.4
SAIL
Neutral
48
-
19,783
45,915
53,954
7.2
10.5
1.5
4.4
31.8
10.9
0.5
0.5
2.3
4.1
1.1
1.0
Vedanta
Neutral
162
-
47,939
71,445
81,910
26.2
26.3
12.9
19.2
12.6
8.4
0.9
0.8
7.2
8.9
1.1
0.9
Tata Steel
Neutral
368
-
35,784
126,760
137,307
8.9
11.3
6.4
23.1
57.9
16.0
1.2
1.1
2.0
7.1
0.8
0.8
Stock Watch
July 21, 2016
Company Name
Reco
CMP
Target
Mkt Cap
Sales ( Čcr )
OPM(%)
EPS (Č)
PER(x)
P/BV(x)
RoE(%)
EV/Sales(x)
(Č)
Price ( Č)
( Č cr )
FY16E FY17E
FY16E
FY17E
FY16E
FY17E
FY16E
FY17E
FY16E
FY17E
FY16E
FY17E
FY16E
FY17E
Oil & Gas
Cairn India
Neutral
176
-
32,932
11,323
12,490
49.4
51.0
20.7
20.7
8.5
8.5
0.6
0.5
6.4
6.1
1.8
1.1
GAIL
Neutral
395
-
50,086
64,856
70,933
9.1
9.6
24.0
28.9
16.5
13.7
1.4
1.3
8.8
9.6
0.9
0.8
ONGC
Neutral
224
-
191,472
154,564
145,998
36.8
37.4
20.8
22.6
10.8
9.9
1.0
1.0
10.1
9.7
1.5
1.6
Petronet LNG
Neutral
292
-
21,934
29,691
31,188
5.8
6.2
12.8
13.4
22.9
21.8
3.4
3.0
15.8
14.8
0.8
0.8
Indian Oil Corp
Neutral
513
-
124,518
359,607
402,760
5.9
6.1
42.5
48.7
12.1
10.5
1.6
1.4
14.1
14.4
0.4
0.4
Reliance Industries
Neutral
1,023
-
331,556
304,775
344,392
12.6
13.4
91.3
102.6
11.2
10.0
1.3
1.1
11.8
12.0
1.0
0.8
Pharmaceuticals
Alembic Pharma
Neutral
589
-
11,107
3,145
3,483
31.9
16.2
38.2
18.7
15.4
31.5
6.9
5.9
57.9
20.1
3.5
3.2
Aurobindo Pharma
Neutral
798
-
46,694
13,651
15,702
21.7
21.7
33.9
38.4
23.5
20.8
6.6
5.1
32.5
27.7
3.6
3.2
Aventis*
Neutral
4,483
-
10,325
2,049
2,375
15.4
17.3
115.4
153.5
38.9
29.2
6.3
5.0
19.3
25.8
4.9
4.1
Cadila Healthcare
Accumulate
372
400
38,068
9,469
11,246
21.2
22.0
14.9
17.1
25.0
21.8
7.1
5.6
28.8
26.6
4.0
3.3
Cipla
Neutral
518
-
41,609
13,372
15,378
16.4
17.4
18.8
21.6
27.5
24.0
3.5
3.1
13.3
13.7
3.1
3.0
Dr Reddy's
Neutral
3,679
-
62,747
15,471
17,479
24.6
24.6
138.2
152.4
26.6
24.1
4.9
4.2
19.7
18.7
3.9
3.5
Dishman Pharma
Neutral
136
-
2,201
1,733
1,906
21.5
21.5
10.1
10.0
13.5
13.6
1.6
1.4
10.5
11.2
1.8
1.5
GSK Pharma*
Neutral
3,399
-
28,793
2,741
3,528
16.5
18.9
44.2
60.1
76.9
56.6
17.0
16.8
21.2
29.9
10.5
8.2
Indoco Remedies
Neutral
306
-
2,823
977
1,112
14.9
18.2
9.0
13.2
34.0
23.2
4.8
4.1
15.1
19.2
2.8
2.5
Ipca labs
Buy
488
613
6,154
2,844
3,799
10.6
15.3
10.6
17.3
46.0
28.2
2.7
2.5
5.9
9.1
2.2
1.7
Lupin
Accumulate
1,714
1,809
77,256
13,702
15,912
23.7
26.4
50.5
58.1
33.9
29.5
7.0
5.7
22.9
21.4
6.0
4.8
Sun Pharma
Buy
797
944
191,814
27,744
31,129
26.0
30.0
22.0
28.0
36.2
28.5
5.3
4.4
18.3
18.7
6.6
5.7
Power
Tata Power
Neutral
72
-
19,568
35,923
37,402
22.6
22.8
4.1
5.2
17.9
14.1
1.4
1.3
7.5
9.3
1.5
1.4
NTPC
Neutral
157
-
129,701
87,271
99,297
23.5
23.5
11.8
13.3
13.4
11.8
1.5
1.4
11.5
12.2
2.5
2.2
Power Grid
Neutral
168
-
87,891
20,702
23,361
86.7
86.4
12.1
13.2
13.9
12.7
2.0
1.8
15.6
15.1
9.1
8.5
Real Estate
MLIFE
Buy
462
554
1,897
826
1,011
20.1
21.9
22.7
30.7
20.4
15.1
1.2
1.1
6.0
7.4
4.3
3.2
Telecom
Bharti Airtel
Neutral
364
-
145,445
101,748
109,191
32.1
31.7
12.0
12.5
30.3
29.1
2.1
2.0
6.9
6.7
2.1
1.9
Idea Cellular
Neutral
105
-
37,970
34,282
36,941
32.0
31.5
5.9
6.2
17.9
17.0
1.6
1.5
9.9
9.3
1.7
1.6
zOthers
Abbott India
Neutral
4,700
-
9,988
2,715
3,153
14.5
14.1
134.3
152.2
35.0
30.9
8.7
7.2
27.4
25.6
3.4
2.9
Bajaj Electricals
Accumulate
237
268
2,394
4,612
5,351
5.6
5.7
9.5
12.4
25.0
19.2
3.1
2.8
12.5
14.4
0.5
0.5
Finolex Cables
Neutral
372
-
5,683
2,520
2,883
12.2
12.0
12.7
14.2
29.3
26.2
4.0
3.5
13.6
13.5
2.0
1.7
Goodyear India*
Buy
527
631
1,216
1,750
1,598
11.3
10.4
53.7
49.4
9.8
10.7
2.1
1.8
23.0
18.2
0.5
0.4
Hitachi
Neutral
1,396
-
3,794
1,779
2,081
7.8
8.8
21.8
33.4
64.0
41.7
10.3
8.4
17.4
22.1
2.2
1.8
Stock Watch
July 21, 2016
Company Name
Reco
CMP
Target
Mkt Cap
Sales ( Čcr )
OPM(%)
EPS (Č)
PER(x)
P/BV(x)
RoE(%)
EV/Sales(x)
(Č)
Price ( Č)
( Č cr )
FY16E
FY17E
FY16E
FY17E
FY16E
FY17E
FY16E
FY17E
FY16E
FY17E
FY16E
FY17E
FY16E
FY17E
zOthers
Jyothy Laboratories
Neutral
290
-
5,249
1,620
1,847
11.5
11.5
7.3
8.5
39.8
34.2
5.1
4.8
13.3
14.4
3.2
2.7
MRF
Buy
35,252
45,575
14,951
20,316
14,488
21.4
21.1
5,488.0
3,798.0
6.4
9.3
2.2
1.8
41.1
21.2
0.7
0.9
Page Industries
Neutral
13,514
-
15,073
1,929
2,450
19.8
20.1
229.9
299.0
58.8
45.2
25.9
18.0
52.1
47.1
7.7
6.0
Relaxo Footwears
Neutral
484
-
5,812
1,767
2,152
12.3
12.5
19.3
25.1
25.2
19.3
6.2
4.7
27.7
27.8
3.3
2.7
Siyaram Silk Mills
Buy
1,052
1,347
986
1,619
1,799
11.6
11.6
93.5
104.9
11.3
10.0
1.9
1.7
17.1
16.4
0.9
0.8
Styrolution ABS India* Neutral
643
-
1,130
1,271
1,440
8.6
9.2
32.0
41.1
20.1
15.7
2.1
1.8
10.7
12.4
0.8
0.7
TVS Srichakra
Buy
2,370
2,932
1,815
2,035
2,252
15.9
15.3
248.6
268.1
9.5
8.8
4.2
3.0
43.6
33.9
0.9
0.8
HSIL
Accumulate
304
310
2,197
2,123
2,384
16.1
16.5
15.0
18.9
20.2
16.1
1.6
1.5
8.0
9.4
1.3
1.1
Kirloskar Engines India
Neutral
268
-
3,879
2,403
2,554
8.6
9.9
9.2
10.5
29.2
25.6
2.8
2.7
9.7
10.7
1.2
1.1
Ltd
M M Forgings
Buy
417
546
504
511
615
21.7
21.6
43.1
55.8
9.7
7.5
1.8
1.4
19.9
21.2
1.2
0.9
Banco Products (India) Neutral
151
-
1,078
1,208
1,353
11.0
12.3
10.8
14.5
14.0
10.4
1.6
1.4
11.9
14.5
0.9
0.8
Competent Automobiles Neutral
150
-
92
1,040
1,137
3.2
3.1
25.7
28.0
5.8
5.4
0.9
0.8
15.0
14.3
0.1
0.1
Nilkamal
Neutral
1,213
-
1,810
1,871
2,031
10.7
10.5
63.2
69.8
19.2
17.4
3.1
2.7
17.6
16.6
1.0
0.9
Visaka Industries
Neutral
157
-
249
1,020
1,120
8.7
9.1
13.9
20.1
11.3
7.8
0.7
0.7
6.4
8.7
0.5
0.4
Transport Corporation of
Neutral
353
-
2,701
2,830
3,350
8.8
9.0
14.4
18.3
24.6
19.3
3.8
3.3
15.4
17.1
1.0
0.9
India
Elecon Engineering
Neutral
62
-
678
1,359
1,482
10.3
13.7
0.8
3.9
77.5
16.0
1.3
1.2
1.6
7.8
0.9
0.8
Surya Roshni
Buy
165
201
725
2,992
3,223
8.1
8.4
14.7
18.3
11.3
9.0
1.1
1.0
9.7
11.0
0.5
0.5
MT Educare
Neutral
156
-
621
286
366
18.3
17.7
7.7
9.4
20.2
16.7
4.3
3.7
20.2
21.1
2.2
1.7
Radico Khaitan
Buy
91
125
1,204
1,543
1,659
12.6
13.0
5.8
6.3
15.7
14.3
1.3
1.2
8.5
8.6
1.3
1.2
Garware Wall Ropes
Accumulate
418
460
915
828
898
11.2
10.3
28.3
29.0
14.8
14.4
2.5
2.1
16.8
14.9
1.1
1.0
Wonderla Holidays
Neutral
405
-
2,288
206
308
44.0
43.6
9.0
12.9
45.0
31.4
6.1
5.6
13.7
17.8
10.8
7.2
Linc Pen & Plastics
Neutral
279
-
413
344
382
9.1
9.1
12.4
13.1
22.5
21.3
4.1
3.6
18.0
16.7
1.2
1.0
The Byke Hospitality
Neutral
162
-
651
222
287
20.5
20.5
5.6
7.6
28.8
21.5
5.4
4.5
18.9
20.8
3.0
2.3
Interglobe Aviation
Neutral
951
-
34,284
17,022
21,122
20.7
14.5
63.9
53.7
14.9
17.7
22.3
18.3
149.9
103.2
2.2
1.7
Coffee Day Enterprises
Neutral
232
-
4,779
2,692
2,964
17.0
18.6
-
4.7
-
49.0
2.8
2.7
0.2
5.5
2.3
2.1
Ltd
Navneet Education
Neutral
94
-
2,230
998
1,062
24.1
24.0
5.8
6.1
16.3
15.4
3.6
3.2
22.0
20.6
2.4
2.3
Navkar Corporation
Buy
208
265
2,971
347
408
43.2
42.9
6.7
6.8
31.2
30.8
2.3
2.1
7.3
6.9
9.1
8.3
UFO Moviez
Neutral
545
-
1,504
558
619
32.0
33.2
22.5
30.0
24.2
18.2
2.9
2.5
12.0
13.8
2.6
2.2
VRL Logistics
Neutral
314
-
2,868
1,725
1,902
16.5
16.7
12.2
14.6
25.8
21.6
5.4
4.7
20.8
21.9
1.8
1.6
Stock Watch
July 21, 2016
Company Name
Reco
CMP
Target Mkt Cap
Sales ( Čcr )
OPM(%)
EPS (Č)
PER(x)
P/BV(x)
RoE(%)
EV/Sales(x)
(Č)
Price ( Č)
( Č cr )
FY16E FY17E FY16E FY17E FY16E FY17E FY16E FY17E FY16E FY17E FY16E FY17E FY16E FY17E
zOthers
Team Lease Serv.
Neutral
1,039
-
1,776
2,565
3,229
1.3
1.5
15.2
22.8
68.5
45.6
5.5
4.9
8.0
10.7
0.6
0.5
S H Kelkar & Co.
Neutral
232
-
3,349
928
1,036
15.3
15.1
4.9
6.1
46.9
37.9
4.4
4.1
9.4
10.7
3.5
3.1
Quick Heal
Neutral
262
-
1,837
339
408
27.8
27.3
7.1
7.7
37.1
33.9
3.1
3.1
8.5
9.3
4.7
4.0
Narayana Hrudaya
Neutral
292
-
5,969
1,603
1,873
10.9
11.5
1.0
2.6
306.6
110.4
7.4
6.8
2.4
6.1
4.1
3.5
Manpasand Bever.
Neutral
715
-
3,577
540
836
19.9
19.6
10.2
16.9
69.8
42.3
5.7
5.1
8.1
12.0
5.5
3.5
Parag Milk Foods
Neutral
326
-
2,742
1,645
1,919
9.0
9.3
6.7
9.5
48.5
34.5
6.3
5.4
13.1
15.5
1.9
1.6
Source: Company, Angel Research; Note: *December year end; #September year end; &October year end; Price as on July 20, 2016
Market Outlook
July 21, 2016
Research Team Tel: 022 - 39357800
DISCLAIMER
Angel Broking Private Limited (hereinafter referred to as “Angel”) is a registered Member of National Stock Exchange of India Limited,
Bombay Stock Exchange Limited and Metropolitan Stock Exchange Limited. It is also registered as a Depository Participant with CDSL
and Portfolio Manager with SEBI. It also has registration with AMFI as a Mutual Fund Distributor. Angel Broking Private Limited is a
registered entity with SEBI for Research Analyst in terms of SEBI (Research Analyst) Regulations, 2014 vide registration number
INH000000164. Angel or its associates has not been debarred/ suspended by SEBI or any other regulatory authority for accessing
/dealing in securities Market. Angel or its associates/analyst has not received any compensation / managed or co-managed public
offering of securities of the company covered by Analyst during the past twelve months.
This document is solely for the personal information of the recipient, and must not be singularly used as the basis of any investment
decision. Nothing in this document should be construed as investment or financial advice. Each recipient of this document should make
such investigations as they deem necessary to arrive at an independent evaluation of an investment in the securities of the companies
referred to in this document (including the merits and risks involved), and should consult their own advisors to determine the merits and
risks of such an investment.
Reports based on technical and derivative analysis center on studying charts of a stock's price movement, outstanding positions and
trading volume, as opposed to focusing on a company's fundamentals and, as such, may not match with a report on a company's
fundamentals. Investors are advised to refer the Fundamental and Technical Research Reports available on our website to evaluate the
contrary view, if any.
The information in this document has been printed on the basis of publicly available information, internal data and other reliable
sources believed to be true, but we do not represent that it is accurate or complete and it should not be relied on as such, as this
document is for general guidance only. Angel Broking Pvt. Limited or any of its affiliates/ group companies shall not be in any way
responsible for any loss or damage that may arise to any person from any inadvertent error in the information contained in this report.
Angel Broking Pvt. Limited has not independently verified all the information contained within this document. Accordingly, we cannot
testify, nor make any representation or warranty, express or implied, to the accuracy, contents or data contained within this document.
While Angel Broking Pvt. Limited endeavors to update on a reasonable basis the information discussed in this material, there may be
regulatory, compliance, or other reasons that prevent us from doing so.
This document is being supplied to you solely for your information, and its contents, information or data may not be reproduced,
redistributed or passed on, directly or indirectly.
Neither Angel Broking Pvt. Limited, nor its directors, employees or affiliates shall be liable for any loss or damage that may arise from
or in connection with the use of this information.