Market Outlook
October 20, 2015
Market Cues
Domestic Indices
Chg (%)
(Pts)
(Close)
Indian markets are expected to open on flat note tracking the SGX Nifty and most its
BSE Sensex
0.6
150
27,365
Asian peers.
Nifty
0.4
37
8,275
After turning in a strong performance last week, US Markets were slightly higher at
Mid Cap
0.7
76
11,124
Monday's close after an indecisive day of trading.
Small Cap
0.8
89
11,585
The European markets ended Monday's session with mixed movement. European
Bankex
(0.3)
(71)
20,389
energy and resource stocks were among the weakest performers.
The Indian markets extended gains for a third day in a row on Monday as Reliance
Global Indices
Chg (%)
(Pts)
(Close)
Industries reported its highest ever quarterly net profit for the September quarter and
Dow Jones
0.1
15
17,230
Chinese GDP data indicated the world's second-largest economy is not facing a big
risk of hard landing.
Nasdaq
0.4
19
4,905
FTSE
(0.4)
26
6,352
News & Result Analysis
Nikkei
(0.9)
(161)
18,131
Infosys-Update
Hang Seng
0.0
8
23,076
Result Review: HCL Tech
Shanghai Com
(0.1)
(5)
3,387
Result Preview: Hero Motocorp, Sanofi India
Detailed analysis on Pg2
Advances / Declines
Bse
Nse
Investor’s Ready Reckoner
Advances
1,553
851
Key Domestic & Global Indicators
Declines
1,175
650
Stock Watch: Latest investment recommendations on 150+ stocks
Unchanged
155
87
Refer Pg7 onwards
Top Picks
Volumes (` Cr)
CMP
Target
Upside
Company
Sector
Rating
BSE
2,574
(`)
(`)
(%)
NSE
15,160
Axis Bank
Financials
Buy
507
701
38.3
ICICI Bank
Financials
Buy
287
370
28.8
Power Grid
Power
Buy
133
170
27.5
Net Inflows (` Cr)
Net
Mtd
Ytd
TCS
IT
Buy
2,487
3,165
27.3
FII
402
3,073 1,21,137
Aurobindo Pharma Pharmaceuticals Accumulate
805
872
8.3
MFs
126
934
79,938
More Top Picks on Pg4
Top Gainers
Price (`)
Chg (%)
Key Upcoming Events
Previous
Consensus
Ifci
29
16.0
Date
Region
Event Description
Reading
Expectations
Pel
561
13.8
Oct 20
US
Housing Starts
1,126.00
1,147.00
Jetairways
417
8.8
Oct 20
US
Building permits
1,170.00
1,165.00
Amtekauto
47
8.6
Oct 22
Euro Zone
ECB announces interest rates
0.05
0.05
Sjvn
28
7.3
Oct 28
US
FOMC rate decision
0.25
0.25
Top Losers
Price (`)
Chg (%)
Lichsgfin
478
(3.5)
Redington
122
(3.2)
Ongc
258
(2.4)
Adanient
94
(2.4)
Pmcfin
1
(2.3)
As on October 19, 2015
Market Outlook
October 20, 2015
Infosys-Update
Infosys Ltd has considered and approved to acquire 100% stake in Noah
Consulting LLC, head quartered in Houston, Texas (USA), a leading provider
advanced information management consulting services for the oil and gas
industry, for US$70mn. The Company further informed that none of the promoter
or promoter group or group companies has any interest in Noah Consulting LLC
and this acquisition does not fall under the related party transaction. The
acquisition is small and would not impact the financials in a big way. We maintain
our buy with a price target of `1,306.
Review
HCL Tech (CMP: `857 / TP: `1,132 /Upside: 32.1%)
HCL Tech, posted results just in line with expectations, while EBIT margins came
ahead of expectations. On sales front, the company posted a 0.5% sequential
growth in USD revenues to US$1,545mn V/s US$1,547mn expected. On Constant
currency (CC), the company posted a 1.2% qoq rise in sales. In rupee terms,
revenues came in at `10,097cr V/s `10,085cr expected, up 3.3% qoq.
In terms of geography, US grew by 0.7% qoq CC growth; Europe grew by
5.6% qoq CC growth. In ROW de-grew by 8.4% qoq CC growth. In terms of
services, it was a broad based growth across all revenue segments driven by
Engineering and R&D Services at qoq CC 3.6%, Business Services at qoq CC
2.4%, and Infrastructure Services at qoq CC 0.9% on constant currency basis. In
terms of verticals, it was Financial services posted a qoq CC growth of 1.9%,
Manufacturing posted a qoq CC growth of 0.5%, Life Sciences & Healthcare
posted a qoq CC growth of 4.3%, Public Services posted a qoq CC growth of
4.9%, Retail & CPG posted a qoq CC growth of 1.4% and Telecommunications,
Media, Publishing & Entertainment a qoq CC growth of 1.0%.
On the operating front, the EBIT margins came in at 20.5% V/s 19.1% expected
and
20.2% in 1QFY2016, a qoq contraction of
~111bps. However, after
adjusting for US$18.4mn provision for the client, the EBIT margins came in at
19.4%. Consequently, Adj. PAT came in at `1,726cr V/s `1,741cr expected a dip
of 2.3% qoq. However, Ex Adjustment the PAT came in at `1,823cr
On the operating front, the utilization rate came in at 83.6% V/s 83.5% in
1QFY2016 while the attrition rate came in at 16.3% V/s 16.5% in 1QFY2016.
Strong client addition in the quarter continued: US$50mn + clients up by 1,
US$30mn + clients up by 3, US$20mn + clients up by 2. Overall, the company
has won 10 Transformational engagements during this quarter in excess of
US$1bn in TCV.
The stock has witnessed a huge correction post warning for a few soft quarters;
however we believe that the stock has corrected significantly and hence we
recommend a buy with a price target of `1,132.
Market Outlook
October 20, 2015
Y/E
Sales OPM
PAT
EPS ROE P/E P/BV EV/EBITDA EV/Sales
March
(` cr)
(%)
(` cr)
(`)
(%)
(x)
(x)
(x)
(x)
FY2015E
42,038
23.5
7,960
56.4
23.2
15.2
3.5
10.1
2.4
FY2016E
47,053
23.5
8,879
62.9
19.8
13.6
2.7
8.0
1.9
Preview
Hero Motocorp (CMP: `2,614 / TP: ` /Upside: )
Hero Motocorp is slated to announce its 2QFY2016 results today. Hero’s topline is
expected to decline 4% yoy to Rs 6,657 cr. Hero’s volumes have declined 7%
during the quarter largely due to subdued two wheeler industry and market share
loss in the scooter segment. Realisation/vehicle is estimated to grow 3% mainly
due to price hikes. On the EBIDTA front, the margins are likely to improve 120 bp
yoy to 14.7% on account of cost control initiatives under the margin improvement
programme “Leap”. EBIDTA is estimated to grow 5% yoy to Rs 980 cr. However
higher depreciation on account of capacity expansion and lower other income, we
expect the Net Profit to decline 5% yoy to Rs 726 cr. We currently have Neutral
rating on the stock.
Y/E
Sales OPM
PAT
EPS ROE P/E P/BV EV/EBITDA EV/Sales
March
(` cr)
(%)
(` cr)
(`)
(%)
(x)
(x)
(x)
(x)
FY2016E
28,500
14.1
2,933
146.9
37.8
17.8
6.7
12.0
1.6
FY2017E
32,764
14.3
3,335
167.0
36.5
15.7
5.7
9.9
1.4
Sanofi India (CMP: `3,929 / TP: /Upside:)
For, 3QCY2015, we expect the company to post a yoy growth of 10% to end the
period at `536cr V/s `487cr. On the operating front, the gross margins are
expected to come in at 48.3% same as last year, while the OPM’s are expected to
come in at 17.8% V/s 15.7% in 3QCY2014. Thus the reported net profit is
expected to come in at `70cr V/s `62cr, a yoy growth of 12.9%. We maintain our
neutral stance on the stock.
Y/E
Sales OPM
PAT
EPS ROE P/E P/BV EV/EBITDA EV/Sales
March
(` cr)
(%)
(` cr)
(`)
(%)
(x)
(x)
(x)
(x)
FY2015E
2,156
15.1
253
109.7
18.4
35.8
4.9
25.7
3.9
FY2016E
2,455
16.8
308
133.9
22.5
29.3
4.0
19.2
3.2
Economic and Political News
Govt raises wheat import tax to 25% from 10%
RBI chief slams IMF for 'applauding' easy money policies
September coal imports slump 27% to 12.6 mn tonne
Corporate News
Maggi manufacture, sale allowed in Karnataka
Indian Hotels board approves subsidiary amalgamation
Mahindra & Mahindra forays into branded pulses business
Market Outlook
October 20, 2015
Top Picks ★★★★★
Large Cap
Market Cap
CMP
Target
Upside
Company
Rationale
(` Cr)
(`)
(`)
(%)
Robust US sales along with the acquisations, will aid the growth
Aurobindo
47,033
805
872
8.3
and stable margins.
Healthy pace of branch expansion, backed by distribution
Axis Bank
1,20,486
507
701
38.3
network.
Robust franchise and capital adequacy position will help the
ICICI Bank
1,66,797
287
370
28.8
bank to outperform the industry average.
Back on the growth trend; expect a long term growth of 14% to
Infosys
2,55,466
1,112
1,306
17.4
be a US$20bn in FY2020.
Government thrust on Renewable sector and strong order book
Inox Wind
8,787
396
505
27.5
would drive future growth.
LICHF continues to grow its retail loan book at a healthy pace
LIC HFL
24,098
478
570
19.4
with improvement in asset quality.
Direct beneficiary of the huge investments lined up in the power
Power Grid
69,763
133
170
27.5
transmission sector.
Growth to pick up from 2HFY2017, attractive given the risk-
TCS
4,90,016
2,487
3,165
27.3
reward.
Tech Mahindra
52,159
542
646
19.2
Acquisitions, to drive growth, normalised valuations attractive.
An improving liability franchise, capital adequacy well above
Yes Bank
32,262
770
953
23.8
Basel III requirements and lowest NPA ratio in the industry.
Source: Company, Angel Research
Mid Cap
Market Cap
CMP
Target
Upside
Company
Rationale
(` Cr)
(`)
(`)
(%)
Bajaj Electricals
2,547
252
341
35.1
Visible turnaround in E&P business to drive the earnings.
Garware Wall Ropes
766
350
390
11.3
Higher exports & easing material prices to drive profitability.
Comfortable balance sheet to support strong growth; this
MBL Infrastructures
973
235
360
53.5
coupled with attractive valuation to lead to rerating.
New product introductions and increased sourcing by clients to
Minda Industries
816
515
652
26.7
enable outpace industry growth.
Strong brand & quality teaching with innovative technologies &
MT Educare
575
144
169
17.0
higher government educational spending to boost growth.
Earnings boost on back of stable material prices and favorable
Radico Khaitan
1,261
95
112
18.2
pricing environment. Valuation discount to peers provides
additional comfort.
Structural shift in the Lighting industry towards LED lighting will
Surya Roshni
609
139
183
31.7
drive growth.
Tree House
1,274
301
449
49.1
Robust expansion plan for pre-schools to drive growth.
Source: Company, Angel Research
Market Outlook
October 20, 2015
Quarterly Bloomberg Brokers Consensus Estimate
Hero MotoCorp Ltd - October 20, 2015
Particulars (` cr)
2QFY16E
2QFY15
y-o-y (%)
1QFY16
q-o-q (%)
Net sales
6,665
6,864
(2.9)
6,856
(2.8)
EBITDA
989
935
5.8
1,048
(5.6)
EBITDA margin (%)
14.8
13.6
15.3
Net profit
716
763
(6.2)
750
(4.5)
ACC Ltd - October 20, 2015
Particulars (` cr)
3QFY16E
3QFY15
y-o-y (%)
2QFY16
q-o-q (%)
Net sales
2,753
2,742
0.4
2,961
(7.0)
EBITDA
259
379
(31.5)
334
(22.2)
EBITDA margin (%)
9.4
13.8
11.3
Net profit
116
205
(43.6)
131
(12.1)
Federal Bank Ltd - October 20, 2015
Particulars (` cr)
2QFY16E
2QFY15
y-o-y (%)
1QFY16
q-o-q (%)
PAT
244
240
1.6
141
72.7
Mahindra & Mahindra Ltd - October 21, 2015
Particulars (` cr)
2QFY16E
2QFY15
y-o-y (%)
1QFY16
q-o-q (%)
Net sales
8,588
9,418
(8.8)
9,708
(11.5)
EBITDA
1,121
1,009
11.1
1,252
(10.5)
EBITDA margin (%)
13.1
10.7
12.9
Net profit
911
947
(3.7)
852
6.9
Bajaj Auto Ltd - October 21, 2015
Particulars (` cr)
2QFY16E
2QFY15
y-o-y (%)
1QFY16
q-o-q (%)
Net sales
6,020
5,827
3.3
5,505
9.4
EBITDA
1,265
1,127
12.3
1,140
11.0
EBITDA margin (%)
21.0
19.3
20.7
Net profit
901
591
52.4
1,015
(11.2)
HDFC Bank Ltd - October 21, 2015
Particulars (` cr)
2QFY16E
2QFY15
y-o-y (%)
1QFY16
q-o-q (%)
PAT
2,882
2,381
21.0
2,696
6.9
Wipro Ltd Consol - October 21, 2015
Particulars (` cr)
2QFY16E
2QFY15
y-o-y (%)
1QFY16
q-o-q (%)
Net sales
12,813
11,684
9.7
12,238
4.7
EBITDA
2,713
2,481
9.3
2,606
4.1
EBITDA margin (%)
21.2
21.2
21.3
Net profit
2,227
2,085
6.8
2,188
1.8
Market Outlook
October 20, 2015
JSW Steel Ltd Consol - October 21, 2015
Particulars (` cr)
2QFY16E
2QFY15
y-o-y (%)
1QFY16
q-o-q (%)
Net sales
11,058
13,692
(19.2)
11,382
(2.8)
EBITDA
1,586
2,791
(43.2)
1,627
(2.5)
EBITDA margin (%)
14.3
20.4
14.3
Net profit
(187)
749
0.0
(107)
0.0
Cairn India Ltd Consol - October 21, 2015
Particulars (` cr)
2QFY16E
2QFY15
y-o-y (%)
1QFY16
q-o-q (%)
Net sales
2,263
3,982
(43.2)
2,627
(13.9)
EBITDA
940
2,656
(64.6)
1,290
(27.1)
EBITDA margin (%)
41.5
66.7
49.1
Net profit
588
2,278
(74.2)
835
(29.5)
Idea Cellular Ltd Consol - October 21, 2015
Particulars (` cr)
2QFY16E
2QFY15
y-o-y (%)
1QFY16
q-o-q (%)
Net sales
8,732
7,566
15.4
8,795
(0.7)
EBITDA
3,080
2,491
23.7
3,228
(4.6)
EBITDA margin (%)
35.3
32.9
36.7
Net profit
823
756
8.9
931
(11.6)
Asian Paints Ltd Consol - October 23, 2015
Particulars (` cr)
2QFY16E
2QFY15
y-o-y (%)
1QFY16
q-o-q (%)
Net sales
3,905
3,587
8.9
3,578
9.1
EBITDA
670
536
25.0
684
(1.9)
EBITDA margin (%)
17.2
15.0
19.1
Net profit
439
347
26.5
455
(3.5)
Market Outlook
October 20, 2015
Key Upcoming Events
Result Calendar
Date
Company
Oct 20, 2015
Hero Motocorp, ACC, Federal Bank, Mphasis, Jyothy Laboratories, Aventis
Oct 21, 2015
M&M, Bajaj Auto, HDFC Bank, Wipro, KPIT Cummins, NIIT, JSW Steel , Cairn India
Oct 22, 2015
Cadila Healthcare
Oct 23, 2015
Rallis, Asian Paints
Oct 24, 2015
Godrej Consumer, Persistent
Oct 26, 2015
United Phosphorus, Blue Star, HDFC, Hindustan Media Ventures, Hitachi
Oct 27, 2015
Maruti, TVS Motor, CEAT, Thermax, Axis Bank, Sesa Goa, Lupin, Alembic Pharma
Exide Industries, Amara Raja Batteries, Ambuja Cements, Syndicate Bank, Dabur India, Sun TV Network, HT Media,
Oct 28, 2015
Kirloskar Engines India Ltd, Elecon Engineering, Transport Corporation of India
Bharat Forge, Crompton Greaves, Shriram Trans., Nestle, Colgate, MRF, L G Balakrishnan & Bros, Dr Reddy's,
Oct 29, 2015
Glenmark Pharma., Dishman Pharma
Oct 30, 2015
Apollo Tyres, Subros, ICICI Bank, Kotak Mah. Bank, Indoco Remedies
Source: Bloomberg, Angel Research
Global economic events release calendar
Date
Time
Country
Event Description
Unit
Period
Bloomberg Data
Last Reported Estimated
Oct 20, 2015 6:00PM US
Housing Starts
Thousands
Sep
1,126.00
1,147.00
6:00PM US
Building permits
Thousands
Sep
1,170.00
1,165.00
Oct 22, 2015 6:00PM US
Initial Jobless claims
Thousands
Oct 17
255.00
265.00
7:30PM Euro Zone
Euro-Zone Consumer Confidence
Value
Oct A
(7.10)
(7.40)
7:30PM US
Existing home sales
Million
Sep
5.31
5.37
5:15PM Euro Zone
ECB announces interest rates
%
Oct 22
0.05
0.05
Oct 23, 2015 1:00PM Germany
PMI Services
Value
Oct P
54.10
53.90
1:00PM Germany
PMI Manufacturing
Value
Oct P
52.30
51.70
Oct 26, 2015 7:30PM US
New home sales
Thousands
Sep
552.00
549.00
Oct 27, 2015 3:00PM UK
GDP (YoY)
% Change
3Q A
2.40
--
7:30PM US
Consumer Confidence
S.A./ 1985=100
Oct
103.04
101.00
Oct 28, 2015 11:30PM US
FOMC rate decision
%
Oct 28
0.25
0.25
Oct 29, 2015 2:25PM Germany
Unemployment change (000's)
Thousands
Oct
2.00
--
6:00PM US
GDP Qoq (Annualised)
% Change
3Q A
3.90
1.90
Nov 1, 2015
6:30AM China
PMI Manufacturing
Value
Oct
49.80
--
Nov 2, 2015
3:00PM UK
PMI Manufacturing
Value
Oct
51.50
--
Nov 5, 2015
5:30PM UK
BOE Announces rates
% Ratio
Nov 5
0.50
0.50
Source: Bloomberg, Angel Research
Market Outlook
October 20, 2015
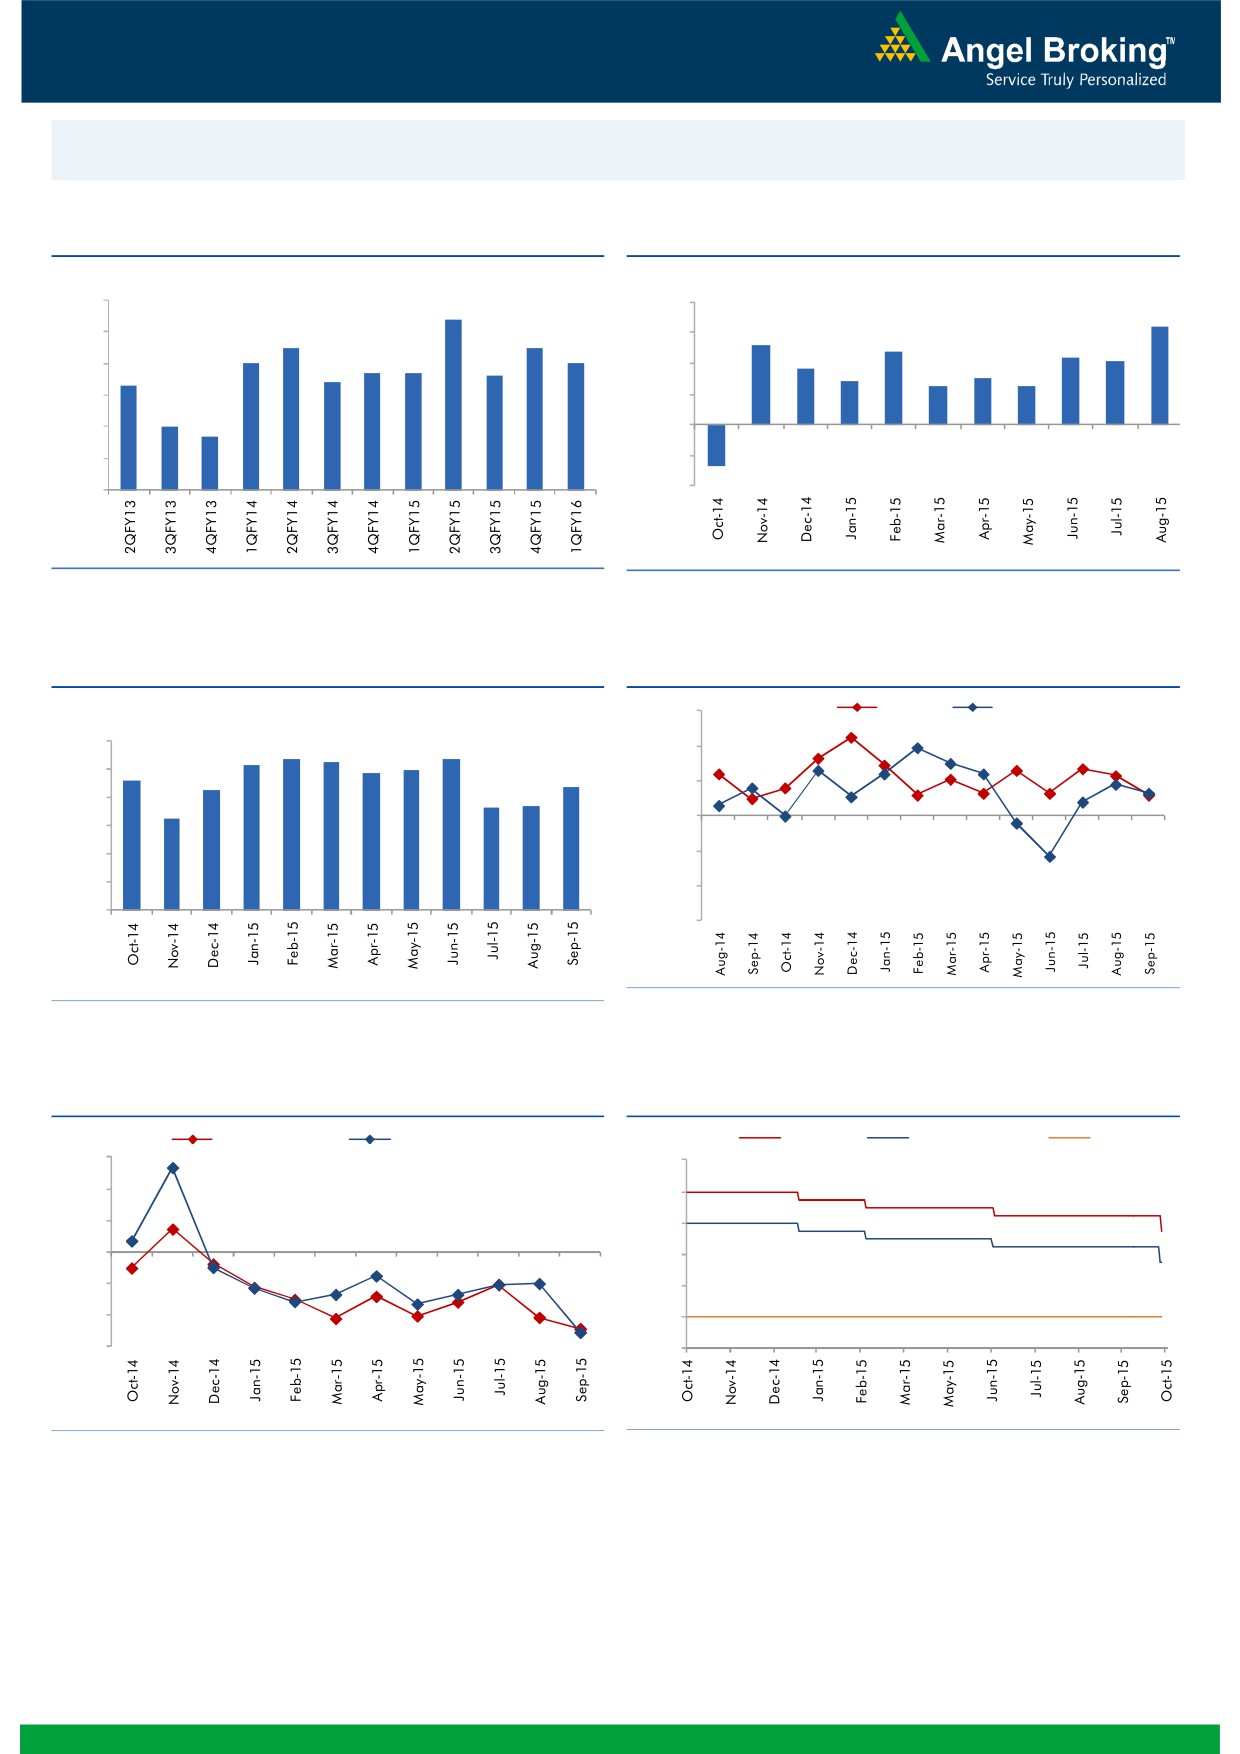
Macro watch
Exhibit 1: Quarterly GDP trends
Exhibit 2: IIP trends
(%)
(%)
9.0
8.4
8.0
6.4
7.5
7.5
5.2
8.0
6.0
4.8
7.0
7.0
4.4
4.1
6.7
6.7
6.6
3.6
7.0
6.4
4.0
2.8
3.0
6.3
2.5
2.5
6.0
2.0
5.0
4.7
5.0
-
4.0
(2.0)
3.0
(4.0)
(2.7)
Source: CSO, Angel Research
Source: MOSPI, Angel Research
Exhibit 3: Monthly CPI inflation trends
Exhibit 4: Manufacturing and services PMI
(%)
56.0
Mfg. PMI
Services PMI
6.0
5.4
5.3
5.4
54.0
5.2
5.0
4.9
4.6
5.0
4.3
4.4
52.0
3.7
3.7
4.0
3.3
50.0
3.0
2.0
48.0
1.0
46.0
-
44.0
Source: Market, Angel Research; Note: Level above 50 indicates expansion
Source: MOSPI, Angel Research
Exhibit 5: Exports and imports growth trends
Exhibit 6: Key policy rates
(%)
Exports yoy growth
Imports yoy growth
(%)
Repo rate
Reverse Repo rate
CRR
30.0
9.00
20.0
8.00
10.0
7.00
0.0
6.00
(10.0)
5.00
(20.0)
4.00
(30.0)
3.00
Source: Bloomberg, Angel Research
Source: RBI, Angel Research
Market Outlook
October 20, 2015
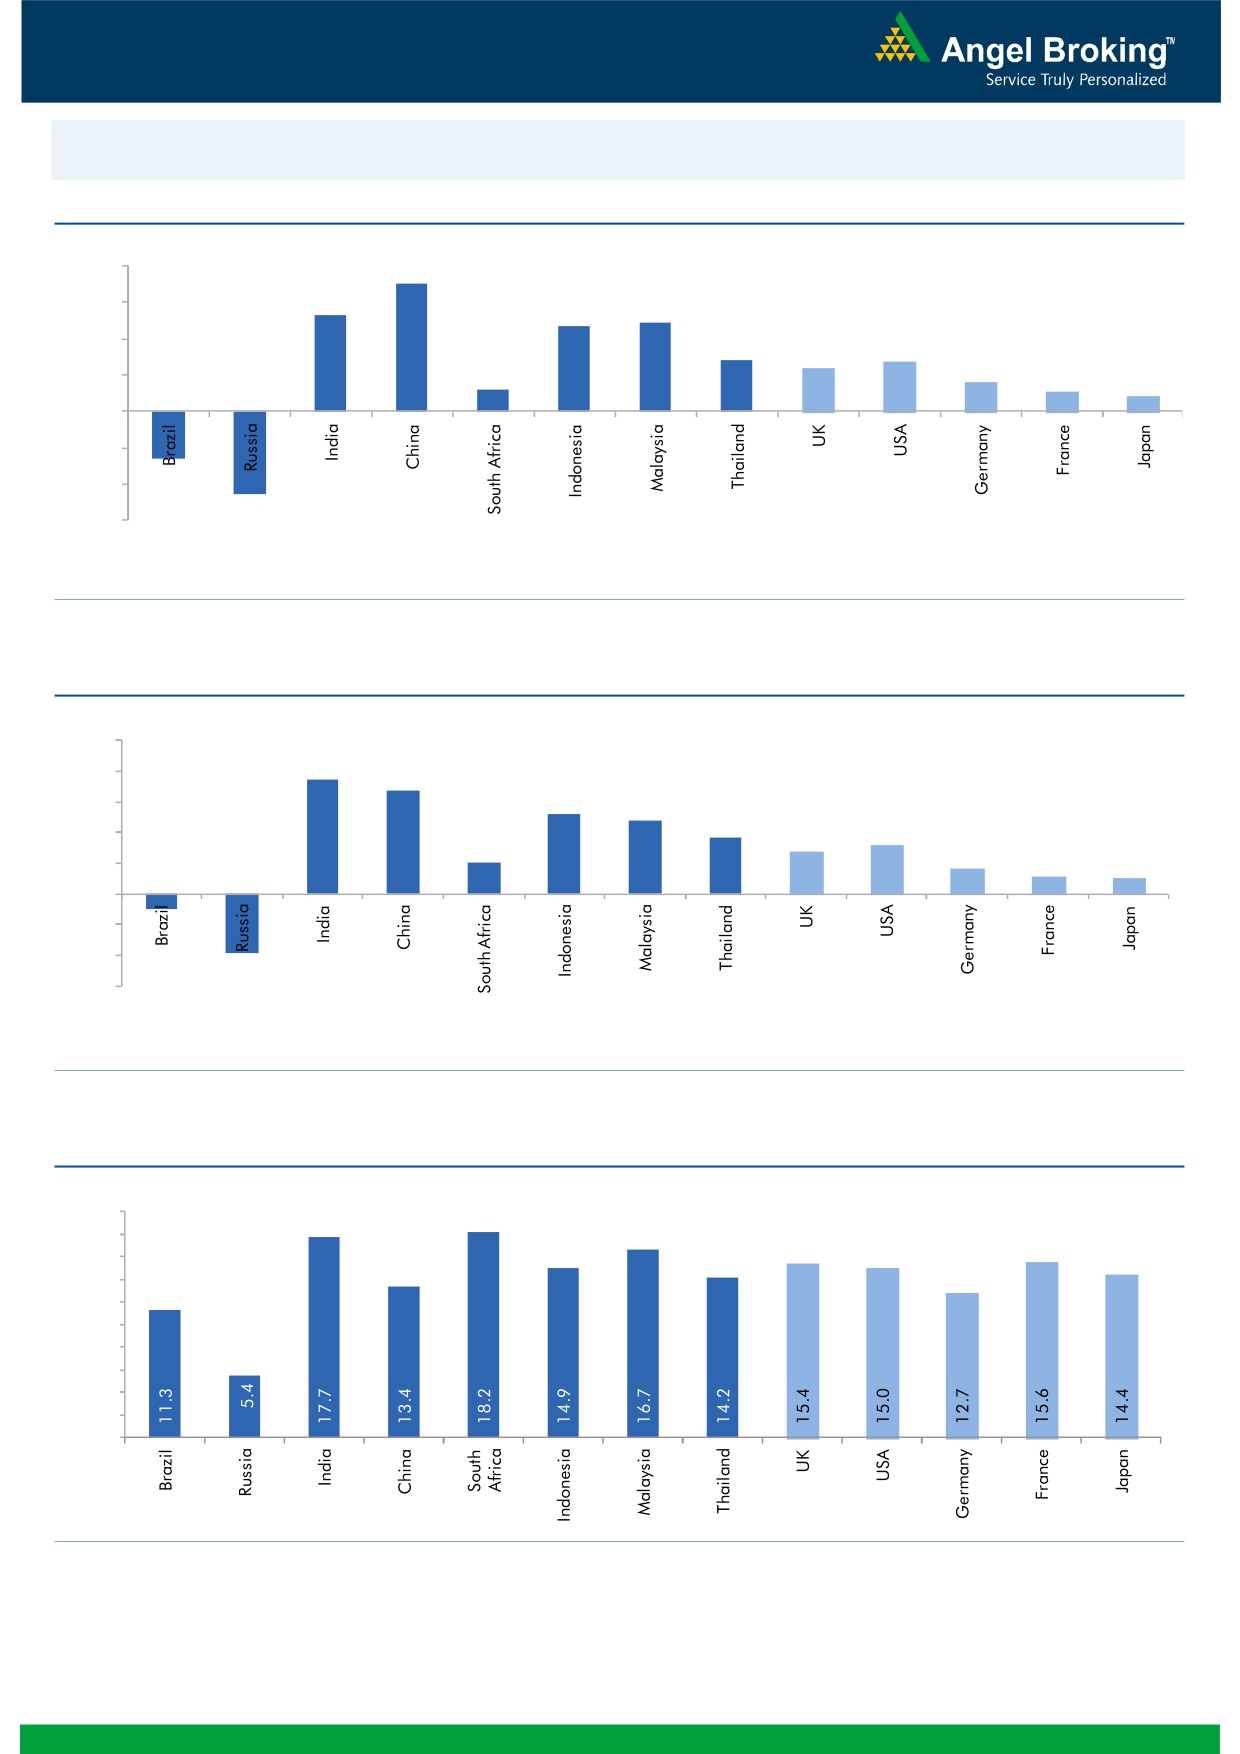
Global watch
Exhibit 1: Latest quarterly GDP Growth (%, yoy) across select developing and developed countries
(%)
8.0
7.0
6.0
5.3
4.9
4.7
4.0
2.8
2.7
2.4
1.6
2.0
1.2
1.1
0.8
-
(2.0)
(2.6)
(4.0)
(4.6)
(6.0)
Source: Bloomberg, Angel Research
Exhibit 2: 2015 GDP Growth projection by IMF (%, yoy) across select developing and developed countries
(%)
10.0
7.5
8.0
6.8
5.2
6.0
4.8
3.7
3.1
4.0
2.7
2.0
1.6
1.2
1.0
2.0
-
(2.0)
(4.0)
(1.0)
(3.8)
(6.0)
Source: IMF, Angel Research
Exhibit 3: One year forward P-E ratio across select developing and developed countries
(x)
20.0
18.0
16.0
14.0
12.0
10.0
8.0
6.0
4.0
2.0
-
Source: IMF, Angel Research
Market Outlook
October 20, 2015
Exhibit 4: Relative performance of indices across globe
Returns (%)
Country
Name of index
Closing price
1M
3M
1YR
Brazil
Bovespa
47,447
(2.3)
(9.4)
(18.1)
Russia
Micex
1,716
(0.8)
4.9
26.2
India
Nifty
8,275
5.1
(3.9)
5.0
China
Shanghai Composite
3,387
5.6
(14.9)
41.4
South Africa
Top 40
47,720
4.7
1.4
14.2
Mexico
Mexbol
44,523
1.7
(2.3)
2.9
Indonesia
LQ45
785
7.8
(6.2)
(6.3)
Malaysia
KLCI
1,718
4.8
(0.2)
(4.4)
Thailand
SET 50
917
1.4
(5.7)
(10.9)
USA
Dow Jones
17,231
3.3
(4.8)
5.1
UK
FTSE
6,352
2.7
(6.4)
(0.3)
Japan
Nikkei
18,131
(0.7)
(11.1)
14.9
Germany
DAX
10,164
(0.6)
(12.4)
16.6
France
CAC
4,704
1.1
(7.9)
13.1
Source: Bloomberg, Angel Research
Stock Watch
October 20, 2015
Company Name
Reco
CMP
Target
Mkt Cap
Sales ( Čcr )
OPM(%)
EPS (Č)
PER(x)
P/BV(x)
RoE(%)
EV/Sales(x)
(Č)
Price ( Č)
( Č cr )
FY16E FY17E
FY16E
FY17E
FY16E
FY17E
FY16E
FY17E
FY16E
FY17E
FY16E
FY17E
FY16E
FY17E
Agri / Agri Chemical
Rallis
Neutral
214
-
4,161
2,075
2,394
14.4
14.4
9.5
11.0
22.5
19.5
4.5
3.9
21.1
21.3
2.1
1.8
United Phosphorus
Accumulate
488
510
20,916
13,698
15,752
17.6
17.6
32.1
38.5
15.2
12.7
3.0
2.5
21.4
21.3
1.6
1.3
Auto & Auto Ancillary
Ashok Leyland
Accumulate
96
97
27,335
18,186
21,529
10.8
11.2
3.3
4.5
29.1
21.3
5.0
4.6
17.3
21.6
1.4
1.1
Bajaj Auto
Accumulate
2,460
2,438
71,177
23,544
27,245
19.8
19.8
127.0
143.4
19.4
17.2
5.9
5.0
30.3
29.4
2.3
2.0
Eicher Motors
Buy
18,241
22,859
49,511
11,681
15,550
15.3
16.9
358.5
564.3
50.9
32.3
15.3
11.4
29.8
34.9
4.1
3.1
Hero Motocorp
Accumulate
2,614
2,672
52,189
28,500
32,764
14.1
14.3
146.9
167.0
17.8
15.7
6.7
5.7
37.8
36.5
1.5
1.3
L G Balakrishnan & Bros Neutral
491
-
771
1,254
1,394
11.6
11.8
35.9
41.7
13.7
11.8
1.9
1.6
13.5
13.8
0.7
0.6
Mahindra and Mahindra Accumulate
1,280
1,383
79,469
38,337
43,069
13.0
13.4
52.9
63.5
24.2
20.2
3.6
3.2
15.0
15.9
1.6
1.4
Maruti
Accumulate
4,460
4,735
134,740
58,102
68,587
16.7
16.9
182.0
225.5
24.5
19.8
4.9
4.2
19.9
21.0
2.1
1.7
Minda Industries
Buy
515
652
816
2,567
2,965
7.3
8.0
38.8
54.3
13.3
9.5
1.9
1.6
14.4
16.8
0.4
0.4
Rane Brake Lining
Buy
312
366
247
454
511
11.1
11.4
23.8
28.1
13.1
11.1
1.9
1.7
14.2
15.3
0.6
0.6
Setco Automotive
Neutral
225
-
602
594
741
12.7
13.7
8.4
15.8
26.8
14.3
2.8
2.4
10.4
16.9
1.5
1.2
Tata Motors
Neutral
379
-
109,281
264,038
297,882
13.8
13.9
34.5
38.9
11.0
9.7
1.8
1.6
17.6
16.8
0.5
0.5
TVS Motor
Neutral
247
-
11,732
11,702
13,713
6.8
7.7
10.1
14.5
24.5
17.0
6.0
4.8
24.5
28.3
0.9
0.8
Amara Raja Batteries
Neutral
1,021
-
17,432
5,101
6,224
17.8
17.6
31.1
39.2
32.8
26.0
8.1
6.5
24.8
24.8
3.2
2.6
Exide Industries
Neutral
156
-
13,256
7,363
8,247
13.7
14.5
6.6
7.7
23.6
20.3
3.0
2.7
12.6
13.3
1.5
1.3
Apollo Tyres
Neutral
194
-
9,865
12,576
12,978
16.8
16.1
22.3
19.9
8.7
9.7
1.5
1.3
17.2
13.4
0.8
0.9
Ceat
Neutral
1,247
-
5,046
6,041
6,597
14.3
14.2
101.5
116.6
12.3
10.7
2.5
2.0
20.0
19.1
1.0
0.9
JK Tyres
Neutral
106
-
2,406
7,446
7,669
15.2
14.0
19.6
18.4
5.4
5.8
1.4
1.1
25.2
19.5
0.7
0.6
Swaraj Engines
Neutral
877
-
1,089
593
677
14.5
14.8
51.2
60.8
17.1
14.4
4.0
3.6
23.3
24.8
1.7
1.4
Subros
Neutral
91
-
546
1,268
1,488
11.6
11.9
3.7
6.6
24.6
13.8
1.6
1.5
6.8
11.4
0.7
0.6
Indag Rubber
Neutral
185
-
485
283
329
17.0
17.2
13.0
15.4
14.3
12.0
3.1
2.6
21.8
21.6
1.3
1.1
Capital Goods
ACE
Neutral
46
-
456
660
839
4.7
8.2
1.0
3.9
46.1
11.8
1.4
1.3
3.2
11.3
0.7
0.6
BEML
Neutral
1,222
-
5,088
3,277
4,006
6.0
8.9
29.2
64.3
41.8
19.0
2.3
2.1
5.7
11.7
1.7
1.3
BGR Energy
Neutral
118
-
854
3,615
3,181
9.5
9.4
16.7
12.4
7.1
9.6
0.7
0.7
10.0
7.0
0.6
0.8
BHEL
Neutral
214
-
52,403
33,722
35,272
10.8
11.7
10.5
14.2
20.4
15.1
1.5
1.4
7.0
9.0
1.5
1.5
Blue Star
Buy
348
387
3,131
3,649
4,209
5.0
5.9
9.2
14.7
38.1
23.6
6.9
6.5
9.1
17.5
0.9
0.8
Crompton Greaves
Buy
187
204
11,717
13,484
14,687
4.9
6.2
4.5
7.1
41.5
26.3
2.9
2.7
7.2
10.8
0.9
0.8
Inox Wind
Buy
396
505
8,787
4,980
5,943
17.0
17.5
26.6
31.6
14.9
12.5
4.5
3.3
35.0
30.0
1.7
1.4
Stock Watch
October 20, 2015
Company Name
Reco
CMP
Target
Mkt Cap
Sales ( Čcr )
OPM(%)
EPS (Č)
PER(x)
P/BV(x)
RoE(%)
EV/Sales(x)
(Č)
Price ( Č)
( Č cr )
FY16E
FY17E
FY16E
FY17E
FY16E
FY17E
FY16E
FY17E
FY16E
FY17E
FY16E
FY17E
FY16E
FY17E
Capital Goods
KEC International
Neutral
144
-
3,696
8,791
9,716
6.1
6.8
5.4
8.2
26.6
17.5
2.7
2.4
10.0
14.0
0.6
0.6
Thermax
Neutral
850
-
10,131
6,413
7,525
7.4
8.5
30.5
39.3
27.9
21.6
4.3
3.7
15.0
17.0
1.6
1.3
Cement
ACC
Accumulate
1,397
1,548
26,221
11,856
14,092
14.5
17.8
47.6
76.1
29.3
18.4
3.0
2.8
10.6
15.7
2.0
1.6
Ambuja Cements
Accumulate
210
233
32,629
10,569
12,022
20.7
22.2
8.7
10.7
24.2
19.7
3.1
2.9
13.0
15.2
2.7
2.3
India Cements
Buy
84
112
2,574
4,716
5,133
15.9
16.9
3.7
7.5
22.7
11.2
0.8
0.8
3.8
7.3
0.8
0.7
JK Cement
Buy
651
767
4,554
4,056
4,748
14.5
17.0
22.6
41.1
28.8
15.9
2.6
2.3
9.3
15.3
1.5
1.3
J K Lakshmi Cement
Buy
372
430
4,381
2,947
3,616
16.7
19.9
11.5
27.2
32.4
13.7
3.1
2.7
9.8
20.8
1.9
1.5
Mangalam Cements
Neutral
229
-
610
1,053
1,347
10.5
13.3
8.4
26.0
27.2
8.8
1.2
1.1
4.3
12.5
1.0
0.7
Orient Cement
Buy
174
183
3,561
1,854
2,524
21.2
22.2
7.7
11.1
22.6
15.7
3.2
2.8
13.3
15.7
2.4
1.7
Ramco Cements
Accumulate
349
350
8,297
4,036
4,545
20.8
21.3
15.1
18.8
23.1
18.5
2.8
2.5
12.9
14.3
2.4
2.1
Shree Cement^
Neutral
12,268
-
42,740
7,150
8,742
26.7
28.6
228.0
345.5
53.8
35.5
7.9
6.6
15.7
20.3
5.4
4.3
UltraTech Cement
Buy
2,903
3,282
79,666
27,562
31,548
20.4
22.3
111.9
143.3
25.9
20.3
3.7
3.2
15.2
16.8
2.8
2.4
Construction
ITNL
Neutral
93
-
3,068
7,360
8,825
34.0
35.9
1.0
5.0
93.3
18.7
0.4
0.4
0.3
1.4
3.8
3.7
KNR Constructions
Neutral
615
-
1,729
915
1,479
14.3
13.9
20.3
37.2
30.3
16.5
2.8
2.4
9.6
15.6
1.9
1.2
Larsen & Toubro
Buy
1,581
2,013
147,105
68,920
82,446
10.9
11.5
57.0
73.0
27.7
21.7
2.5
2.4
13.6
15.5
2.2
1.9
Gujarat Pipavav Port
Neutral
189
-
9,152
721
784
53.1
53.6
8.2
9.1
23.0
20.8
3.7
3.0
20.0
18.3
12.3
10.9
MBL Infrastructures
Buy
235
360
973
2,313
2,797
12.2
14.6
19.0
20.0
12.4
11.7
1.3
1.2
11.3
10.6
1.1
1.0
Nagarjuna Const.
Neutral
82
-
4,578
7,892
8,842
8.3
9.1
2.4
5.3
34.3
15.5
1.4
1.3
4.2
8.6
0.7
0.6
PNC Infratech
Neutral
514
-
2,636
1,798
2,132
13.2
13.5
22.0
30.0
23.4
17.1
2.1
1.9
11.5
11.4
1.4
1.2
Simplex Infra
Neutral
346
-
1,712
6,241
7,008
10.4
10.7
20.0
36.0
17.3
9.6
1.4
1.3
6.8
11.1
0.7
0.6
Financials
Allahabad Bank
Neutral
78
-
4,705
8,438
9,521
2.8
2.8
21.9
27.0
3.6
2.9
0.4
0.3
10.2
11.5
-
-
Axis Bank
Buy
507
701
120,486
26,941
32,298
3.5
3.6
37.4
46.4
13.6
10.9
2.7
2.4
18.7
20.0
-
-
Bank of Baroda
Neutral
175
-
40,392
19,027
21,737
1.9
2.0
16.9
24.5
10.4
7.2
1.0
0.9
9.1
12.1
-
-
Bank of India
Neutral
142
-
11,221
16,438
18,706
1.9
2.0
19.2
40.9
7.4
3.5
0.4
0.4
4.5
9.1
-
-
Canara Bank
Neutral
299
-
16,208
15,491
17,269
2.0
2.0
61.6
70.9
4.8
4.2
0.6
0.5
10.5
11.1
-
-
Dena Bank
Neutral
43
-
2,749
3,498
3,977
2.1
2.3
7.8
10.7
5.5
4.0
0.4
0.4
6.5
8.4
-
-
Federal Bank
Neutral
65
-
11,157
3,527
4,135
3.0
3.1
5.2
6.7
12.5
9.7
1.3
1.2
10.8
12.7
-
-
HDFC
Neutral
1,315
-
207,386
10,883
12,799
3.5
3.4
43.0
50.6
30.6
26.0
6.1
5.5
25.9
26.7
-
-
HDFC Bank
Buy
1,096
1,255
276,044
38,059
46,851
4.4
4.5
50.0
62.7
21.9
17.5
3.8
3.3
18.8
20.2
-
-
Stock Watch
October 20, 2015
Company Name
Reco
CMP
Target
Mkt Cap
Sales ( Čcr )
OPM(%)
EPS (Č)
PER(x)
P/BV(x)
RoE(%)
EV/Sales(x)
(Č)
Price ( Č)
( Č cr )
FY16E
FY17E
FY16E
FY17E
FY16E
FY17E
FY16E
FY17E
FY16E
FY17E
FY16E
FY17E
FY16E
FY17E
Financials
ICICI Bank
Buy
287
370
166,797
35,810
41,871
3.4
3.5
22.0
26.2
13.1
11.0
2.3
1.9
15.0
15.6
-
-
IDBI Bank
Neutral
83
-
13,337
9,860
10,978
1.8
1.9
9.3
15.6
9.0
5.3
0.6
0.5
6.4
10.1
-
-
Indian Bank
Neutral
140
-
6,726
6,267
7,171
2.4
2.5
25.4
32.1
5.5
4.4
0.5
0.4
8.0
9.3
-
-
LIC Housing Finance
Buy
478
570
24,098
2,934
3,511
2.3
2.3
30.9
36.8
15.5
13.0
2.5
2.2
16.8
17.5
-
-
Oriental Bank
Neutral
144
-
4,330
7,730
8,595
2.4
2.5
38.8
47.4
3.7
3.1
0.3
0.3
8.6
9.8
-
-
Punjab Natl.Bank
Neutral
137
-
26,921
23,446
26,624
2.8
2.9
17.8
27.5
7.7
5.0
0.8
0.6
8.5
12.1
-
-
South Ind.Bank
Neutral
23
-
3,045
1,930
2,215
2.4
2.4
2.6
3.6
8.7
6.3
0.9
0.8
9.9
12.5
-
-
St Bk of India
Buy
255
307
197,563
83,847
96,307
2.8
2.8
20.1
25.1
12.7
10.1
1.4
1.2
11.5
13.1
-
-
Union Bank
Neutral
174
-
11,927
12,755
14,439
2.3
2.4
31.5
39.9
5.5
4.4
0.6
0.5
9.9
11.6
-
-
Vijaya Bank
Neutral
38
-
3,265
3,594
3,969
1.8
1.9
5.8
7.1
6.5
5.4
0.6
0.5
8.2
9.3
-
-
Yes Bank
Buy
770
953
32,262
7,204
9,078
3.2
3.2
57.8
69.5
13.3
11.1
2.4
2.0
19.6
22.6
-
-
FMCG
Asian Paints
Neutral
879
-
84,318
16,553
19,160
16.0
16.2
17.7
21.5
49.7
40.9
13.2
11.9
29.4
31.2
4.4
3.8
Britannia
Neutral
3,302
-
39,617
8,065
9,395
9.6
10.2
47.2
65.5
69.9
50.4
23.3
22.0
38.3
41.2
4.1
3.6
Colgate
Neutral
939
-
25,530
4,836
5,490
19.5
19.7
48.5
53.2
19.4
17.6
14.2
12.4
99.8
97.5
5.2
4.6
Dabur India
Neutral
273
-
47,873
9,370
10,265
17.1
17.2
7.3
8.1
37.2
33.6
11.2
9.1
33.7
30.6
5.1
4.6
GlaxoSmith Con*
Neutral
6,037
-
25,387
4,919
5,742
17.2
17.4
168.3
191.2
35.9
31.6
10.2
8.7
28.8
28.9
4.6
3.9
Godrej Consumer
Neutral
1,211
-
41,237
10,168
12,886
16.1
16.1
32.1
38.4
37.7
31.5
7.7
7.1
19.7
21.0
4.0
3.2
HUL
Neutral
794
-
171,735
34,940
38,957
17.5
17.7
20.8
24.7
38.2
32.1
42.4
33.9
110.5
114.2
4.7
4.2
ITC
Buy
351
409
281,650
41,068
45,068
37.8
37.4
13.9
15.9
25.2
22.1
8.5
7.4
34.1
33.8
5.8
5.3
Marico
Neutral
402
-
25,916
6,551
7,766
15.7
16.0
10.4
12.5
38.7
32.1
11.2
9.3
33.2
32.4
3.8
3.2
Nestle*
Accumulate
6,476
6,646
62,440
11,291
12,847
22.2
22.3
158.9
184.6
40.8
35.1
21.3
19.2
55.0
57.3
5.2
4.5
Tata Global
Buy
135
144
8,494
8,635
9,072
9.8
9.9
6.5
7.6
20.7
17.7
2.1
2.0
6.8
7.4
0.9
0.8
IT
HCL Tech^
Buy
857
1,132
120,533
42,038
47,503
23.5
23.5
56.4
62.9
15.2
13.6
3.5
2.7
23.2
19.8
2.7
2.2
Infosys
Buy
1,112
1,306
255,466
60,250
66,999
28.0
28.0
58.3
63.7
19.1
17.5
4.0
3.4
20.9
19.7
3.6
3.1
TCS
Buy
2,487
3,168
490,016
108,420
123,559
28.8
28.7
127.2
143.9
19.6
17.3
7.8
7.2
39.9
41.8
4.2
3.6
Tech Mahindra
Buy
542
646
52,159
25,566
28,890
16.0
17.0
26.3
31.9
20.6
17.0
3.7
3.2
17.9
18.6
1.9
1.6
Wipro
Buy
577
719
142,587
52,414
58,704
23.7
23.8
38.4
42.3
15.0
13.7
2.9
2.6
19.5
18.0
2.4
2.0
Media
D B Corp
Accumulate
313
356
5,749
2,241
2,495
27.8
27.9
21.8
25.6
14.4
12.2
3.8
3.3
26.7
28.5
2.6
2.3
HT Media
Neutral
95
-
2,208
2,495
2,603
11.2
11.2
7.3
8.6
13.0
11.0
1.0
0.9
7.4
8.1
0.3
0.3
Stock Watch
October 20, 2015
Company Name
Reco
CMP
Target
Mkt Cap
Sales ( Čcr )
OPM(%)
EPS (Č)
PER(x)
P/BV(x)
RoE(%)
EV/Sales(x)
(Č)
Price ( Č)
( Č cr )
FY16E FY17E
FY16E
FY17E
FY16E
FY17E
FY16E
FY17E
FY16E
FY17E
FY16E
FY17E
FY16E
FY17E
Media
Jagran Prakashan
Accumulate
143
156
4,667
1,939
2,122
26.0
26.0
8.3
9.2
17.2
15.5
2.9
2.7
17.5
17.1
2.3
2.1
Sun TV Network
Neutral
372
-
14,648
2,779
3,196
70.2
70.5
22.8
27.3
16.3
13.6
4.0
3.6
26.7
28.3
4.9
4.3
Hindustan Media
Buy
287
292
2,103
920
1,031
20.0
20.0
19.2
20.9
14.9
13.7
2.5
2.1
16.4
15.3
1.4
1.2
Ventures
Metals & Mining
Coal India
Buy
338
400
213,493
72,015
78,415
21.2
21.5
21.7
25.3
15.6
13.4
5.3
5.2
33.1
39.1
2.1
2.0
Hind. Zinc
Neutral
158
-
66,929
15,258
16,495
44.2
45.6
17.6
19.2
9.0
8.3
1.4
1.2
15.9
15.3
1.5
1.0
Hindalco
Neutral
86
-
17,852
104,356
111,186
8.7
9.5
6.7
11.1
12.9
7.8
0.5
0.4
3.5
5.9
0.7
0.6
JSW Steel
Neutral
890
-
21,523
48,125
53,595
18.8
21.0
46.9
97.5
19.0
9.1
0.9
0.9
4.4
9.5
1.3
1.1
NMDC
Neutral
104
-
41,094
8,237
10,893
46.6
44.5
10.0
11.7
10.4
8.9
1.2
1.0
12.5
13.0
4.5
3.4
SAIL
Neutral
56
-
22,963
45,915
53,954
7.2
10.5
1.5
4.4
36.9
12.7
0.5
0.5
2.3
4.1
1.1
1.0
Vedanta
Neutral
108
-
32,063
71,445
81,910
26.2
26.3
12.9
19.2
8.4
5.6
0.6
0.5
7.2
8.9
0.8
0.6
Tata Steel
Neutral
248
-
24,101
136,805
149,228
11.3
11.9
26.4
36.8
9.4
6.7
0.8
0.7
6.0
8.0
0.7
0.6
Oil & Gas
Cairn India
Neutral
160
-
29,979
11,323
12,490
49.4
51.0
20.7
20.7
7.7
7.7
0.5
0.5
6.4
6.1
1.5
0.9
GAIL
Neutral
326
-
41,289
64,856
70,933
9.1
9.6
24.0
28.9
13.6
11.3
1.2
1.1
8.8
9.6
0.7
0.7
ONGC
Neutral
258
-
220,689
154,564
167,321
36.8
37.4
28.6
32.5
9.0
7.9
1.2
1.1
12.7
13.5
1.5
1.4
Petronet LNG
Buy
191
210
14,329
39,007
40,785
3.8
4.2
9.2
11.0
20.9
17.4
2.3
2.1
11.6
12.7
0.4
0.4
Indian Oil Corp
Buy
406
455
98,563
359,607
402,760
5.9
6.1
42.5
48.7
9.6
8.3
1.3
1.1
14.1
14.4
0.4
0.3
Reliance Industries
Accumulate
963
930
311,990
313,085
362,904
13.1
13.8
78.4
92.9
12.3
10.4
1.3
1.2
10.8
11.6
1.3
1.2
Pharmaceuticals
Alembic Pharma
Neutral
718
-
13,535
2,601
3,115
21.2
20.2
20.8
23.9
34.5
30.0
11.1
8.4
37.2
31.8
4.9
4.1
Aurobindo Pharma
Buy
805
872
47,033
14,923
17,162
23.0
23.0
38.2
43.6
21.1
18.5
6.5
4.9
36.0
30.2
3.2
2.7
Aventis*
Neutral
3,930
-
9,050
2,156
2,455
15.1
16.8
109.7
133.9
35.8
29.4
4.9
4.0
18.4
22.5
4.1
3.5
Cadila Healthcare
Neutral
431
-
44,072
10,224
11,840
20.0
21.0
71.0
85.6
6.1
5.0
1.6
1.3
30.1
28.5
4.1
3.5
Cipla
Neutral
687
-
55,181
14,359
16,884
21.3
19.7
28.4
30.5
24.2
22.5
4.3
3.6
19.3
17.5
3.6
3.0
Dr Reddy's
Accumulate
4,337
4,169
73,948
17,903
20,842
22.7
22.8
160.5
189.5
27.0
22.9
5.5
4.5
22.2
21.7
3.7
3.1
Dishman Pharma
Neutral
370
-
2,989
1,716
1,888
20.2
20.2
16.3
21.6
22.7
17.2
2.1
1.9
9.7
11.7
1.6
1.3
GSK Pharma*
Neutral
3,307
-
28,013
2,870
3,158
20.0
22.1
59.5
68.3
55.6
48.4
16.4
16.9
28.5
34.3
9.4
8.6
Indoco Remedies
Neutral
324
-
2,990
1,088
1,262
18.2
18.2
13.1
15.5
24.8
20.9
4.8
4.1
21.2
21.1
2.8
2.4
Ipca labs
Accumulate
766
800
9,663
3,507
4,078
17.6
18.6
25.8
32.0
29.7
23.9
3.8
3.3
13.8
14.9
3.0
2.6
Lupin
Neutral
2,069
-
93,141
14,864
17,244
26.9
26.9
62.1
71.1
33.3
29.1
8.1
6.4
27.4
24.6
5.6
4.7
Sun Pharma
Accumulate
905
950
217,891
28,163
32,610
25.8
30.7
17.4
26.9
52.0
33.7
4.9
4.3
13.0
16.6
7.1
5.9
Stock Watch
October 20, 2015
Company Name
Reco
CMP
Target
Mkt Cap
Sales ( Čcr )
OPM(%)
EPS (Č)
PER(x)
P/BV(x)
RoE(%)
EV/Sales(x)
(Č)
Price ( Č)
( Č cr )
FY16E FY17E
FY16E
FY17E
FY16E
FY17E
FY16E
FY17E
FY16E
FY17E
FY16E
FY17E
FY16E
FY17E
Power
Tata Power
Neutral
69
-
18,784
35,923
37,402
22.6
22.8
4.1
5.2
17.1
13.5
1.3
1.2
7.5
9.3
1.4
1.3
NTPC
Buy
127
157
104,965
87,064
98,846
23.5
23.5
11.7
13.2
10.9
9.6
1.2
1.1
11.4
12.1
2.2
1.9
Power Grid
Buy
133
170
69,763
20,702
23,361
86.7
86.4
12.1
13.2
11.0
10.1
1.6
1.4
15.6
15.1
8.2
7.6
Telecom
Bharti Airtel
Neutral
364
-
145,385
101,748
109,191
32.1
31.7
12.0
12.5
30.3
29.1
2.1
2.0
6.9
6.7
2.0
1.8
Idea Cellular
Neutral
151
-
54,516
34,282
36,941
32.0
31.5
5.9
6.2
25.7
24.4
2.4
2.1
9.9
9.3
2.1
1.9
zOthers
Abbott India
Neutral
5,462
-
11,605
2,715
3,153
14.5
14.1
134.3
152.2
40.7
35.9
10.2
8.4
27.4
25.6
4.2
3.6
Bajaj Electricals
Buy
252
341
2,547
4,719
5,287
5.2
5.8
8.6
12.7
29.5
19.9
3.4
3.0
11.4
14.8
0.5
0.5
Finolex Cables
Neutral
250
-
3,826
2,728
3,036
10.8
11.0
14.4
16.8
17.4
14.9
2.6
2.3
15.2
15.3
1.0
0.9
Goodyear India*
Buy
567
655
1,308
1,953
1,766
12.4
12.0
67.4
59.6
8.4
9.5
2.1
1.8
27.7
20.2
0.4
0.4
Hitachi
Neutral
1,491
-
4,055
1,806
2,112
9.0
9.2
28.6
29.1
52.1
51.3
13.0
10.5
28.1
22.6
2.1
1.7
Jyothy Laboratories
Neutral
312
-
5,649
1,620
1,847
11.5
11.5
7.3
8.5
42.8
36.8
5.5
5.1
13.3
14.4
3.3
2.8
MRF
Accumulate
41,901
43,575
17,771
20,727
14,841
19.3
18.6
4,905.8
3,351.9
8.5
12.5
2.7
2.2
37.6
19.6
0.8
1.1
Page Industries
Neutral
14,197
-
15,835
1,929
2,450
19.8
20.1
229.9
299.0
61.8
47.5
27.3
18.9
52.1
47.1
7.5
5.9
Relaxo Footwears
Neutral
536
-
6,430
1,767
2,152
12.3
12.5
19.3
25.1
27.8
21.4
6.8
5.3
27.7
27.8
3.7
3.0
Siyaram Silk Mills
Buy
954
1,221
894
1,653
1,873
11.7
12.2
99.3
122.1
9.6
7.8
1.7
1.5
19.5
20.2
0.7
0.6
Styrolution ABS India*
Neutral
822
-
1,446
1,271
1,440
8.6
9.2
32.0
41.1
25.7
20.0
2.6
2.4
10.7
12.4
1.0
0.9
Tree House
Buy
301
449
1,274
259
324
56.8
56.8
17.0
21.7
17.7
13.9
1.8
1.6
10.1
11.5
5.6
4.6
TVS Srichakra
Buy
3,008
3,210
2,303
2,127
2,388
15.2
14.9
237.7
267.5
12.7
11.3
5.4
3.8
51.7
39.8
1.0
0.9
HSIL
Accumulate
307
302
2,222
2,182
2,404
16.3
16.5
15.8
18.9
19.5
16.3
1.6
1.5
8.4
9.4
1.3
1.1
Kirloskar Engines India
Neutral
280
-
4,047
2,634
3,252
10.1
12.0
10.9
17.4
25.7
16.0
2.9
2.6
11.4
16.8
1.2
0.9
Ltd
M M Forgings
Buy
543
797
656
563
671
22.1
22.9
51.0
66.5
10.7
8.2
2.2
1.8
23.1
24.1
1.3
1.1
Banco Products (India)
Neutral
138
-
988
1,208
1,353
11.0
12.3
10.8
14.5
12.8
9.5
1.5
1.3
11.9
14.5
0.7
0.6
Competent Automobiles Neutral
149
-
92
1,007
1,114
3.1
3.1
23.7
28.2
6.3
5.3
0.9
0.8
13.9
14.6
0.1
0.1
Nilkamal
Neutral
986
-
1,472
1,948
2,147
10.6
10.3
60.0
67.0
16.4
14.7
2.6
2.2
16.8
16.1
0.8
0.7
Visaka Industries
Buy
148
166
236
1,158
1,272
8.6
9.5
23.7
32.7
6.3
4.5
0.6
0.6
10.1
12.5
0.3
0.3
Transport Corporation of
Buy
307
293
2,336
2,830
3,350
8.8
9.0
14.4
18.3
21.4
16.8
3.3
2.9
15.4
17.1
0.8
0.7
India
Elecon Engineering
Buy
75
87
813
1,452
1,596
14.0
14.7
4.4
6.2
16.9
12.0
1.4
1.3
8.6
11.2
0.8
0.7
Surya Roshni
Buy
139
183
609
2,992
3,223
8.3
8.5
14.7
18.3
9.5
7.6
0.9
0.8
9.8
11.0
0.5
0.4
MT Educare
Buy
144
169
575
286
366
18.3
17.7
7.7
9.4
18.7
15.4
3.9
3.5
20.2
21.1
1.7
1.3
Stock Watch
October 20, 2015
Company Name
Reco
CMP
Target Mkt Cap
Sales ( Čcr )
OPM(%)
EPS (Č)
PER(x)
P/BV(x)
RoE(%)
EV/Sales(x)
(Č)
Price ( Č)
( Č cr )
FY16E FY17E FY16E FY17E FY16E FY17E FY16E FY17E FY16E FY17E FY16E FY17E FY16E FY17E
zOthers
Radico Khaitan
Buy
95
112
1,261
1,565
1,687
11.9
12.4
5.4
6.6
17.5
14.4
1.4
1.3
8.0
9.0
1.2
1.2
Garware Wall Ropes
Buy
350
390
766
875
983
10.4
10.6
23.1
27.8
15.2
12.6
2.1
1.9
14.1
14.8
0.8
0.7
Wonderla Holidays
Accumulate
305
322
1,720
206
308
44.0
43.6
9.0
12.9
33.8
23.6
4.6
4.2
13.7
17.8
7.7
5.1
Linc Pen & Plastics
Buy
165
185
245
340
371
8.3
8.9
10.8
13.2
15.3
12.5
2.5
2.1
16.0
17.1
0.7
0.6
The Byke Hospitality
Accumulate
160
181
643
222
287
20.5
20.5
5.6
7.6
28.4
21.2
5.4
4.4
18.9
20.8
2.9
2.3
Source: Company, Angel Research; Note: *December year end; #September year end; &October year end; Price as on October 19, 2015
Market Outlook
October 20, 2015
Research Team Tel: 022 - 39357800
DISCLAIMER
Angel Broking Private Limited (hereinafter referred to as “Angel”) is a registered Member of National Stock Exchange of India Limited,
Bombay Stock Exchange Limited and Metropolitian Stock Exchange of India Limited. It is also registered as a Depository Participant with
CDSL and Portfolio Manager with SEBI. It also has registration with AMFI as a Mutual Fund Distributor. Angel Broking Private Limited is a
registered entity with SEBI for Research Analyst in terms of SEBI (Research Analyst) Regulations, 2014 vide registration number
INH000000164. Angel or its associates has not been debarred/ suspended by SEBI or any other regulatory authority for accessing
/dealing in securities Market. Angel or its associates including its relatives/analyst do not hold any financial interest/beneficial ownership
of more than 1% in the company covered by Analyst. Angel or its associates/analyst has not received any compensation / managed or co
-managed public offering of securities of the company covered by Analyst during the past twelve months. Angel/analyst has not served as
an officer, director or employee of company covered by Analyst and has not been engaged in market making activity of the company
covered by Analyst.
This document is solely for the personal information of the recipient, and must not be singularly used as the basis of any investment
decision. Nothing in this document should be construed as investment or financial advice. Each recipient of this document should make
such investigations as they deem necessary to arrive at an independent evaluation of an investment in the securities of the companies
referred to in this document (including the merits and risks involved), and should consult their own advisors to determine the merits and
risks of such an investment.
Reports based on technical and derivative analysis center on studying charts of a stock's price movement, outstanding positions and
trading volume, as opposed to focusing on a company's fundamentals and, as such, may not match with a report on a company's
fundamentals.
The information in this document has been printed on the basis of publicly available information, internal data and other reliable sources
believed to be true, but we do not represent that it is accurate or complete and it should not be relied on as such, as this document is for
general guidance only. Angel Broking Pvt. Limited or any of its affiliates/ group companies shall not be in any way responsible for any
loss or damage that may arise to any person from any inadvertent error in the information contained in this report. Angel Broking Pvt.
Limited has not independently verified all the information contained within this document. Accordingly, we cannot testify, nor make any
representation or warranty, express or implied, to the accuracy, contents or data contained within this document. While Angel Broking
Pvt. Limited endeavors to update on a reasonable basis the information discussed in this material, there may be regulatory, compliance,
or other reasons that prevent us from doing so.
This document is being supplied to you solely for your information, and its contents, information or data may not be reproduced,
redistributed or passed on, directly or indirectly.
Neither Angel Broking Pvt. Limited, nor its directors, employees or affiliates shall be liable for any loss or damage that may arise from or
in connection with the use of this information.
Note: Please refer to the important ‘Stock Holding Disclosure' report on the Angel website (Research Section). Also, please refer to the
latest update on respective stocks for the disclosure status in respect of those stocks. Angel Broking Pvt. Limited and its affiliates may have
investment positions in the stocks recommended in this report.