Market Outlook
November 19, 2015
Market Cues
Domestic Indices
Chg (%)
(Pts)
(Close)
Indian markets are expected to open on a positive note tracking the SGX Nifty and
BSE Sensex
(1.5)
(382)
25,482
global cues.
Nifty
(1.4)
(106)
7,732
U.S. stocks rallied Wednesday as the minutes of the Federal Reserve's most recent
Mid Cap
(0.7)
(73)
10,638
meeting provided some clarity on the prospects of a December rate hike. 'Most'
Small Cap
(0.7)
(80)
11,154
Federal Reserve officials are open to a December interest-rate hike as conveyed by
Bankex
(2.0)
(383)
19,220
the minutes of the central bank's October meeting.
The European markets ended the session with mixed results, as geo-political
Global Indices
Chg (%)
(Pts)
(Close)
concerns weighed on investor sentiment. News of a bomb threat in Germany, the
diversion of two Air France flights to Paris from the U.S., and a police raid in a Paris
Dow Jones
1.4
248
17,737
suburb dampened risk appetite.
Nasdaq
1.8
89
5,075
Sensex and Nifty snapped their two-day winning streak. Losses in banking, metal
FTSE
0.2
10
6,279
and IT stocks and index heavyweight Reliance Industries pulled key benchmark
Nikkei
0.1
19
19,649
indices lower as further security scares in Paris weighed on investor confidence.
Hang Seng
(0.3)
(76)
22,188
Overseas cues were negative with European and Asian stocks declining as further
Shanghai Com
(1.0)
(36)
3,568
security scares after the Paris attacks last week weighed on investor confidence.
News & Result Analysis
Advances / Declines
BSE
NSE
Jindal Stainless aims to cut debt by 64% through restructuring
Advances
1,040
508
Hero MotoCorp crosses 1 million sales mark during the festive season
Declines
1,624
1,001
Detailed analysis on Pg2
Unchanged
181
71
Investor’s Ready Reckoner
Key Domestic & Global Indicators
Volumes (` Cr)
Stock Watch: Latest investment recommendations on 150+ stocks
BSE
2,931
Refer P5 onwards
NSE
14,458
Top Picks
CMP
Target
Upside
Net Inflows (` Cr)
Net
Mtd
Ytd
Company
Sector
Rating
(`)
(`)
(%)
FII
(395)
(3,322)
(18,142)
Axis Bank
Financials
Buy
464
630
35.8
MFs
483
2,772
53,119
HCL Tech
IT
Buy
846
1,132
33.9
ICICI Bank
Financials
Buy
260
357
37.0
Top Gainers
Price (`)
Chg (%)
Ashok Leyland
Automobiles
Buy
92
111
21.0
Balramchin
83
14.6
Larsen & Toubro
Construction
Buy
1,343
1,646
22.5
More Top Picks on Pg4
Glenmark
17
8.5
Gmrinfra
14
7.2
Key Upcoming Events
Kailash
2
4.9
Previous
Consensus
Date
Region
Event Description
Reading
Expectations
Marico
418
4.2
Nov 19
UK
Retail Sales (Oct)(MoM)
1.9%
(0.5)%
Nov 24
US
GDP (QoQ) (Q3)
1.5%
2.0%
Top Losers
Price (`)
Chg (%)
Nov 27
UK
GDP (QoQ) (Q3)
0.5%
-
Pmcfin
1
(8.8)
Dec 1
India
RBI Repo Rate
6.75%
-
Hindalco
77
(5.1)
Welcorp
99
(4.9)
Hindzinc
141
(4.6)
Dlf
107
(4.6)
As on November 18, 2015
Market Outlook
November 19, 2015
Dr Reddy’s buys IP rights for anti-coagulant drug from Alchemia
for $17.5 mn
Dr Reddy’s Laboratories Ltd has completed the purchase of intellectual property
(IP) rights for anti-coagulant generic drug Fondaparinux sodium. In September, the
company had announced plans to buy the rights from Australian company
Alchemia Ltd for around $17.5 million.
Fondaparinux is a copycat version of the drug Arixtra used to treat deep vein
thrombosis and pulmonary embolism. Anti-coagulants are used when blood has to
be prevented from clotting. It can also be used to prevent clotting-related diseases
after hip or knee surgeries. Dr Reddy’s has around 50% share in the US market for
Fondaparinux. Alchemia had received shareholder approval to sell the rights of
the drug, at its annual general meeting held earlier this month. The sale
agreement is effective from July this year.
Of the total sale amount, Alchemia received $17.5 million in cash and $1.5
million as share of sale proceeds for the June quarter. In fact, the two companies,
prior to making the intellectual rights agreement, had decided that Dr Reddy’s
would exclusively market the drug in areas except North America. The agreement
had taken place in 2012, after which Dr Reddy’s shared net profits from the sale
of the drug with Alchemia. We have a Buy rating on the stock.
Jindal Stainless aims to cut debt by 64% through restructuring
Jindal Stainless (JSL), aims to cut its `8,580cr of debt by 64%, through operational
and financial restructuring.
The aim is to do so through improved cash flow, reduction in interest cost and
operational efficiencies. Presently the country's largest stainless steel manufacturer,
it has a factory each in Haryana and Odisha, with cumulative capacity of 1.6
million tonnes a year.
The plan includes demerger of its undertakings comprising the ferro alloys and the
mining division and vesting these in JSHL, a wholly-owned subsidiary. JSHL will
issue to the shareholders of Jindal Stainless one share of Rs 2 face value each for
every share held in JSL. It will also involve transfer of the stainless steel making
facilities in Hisar to JSHL for Rs 2,809 crore. Also, JSL will transfer a hot strip plant
in Odisha to JUSL and a coke oven plant, also in Odisha, to Jindal Coke.
Hero MotoCorp crosses 1 million sales mark during the festive
season
Hero MotoCorp Ltd has clocked over 1mn units in retail sales during the festive
season this year. This 1 million unit landmark was achieved in 35-day festive
period starting with the Navratras. This is a robust 11 percent growth over the
corresponding period last year
The company’s two new scooters, Maestro Edge and Duet, have been blockbusters
and there has also been phenomenal demand for the new Spelndor PRO. These,
along with the robust sales of Passion PRO and Glamour bikes, and the continuing
Market Outlook
November 19, 2015
popularity of Pleasure and Maestro scooters have resulted in this double digit
growth. We currently have a Neutral view on the stock.
Economic and Political News
MFs buy shares worth `52,000cr in Apr-Oct
Modi govt to reboot 34 stuck road plans worth `35,000cr
Cabinet nod to four rail line projects worth `8,351cr
Corporate News
Cabinet approves 10% stake sale in Coal India
Asset sale proceeds to aid NCC's bottomline in H2FY16
Amtek Auto may sell Tekfor for `6,000cr
Market Outlook
November 19, 2015
Top Picks ★★★★★
Large Cap
Market Cap
CMP
Target
Upside
Company
Rationale
(` Cr)
(`)
(`)
(%)
To outpace battery industry growth due to better technological
Amara Raja Batteries
15,280
895
1,040
16.3
products leading to market share gains in both the automotive
OEM and replacement segments.
Earnings to grow strongly given the MHCV cyclical upturn.
Ashok Leyland
26,111
92
111
21.0
Focus on exports and LCV's provides additional growth
avenue.
Healthy pace of branch expansion, backed by distribution
Axis Bank
1,10,237
464
630
35.8
network, will be the driving force for the bank’s retail business
and overall earnings.
The stock is trading at attractive valuations and is factoring all
HCL Tech
1,18,902
846
1,132
33.9
the bad news.
Strong visibility for a robust 20% earnings trajectory, coupled
HDFC Bank
2,64,007
1,048
1,262
20.4
with high quality of earnings on account of high quality retail
business and strategic focus on highly rated corporates.
Due to its robust franchise and capital adequacy position, the
bank is well positioned to grow by at least a few percentage
ICICI Bank
1,51,145
260
357
37.0
points higher than the average industry growth rate from a
structural point of view.
Back on the growth trend, expect a long term growth of 14%
Infosys
2,34,254
1,020
1,306
28.1
to be a US$20bn in FY2020.
Well positioned to benefit from such expected gradual
recovery in the overall domestic capex cycle, given its presence
Larsen & Toubro
1,25,025
1,343
1,646
22.5
across various infrastructure segments, its execution
capabilities, and its strong balance sheet.
LICHF continues to grow its retail loan book at a healthy pace
with improvement in asset quality. We expect the company to
LIC Housing Finance
23,146
459
571
24.5
post a healthy loan book which is likely to reflect in a strong
earnings growth.
Source: Company, Angel Research
Mid Cap
Market Cap
CMP
Target
Upside
Company
Rationale
(` Cr)
(`)
(`)
(%)
Government thrust on Renewable sector and strong order
Inox Wind
8,002
361
505
40.0
book would drive future growth.
Change in business focus towards high-margin chronic and
Ipca labs
9,544
756
900
19.0
lifestyle segments and increasing penetration in Europe and
US
Economic recovery to have favourable impact on advertising &
circulation revenue growth. Further, the acquisition of a radio
Jagran Prakashan
4,804
147
169
15.0
business (Radio City) would also boost the company's revenue
growth.
Strong brand & quality teaching with innovative technologies
MT Educare
514
129
169
30.8
& higher government educational spending to boost growth
Earnings boost on back of stable material prices and
Radico Khaitan
1,565
118
156
32.6
favourable pricing environment. Valuation discount to peers
provides additional comfort
Strong brands and distribution network would boost growth
Siyaram Silk Mills
863
920
1,145
24.5
going ahead. Stock currently trades at an inexpensive
valuation.
Structural shift in the Lighting industry towards LED lighting will
Surya Roshni
562
128
183
42.6
drive growth.
Source: Company, Angel Research
Market Outlook
November 19, 2015
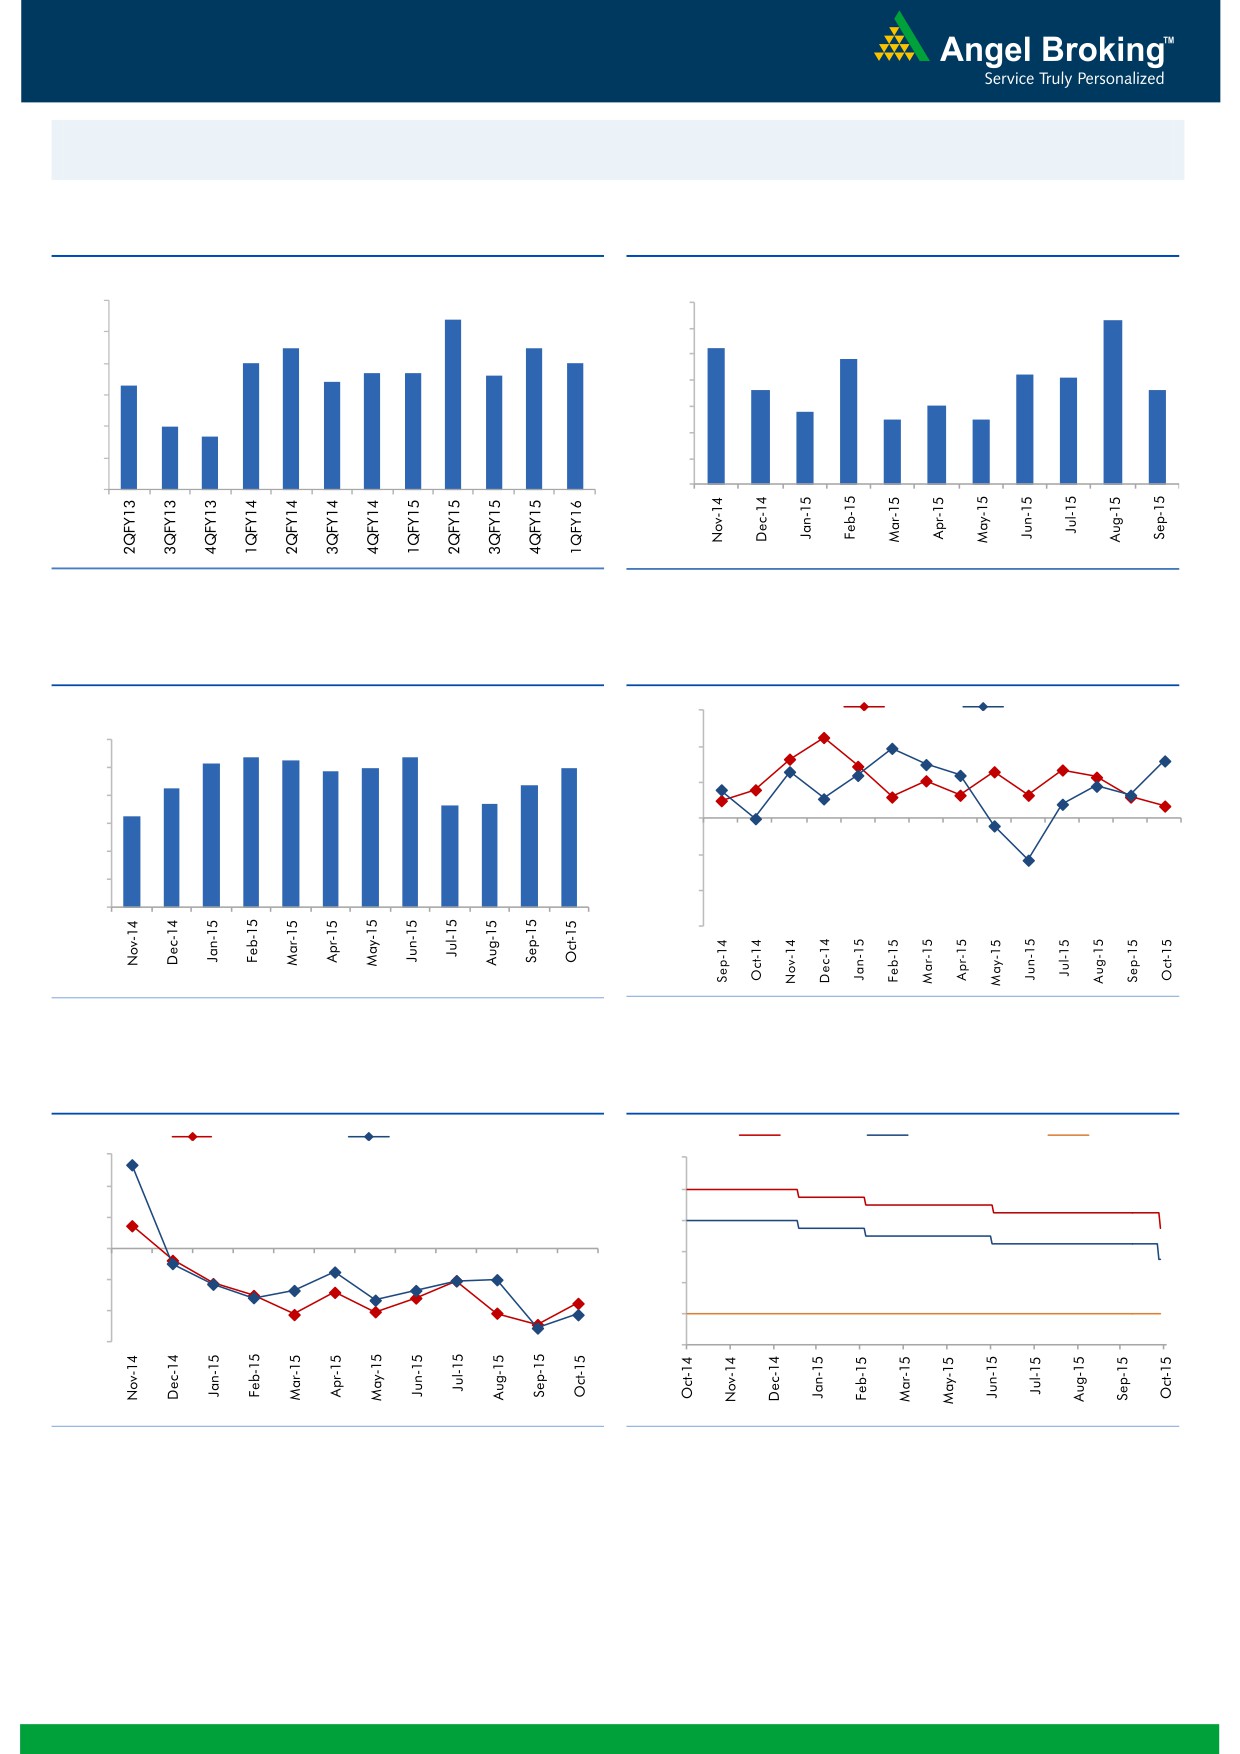
Macro watch
Exhibit 1: Quarterly GDP trends
Exhibit 2: IIP trends
(%)
(%)
9.0
8.4
7.0
6.3
8.0
7.5
7.5
6.0
5.2
7.0
7.0
4.8
6.7
6.7
5.0
7.0
6.4
6.6
4.2
4.1
6.3
3.6
3.6
4.0
6.0
2.8
3.0
2.5
2.5
5.0
3.0
4.7
5.0
2.0
4.0
1.0
3.0
-
Source: CSO, Angel Research
Source: MOSPI, Angel Research
Exhibit 3: Monthly CPI inflation trends
Exhibit 4: Manufacturing and services PMI
(%)
56.0
Mfg. PMI
Services PMI
6.0
5.4
5.3
5.4
5.2
5.0
5.0
54.0
4.9
5.0
4.3
4.4
3.7
3.7
52.0
4.0
3.3
50.0
3.0
2.0
48.0
1.0
46.0
-
44.0
Source: MOSPI, Angel Research
Source: Market, Angel Research; Note: Level above 50 indicates expansion
Exhibit 5: Exports and imports growth trends
Exhibit 6: Key policy rates
(%)
Exports yoy growth
Imports yoy growth
(%)
Repo rate
Reverse Repo rate
CRR
30.0
9.00
20.0
8.00
10.0
7.00
0.0
6.00
(10.0)
5.00
(20.0)
4.00
(30.0)
3.00
Source: Bloomberg, Angel Research
Source: RBI, Angel Research
Market Outlook
November 19, 2015
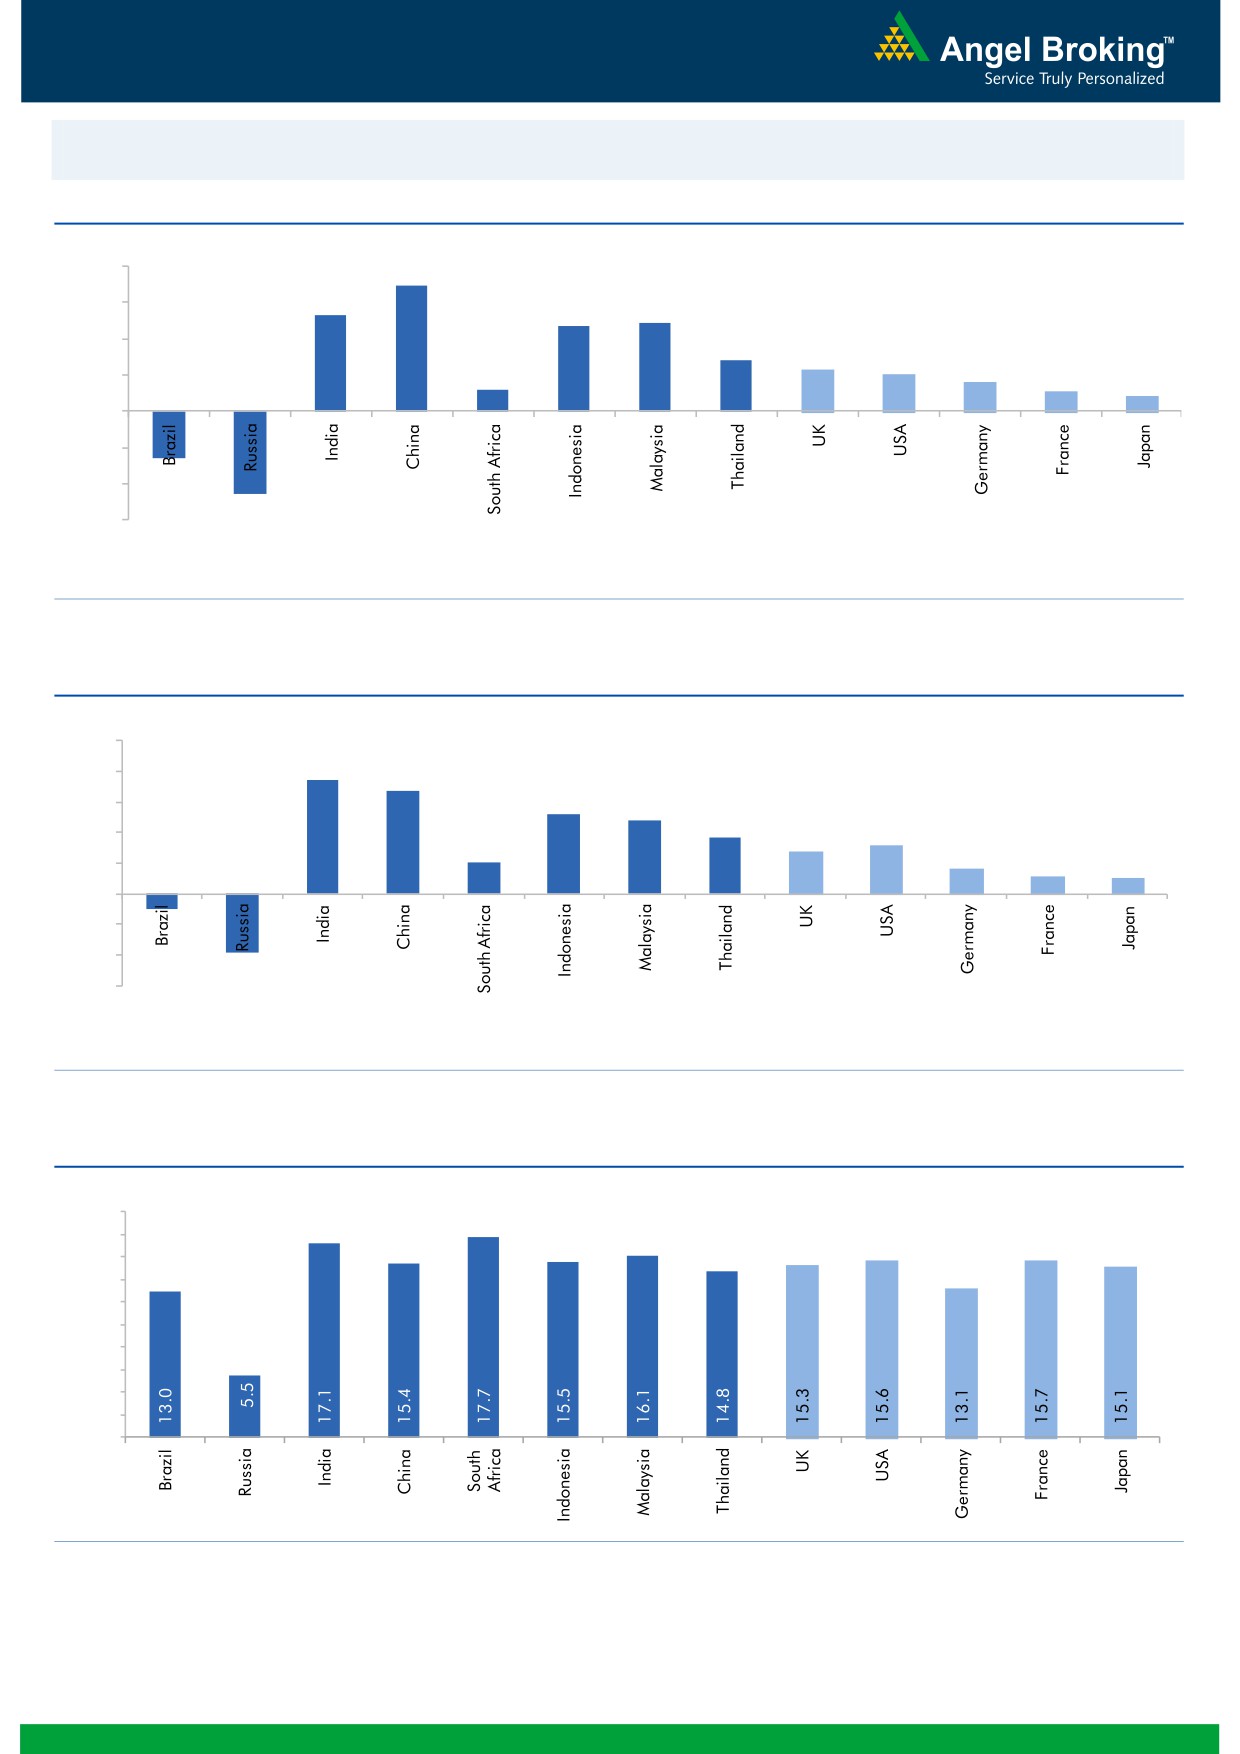
Global watch
Exhibit 1: Latest quarterly GDP Growth (%, yoy) across select developing and developed countries
(%)
8.0
6.9
5.3
6.0
4.9
4.7
4.0
2.8
2.3
2.0
1.6
2.0
1.2
1.1
0.8
(2.6)
-
(2.0)
(4.0)
(4.6)
(6.0)
Source: Bloomberg, Angel Research
Exhibit 2: 2015 GDP Growth projection by IMF (%, yoy) across select developing and developed countries
(%)
10.0
7.5
8.0
6.8
5.2
6.0
4.8
3.7
3.1
4.0
2.7
2.0
1.6
2.0
1.2
1.0
-
(2.0)
(4.0)
(1.0)
(3.8)
(6.0)
Source: IMF, Angel Research
Exhibit 3: One year forward P-E ratio across select developing and developed countries
(x)
20.0
18.0
16.0
14.0
12.0
10.0
8.0
6.0
4.0
2.0
-
Source: IMF, Angel Research
Market Outlook
November 19, 2015
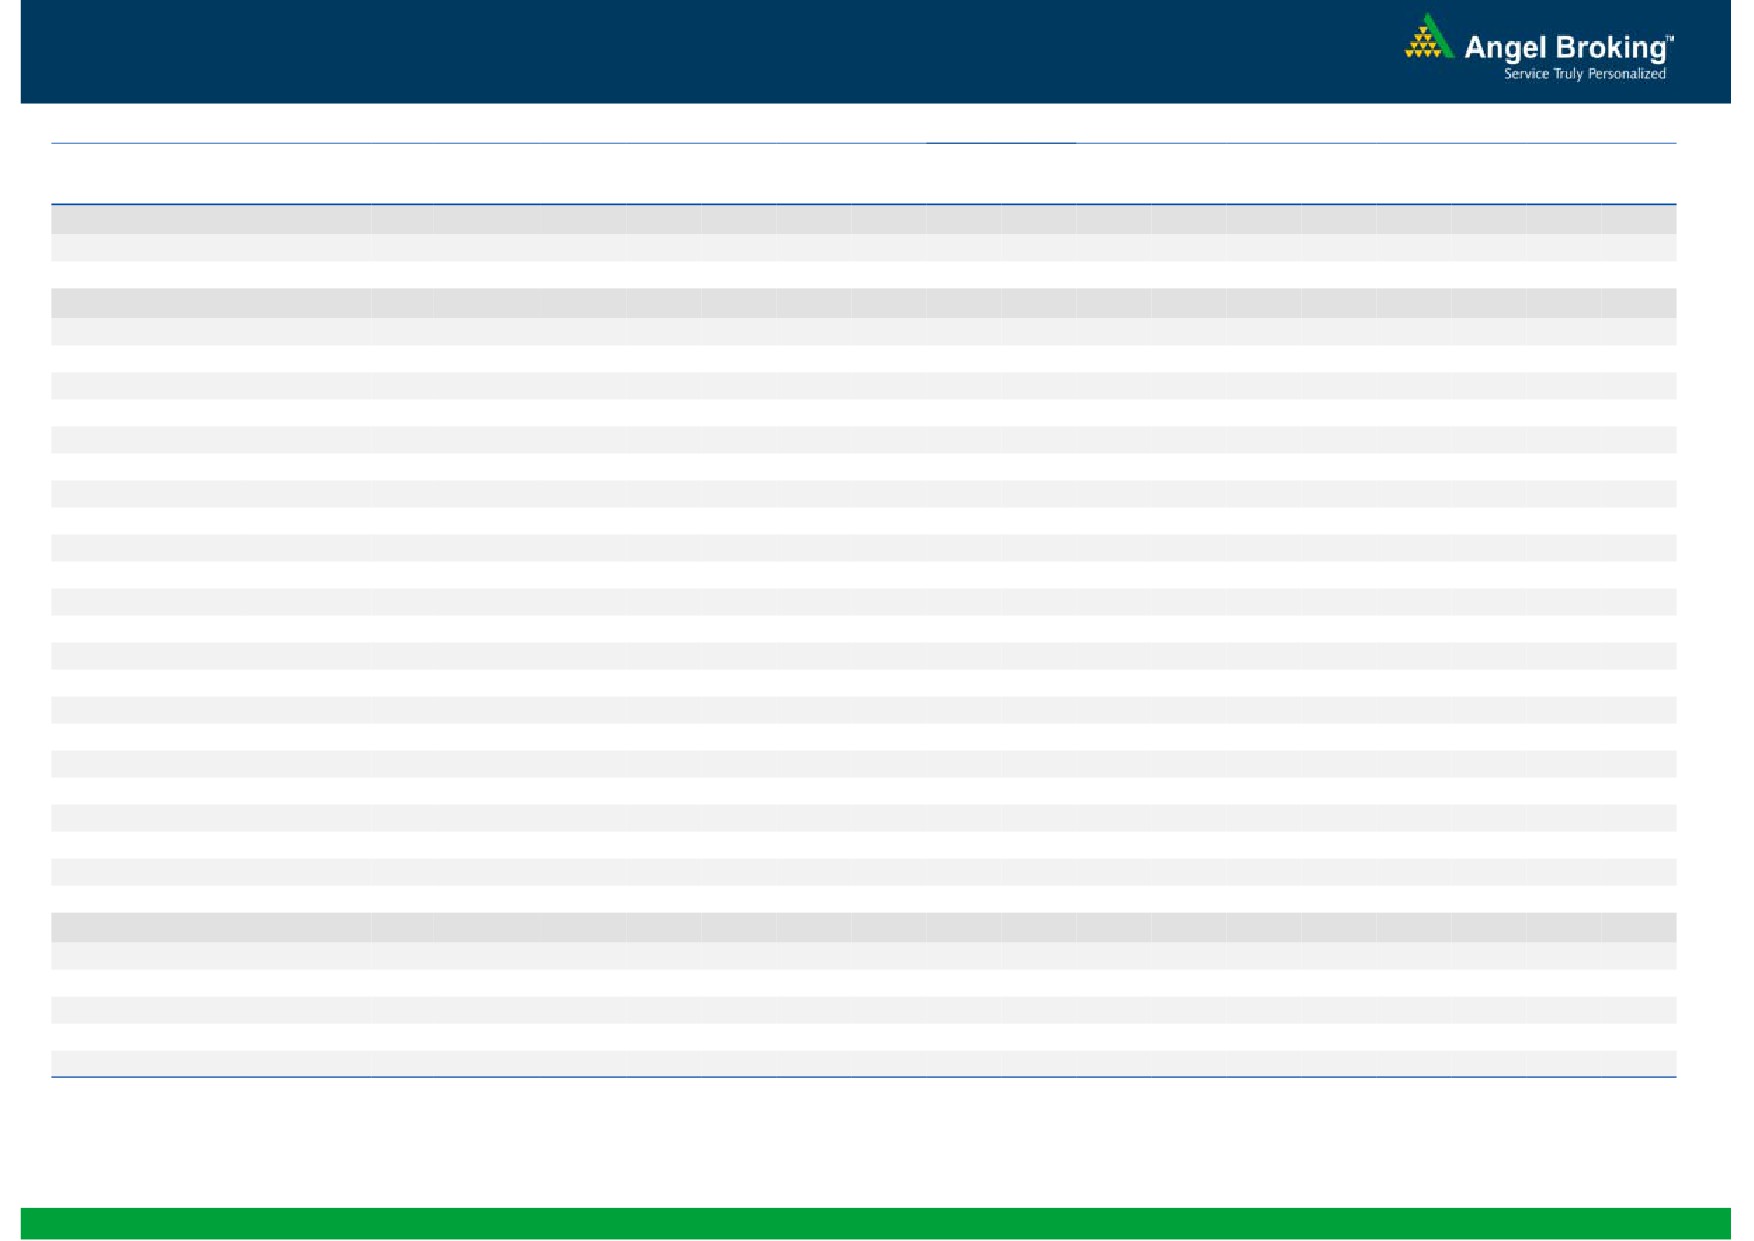
Exhibit 4: Relative performance of indices across globe
Returns (%)
Country
Name of index
Closing price
1M
3M
1YR
Brazil
Bovespa
47,436
0.0
1.8
(11.2)
Russia
Micex
1,810
5.4
8.2
19.1
India
Nifty
7,731
(1.4)
(9.0)
(7.8)
China
Shanghai Composite
3,568
5.8
(5.6)
48.2
South Africa
Top 40
46,464
(2.6)
4.0
4.4
Mexico
Mexbol
44,506
0.0
2.4
0.9
Indonesia
LQ45
773
(0.2)
2.8
(13.4)
Malaysia
KLCI
1,657
(3.4)
5.0
(6.1)
Thailand
SET 50
883
(3.7)
(1.6)
(16.2)
USA
Dow Jones
17,737
2.9
2.2
0.3
UK
FTSE
6,279
(1.2)
(1.9)
(6.2)
Japan
Nikkei
19,937
10.0
(1.5)
15.3
Germany
DAX
10,960
7.8
2.6
18.5
France
CAC
4,907
4.3
0.5
15.0
Source: Bloomberg, Angel Research
Stock Watch
November 19, 2015
Company Name
Reco
CMP
Target
Mkt Cap
Sales ( Čcr )
OPM(%)
EPS (Č)
PER(x)
P/BV(x)
RoE(%)
EV/Sales(x)
(Č)
Price ( Č)
( Č cr )
FY16E FY17E
FY16E
FY17E
FY16E
FY17E
FY16E
FY17E
FY16E
FY17E
FY16E
FY17E
FY16E
FY17E
Agri / Agri Chemical
Rallis
Neutral
192
-
3,739
2,075
2,394
14.4
14.4
9.5
11.0
20.2
17.5
4.0
3.5
21.1
21.3
1.8
1.6
United Phosphorus
Accumulate
445
510
19,066
13,698
15,752
17.6
17.6
32.1
38.5
13.9
11.6
2.7
2.3
21.4
21.3
1.5
1.2
Auto & Auto Ancillary
Ashok Leyland
Buy
92
111
26,111
18,763
22,357
11.1
11.2
3.6
4.8
25.5
19.1
4.7
4.3
18.7
22.6
1.3
1.1
Bajaj Auto
Accumulate
2,346
2,672
67,875
24,115
27,600
21.3
21.0
136.8
157.2
17.2
14.9
5.5
4.7
32.2
31.5
2.4
2.0
Bharat Forge
Buy
844
1,016
19,651
8,013
9,250
20.0
20.3
35.2
43.1
24.0
19.6
4.7
3.9
21.6
21.8
2.6
2.2
Eicher Motors
Buy
15,876
19,036
43,091
15,379
16,498
15.6
16.6
473.2
574.8
33.6
27.6
12.4
9.2
36.7
33.2
2.7
2.5
Hero Motocorp
Neutral
2,572
-
51,357
28,561
31,559
14.7
14.7
151.1
163.2
17.0
15.8
6.6
5.6
38.7
35.6
1.6
1.5
L G Balakrishnan & Bros Neutral
466
-
731
1,254
1,394
11.6
11.8
35.9
41.7
13.0
11.2
1.8
1.6
13.5
13.8
0.7
0.6
Mahindra and Mahindra Accumulate
1,277
1,410
79,338
38,513
43,579
13.6
13.7
56.1
65.1
22.8
19.6
3.6
3.2
15.7
16.2
1.7
1.4
Maruti
Accumulate
4,535
4,960
136,999
57,865
68,104
16.4
16.7
176.3
225.5
25.7
20.1
5.0
4.3
19.4
21.2
2.1
1.8
Minda Industries
Accumulate
731
809
1,160
2,567
2,965
8.0
8.3
46.1
57.8
15.9
12.7
2.7
2.2
16.7
17.3
0.6
0.5
Motherson Sumi
Accumulate
281
313
37,202
39,343
45,100
8.8
9.1
10.1
12.5
27.9
22.5
8.8
6.9
35.3
34.4
1.0
0.9
Rane Brake Lining
Accumulate
319
366
253
454
511
11.1
11.4
23.8
28.1
13.4
11.4
1.9
1.7
14.2
15.3
0.7
0.6
Setco Automotive
Neutral
202
-
539
594
741
12.7
13.7
8.4
15.8
24.0
12.8
2.5
2.2
10.4
16.9
1.4
1.1
Tata Motors
Neutral
405
-
117,062
255,254
301,772
12.9
13.4
23.7
37.3
17.1
10.9
2.1
1.7
7.4
12.1
0.6
0.6
TVS Motor
Accumulate
286
313
13,602
11,845
14,040
7.2
9.0
10.4
17.4
27.5
16.5
6.9
5.3
25.1
32.0
1.1
0.9
Amara Raja Batteries
Buy
895
1,040
15,280
4,892
5,871
17.4
17.6
28.8
37.1
31.1
24.1
7.3
5.8
23.4
24.1
3.1
2.5
Exide Industries
Accumulate
147
162
12,508
6,950
7,784
14.4
14.8
6.6
7.3
22.3
20.2
2.8
2.6
12.6
12.8
1.5
1.4
Apollo Tyres
Accumulate
158
171
8,017
12,146
12,689
16.8
16.0
21.2
19.0
7.4
8.3
1.2
1.1
16.5
13.0
0.7
0.8
Ceat
Accumulate
1,043
1,119
4,219
6,041
6,597
14.1
13.7
99.5
111.9
10.5
9.3
2.1
1.7
19.6
18.5
0.9
0.7
JK Tyres
Neutral
97
-
2,202
7,446
7,669
15.2
14.0
19.6
18.4
5.0
5.3
1.3
1.0
25.2
19.5
0.7
0.6
Swaraj Engines
Neutral
931
-
1,156
552
630
14.2
14.7
44.6
54.1
20.9
17.2
4.9
4.4
23.2
25.6
1.9
1.7
Subros
Neutral
85
-
508
1,268
1,488
11.6
11.9
3.7
6.6
22.9
12.8
1.5
1.4
6.8
11.4
0.7
0.6
Indag Rubber
Neutral
195
-
511
283
329
17.0
17.2
13.0
15.4
15.0
12.6
3.3
2.7
21.8
21.6
1.5
1.3
Capital Goods
ACE
Neutral
43
-
426
660
839
4.7
8.2
1.0
3.9
43.1
11.0
1.4
1.2
3.2
11.3
0.8
0.6
BEML
Neutral
1,048
-
4,364
3,277
4,006
6.0
8.9
29.2
64.3
35.9
16.3
2.0
1.8
5.7
11.7
1.4
1.1
BGR Energy
Neutral
110
-
796
3,615
3,181
9.5
9.4
16.7
12.4
6.6
8.9
0.6
0.6
10.0
7.0
0.6
0.8
BHEL
Neutral
175
-
42,747
33,722
35,272
10.8
11.7
10.5
14.2
16.6
12.3
1.2
1.2
7.0
9.0
1.3
1.3
Blue Star
Accumulate
356
382
3,197
3,624
4,157
5.3
6.0
9.6
14.5
36.9
24.6
6.7
5.8
18.6
25.4
1.0
0.8
Stock Watch
November 19, 2015
Company Name
Reco
CMP
Target
Mkt Cap
Sales ( Čcr )
OPM(%)
EPS (Č)
PER(x)
P/BV(x)
RoE(%)
EV/Sales(x)
(Č)
Price ( Č)
( Č cr )
FY16E
FY17E
FY16E
FY17E
FY16E
FY17E
FY16E
FY17E
FY16E
FY17E
FY16E
FY17E
FY16E
FY17E
Capital Goods
Crompton Greaves
Buy
173
204
10,858
13,484
14,687
4.9
6.2
4.5
7.1
38.5
24.4
2.7
2.5
7.2
10.8
0.9
0.9
Inox Wind
Buy
361
505
8,002
4,980
5,943
17.0
17.5
26.6
31.6
13.6
11.4
4.1
3.0
35.0
30.0
1.8
1.4
KEC International
Neutral
148
-
3,811
8,791
9,716
6.1
6.8
5.4
8.2
27.5
18.1
2.8
2.5
10.0
14.0
0.7
0.6
Thermax
Neutral
851
-
10,138
6,413
7,525
7.4
8.5
30.5
39.3
27.9
21.7
4.3
3.7
15.0
17.0
1.6
1.3
Cement
ACC
Buy
1,333
1,630
25,033
13,151
14,757
16.4
18.3
63.9
83.4
20.9
16.0
2.7
2.5
13.3
16.1
1.7
1.5
Ambuja Cements
Buy
197
233
30,634
11,564
12,556
19.4
20.7
8.9
10.1
22.2
19.5
2.8
2.6
12.8
13.8
2.3
2.1
India Cements
Buy
79
112
2,421
4,216
4,840
18.0
19.5
4.0
9.9
19.7
8.0
0.8
0.7
4.0
9.5
0.9
0.7
JK Cement
Accumulate
648
744
4,533
3,661
4,742
10.1
15.8
18.0
61.0
36.0
10.6
2.6
2.3
7.5
22.9
1.7
1.3
J K Lakshmi Cement
Buy
344
430
4,047
2,947
3,616
16.7
19.9
11.5
27.2
29.9
12.7
2.8
2.5
9.8
20.8
1.8
1.4
Mangalam Cements
Neutral
191
-
511
1,053
1,347
10.5
13.3
8.4
26.0
22.8
7.4
1.0
0.9
4.3
12.5
0.9
0.6
Orient Cement
Accumulate
165
183
3,381
1,854
2,524
21.2
22.2
7.7
11.1
21.4
14.9
3.1
2.7
13.3
15.7
2.6
1.8
Ramco Cements
Neutral
368
-
8,760
4,036
4,545
20.8
21.3
15.1
18.8
24.4
19.6
3.0
2.7
12.9
14.3
2.7
2.3
Shree Cement^
Neutral
10,812
-
37,666
7,150
8,742
26.7
28.6
228.0
345.5
47.4
31.3
7.0
5.9
15.7
20.3
5.0
4.0
UltraTech Cement
Buy
2,735
3,282
75,053
25,021
30,023
19.1
21.6
89.0
132.0
30.7
20.7
3.6
3.1
12.2
15.9
3.1
2.6
Construction
ITNL
Neutral
91
-
2,995
7,360
8,825
34.0
35.9
1.0
5.0
91.1
18.2
0.4
0.4
0.3
1.4
3.8
3.7
KNR Constructions
Accumulate
596
673
1,677
937
1,470
14.3
14.0
33.5
38.6
17.8
15.5
2.7
2.3
15.4
15.4
1.9
1.2
Larsen & Toubro
Buy
1,343
1,646
125,025
64,148
73,241
11.5
11.7
62.0
66.0
21.7
20.4
2.2
2.0
13.4
14.0
2.1
1.9
Gujarat Pipavav Port
Neutral
166
-
8,040
629
684
51.0
52.2
6.4
5.9
26.0
28.2
3.4
3.1
15.9
12.7
12.4
11.2
MBL Infrastructures
Buy
206
285
855
2,313
2,797
12.2
14.6
19.0
20.0
10.9
10.3
1.1
1.0
11.3
10.6
1.1
1.0
Nagarjuna Const.
Neutral
78
-
4,342
7,892
8,842
8.3
9.1
2.4
5.3
32.5
14.7
1.3
1.2
4.2
8.6
0.8
0.7
PNC Infratech
Neutral
523
-
2,685
1,798
2,132
13.2
13.5
22.0
30.0
23.8
17.4
2.1
1.9
11.5
11.4
1.6
1.3
Simplex Infra
Neutral
311
-
1,537
6,241
7,008
10.4
10.7
20.0
36.0
15.5
8.6
1.3
1.1
6.8
11.1
0.8
0.6
Financials
Allahabad Bank
Neutral
74
-
4,432
8,332
9,259
2.8
2.8
21.0
25.6
3.5
2.9
0.4
0.3
9.8
10.9
-
-
Axis Bank
Buy
464
630
110,237
26,473
31,527
3.5
3.6
35.7
43.5
13.0
10.7
2.5
2.2
17.9
18.9
-
-
Bank of Baroda
Neutral
168
-
38,779
19,105
21,474
2.0
2.0
19.1
24.8
8.8
6.8
0.9
0.8
10.2
12.1
-
-
Bank of India
Neutral
129
-
10,184
15,972
17,271
1.9
2.0
15.3
33.4
8.4
3.9
0.4
0.3
3.6
7.6
-
-
Canara Bank
Neutral
270
-
14,634
15,251
16,725
2.0
2.0
59.3
68.6
4.5
3.9
0.5
0.4
10.1
10.7
-
-
Dena Bank
Neutral
41
-
2,309
3,440
3,840
2.1
2.3
7.3
10.0
5.7
4.1
0.4
0.4
6.1
7.9
-
-
Federal Bank
Neutral
55
-
9,500
3,477
3,999
3.0
3.0
5.0
6.2
11.0
8.9
1.1
1.0
10.6
11.9
-
-
Stock Watch
November 19, 2015
Company Name
Reco
CMP
Target
Mkt Cap
Sales ( Čcr )
OPM(%)
EPS (Č)
PER(x)
P/BV(x)
RoE(%)
EV/Sales(x)
(Č)
Price ( Č)
( Č cr )
FY16E
FY17E
FY16E
FY17E
FY16E
FY17E
FY16E
FY17E
FY16E
FY17E
FY16E
FY17E
FY16E
FY17E
Financials
HDFC
Neutral
1,180
-
186,119
10,358
11,852
3.3
3.3
41.1
47.0
28.7
25.1
5.5
5.0
24.7
24.9
-
-
HDFC Bank
Buy
1,048
1,262
264,007
38,309
47,302
4.3
4.3
49.3
61.1
21.3
17.2
3.7
3.2
18.5
19.7
-
-
ICICI Bank
Buy
260
357
151,145
35,168
40,517
3.4
3.4
21.4
25.2
12.2
10.3
2.1
1.7
14.7
15.2
-
-
IDBI Bank
Neutral
83
-
13,321
9,625
10,455
1.8
1.8
8.5
14.2
9.7
5.8
0.6
0.6
5.9
9.3
-
-
Indian Bank
Neutral
126
-
6,056
6,160
6,858
2.5
2.5
24.5
29.8
5.2
4.2
0.4
0.4
7.7
8.6
-
-
LIC Housing Finance
Buy
459
571
23,146
3,101
3,745
2.5
2.5
33.0
40.2
13.9
11.4
2.6
2.2
19.7
20.5
-
-
Oriental Bank
Neutral
146
-
4,364
7,643
8,373
2.4
2.4
37.2
45.4
3.9
3.2
0.3
0.3
8.2
9.4
-
-
Punjab Natl.Bank
Neutral
136
-
26,764
23,638
26,557
2.8
2.8
17.9
27.2
7.6
5.0
0.8
0.6
8.5
12.0
-
-
South Ind.Bank
Neutral
20
-
2,727
1,965
2,185
2.5
2.5
2.5
3.3
8.1
6.1
0.8
0.7
9.5
11.7
-
-
St Bk of India
Buy
241
283
187,122
82,520
93,299
2.7
2.8
20.0
24.5
12.0
9.9
1.3
1.2
11.5
12.8
-
-
Union Bank
Neutral
160
-
11,002
12,646
14,129
2.3
2.4
31.0
39.1
5.2
4.1
0.6
0.5
9.8
11.4
-
-
Vijaya Bank
Neutral
34
-
2,904
3,536
3,827
1.9
1.9
5.5
6.7
6.1
5.1
0.5
0.5
7.8
8.8
-
-
Yes Bank
Buy
723
914
30,279
7,228
9,043
3.2
3.3
57.7
69.4
12.5
10.4
2.2
1.9
19.1
19.6
-
-
FMCG
Asian Paints
Neutral
820
-
78,621
16,553
19,160
16.0
16.2
17.7
21.5
46.4
38.1
12.3
11.1
29.4
31.2
4.6
4.0
Britannia
Neutral
2,860
-
34,308
8,065
9,395
9.6
10.2
47.2
65.5
60.6
43.7
20.1
19.0
38.3
41.2
4.1
3.5
Colgate
Neutral
944
-
25,675
4,836
5,490
19.5
19.7
48.5
53.2
19.5
17.7
14.3
12.4
99.8
97.5
5.2
4.6
Dabur India
Neutral
269
-
47,267
9,370
10,265
17.1
17.2
7.3
8.1
36.7
33.2
11.1
9.0
33.7
30.6
5.0
4.5
GlaxoSmith Con*
Neutral
5,873
-
24,698
4,919
5,742
17.2
17.4
168.3
191.2
34.9
30.7
9.9
8.4
28.8
28.9
4.6
3.9
Godrej Consumer
Neutral
1,210
-
41,194
10,168
12,886
16.1
16.1
32.1
38.4
37.7
31.5
7.7
7.1
19.7
21.0
4.2
3.3
HUL
Neutral
793
-
171,487
34,940
38,957
17.5
17.7
20.8
24.7
38.1
32.1
42.4
33.9
110.5
114.2
4.7
4.2
ITC
Buy
348
409
278,961
41,068
45,068
37.8
37.4
13.9
15.9
25.0
21.9
8.4
7.4
34.1
33.8
6.4
5.8
Marico
Neutral
418
-
26,977
6,551
7,766
15.7
16.0
10.4
12.5
40.3
33.5
11.7
9.7
33.2
32.4
4.0
3.4
Nestle*
Accumulate
6,078
6,646
58,602
11,291
12,847
22.2
22.3
158.9
184.6
38.2
32.9
20.0
18.0
55.0
57.3
5.0
4.4
Tata Global
Accumulate
129
144
8,107
8,635
9,072
9.8
9.9
6.5
7.6
19.8
16.9
2.0
1.9
6.8
7.4
0.9
0.8
IT
HCL Tech^
Buy
846
1,132
118,902
42,038
47,503
23.2
23.5
55.8
62.9
15.2
13.4
3.5
2.7
23.0
19.8
2.4
1.9
Infosys
Buy
1,020
1,306
234,254
60,250
66,999
28.0
28.0
58.3
63.7
17.5
16.0
3.7
3.2
20.9
19.7
3.2
2.7
TCS
Buy
2,352
3,165
463,425
111,274
126,852
28.4
28.7
125.4
143.9
18.8
16.3
7.4
6.8
39.9
42.2
3.8
3.3
Tech Mahindra
Buy
517
646
49,708
25,566
28,890
16.0
17.0
26.3
31.9
19.6
16.2
3.5
3.0
17.9
18.6
1.7
1.5
Wipro
Buy
554
719
136,906
52,414
58,704
23.7
23.8
38.4
42.3
14.4
13.1
2.8
2.5
19.5
18.0
2.2
1.8
Stock Watch
November 19, 2015
Company Name
Reco
CMP
Target
Mkt Cap
Sales ( Čcr )
OPM(%)
EPS (Č)
PER(x)
P/BV(x)
RoE(%)
EV/Sales(x)
(Č)
Price ( Č)
( Č cr )
FY16E FY17E
FY16E
FY17E
FY16E
FY17E
FY16E
FY17E
FY16E
FY17E
FY16E
FY17E
FY16E
FY17E
Media
D B Corp
Accumulate
325
356
5,973
2,241
2,495
27.8
27.9
21.8
25.6
14.9
12.7
3.9
3.4
26.7
28.5
2.6
2.3
HT Media
Neutral
77
-
1,790
2,495
2,603
11.2
11.2
7.3
8.6
10.5
8.9
0.8
0.8
7.4
8.1
0.2
0.2
Jagran Prakashan
Buy
147
169
4,804
2,170
2,355
27.0
27.6
12.8
10.3
11.5
14.3
3.2
3.0
21.8
19.4
2.0
1.7
Sun TV Network
Neutral
376
-
14,800
2,779
3,196
70.2
70.5
22.8
27.3
16.5
13.8
4.1
3.7
26.7
28.3
5.1
4.4
Hindustan Media
Neutral
269
-
1,977
920
1,031
20.0
20.0
19.2
20.9
14.0
12.9
2.3
2.0
16.4
15.3
1.7
1.5
Ventures
Metals & Mining
Coal India
Accumulate
335
380
211,567
76,167
84,130
19.9
22.3
22.4
25.8
14.9
13.0
5.4
5.3
35.5
41.0
2.1
1.9
Hind. Zinc
Buy
141
175
59,429
14,641
14,026
50.4
50.4
17.7
16.0
8.0
8.8
1.2
1.1
16.2
13.2
1.7
1.5
Hindalco
Neutral
77
-
15,838
104,356
111,186
8.7
9.5
6.7
11.1
11.4
6.9
0.4
0.4
3.5
5.9
0.7
0.6
JSW Steel
Neutral
886
-
21,414
42,308
45,147
16.4
20.7
(10.3)
49.5
17.9
1.0
1.0
(1.0)
5.6
1.6
1.5
NMDC
Neutral
92
-
36,317
8,237
10,893
46.6
44.5
10.0
11.7
9.2
7.9
1.0
0.9
12.5
13.0
4.2
3.2
SAIL
Neutral
44
-
18,276
45,915
53,954
7.2
10.5
1.5
4.4
29.4
10.1
0.4
0.4
2.3
4.1
1.0
0.9
Vedanta
Neutral
89
-
26,445
71,445
81,910
26.2
26.3
12.9
19.2
6.9
4.7
0.5
0.4
7.2
8.9
0.8
0.6
Tata Steel
Neutral
226
-
21,935
126,760
137,307
8.9
11.3
6.4
23.1
35.5
9.8
0.7
0.7
2.0
7.1
0.8
0.7
Oil & Gas
Cairn India
Neutral
135
-
25,245
11,323
12,490
49.4
51.0
20.7
20.7
6.5
6.5
0.4
0.4
6.4
6.1
1.3
0.7
GAIL
Neutral
309
-
39,253
64,856
70,933
9.1
9.6
24.0
28.9
12.9
10.7
1.1
1.0
8.8
9.6
0.8
0.7
ONGC
Neutral
231
-
197,332
154,564
167,321
36.8
37.4
28.6
32.5
8.1
7.1
1.0
0.9
12.7
13.5
1.5
1.4
Petronet LNG
Neutral
211
-
15,825
29,691
31,188
5.8
6.2
12.8
13.4
16.5
15.7
2.5
2.2
15.8
14.8
0.6
0.6
Indian Oil Corp
Accumulate
403
455
97,956
359,607
402,760
5.9
6.1
42.5
48.7
9.5
8.3
1.3
1.1
14.1
14.4
0.4
0.3
Reliance Industries
Buy
912
1,050
295,458
304,775
344,392
12.6
13.4
91.3
102.6
10.0
8.9
1.1
1.0
11.8
12.0
0.9
0.7
Pharmaceuticals
Alembic Pharma
Neutral
658
-
12,401
2,658
3,112
24.1
20.2
24.6
23.9
26.7
27.5
9.6
7.3
42.5
30.2
4.7
3.9
Aurobindo Pharma
Accumulate
816
872
47,643
14,923
17,162
23.0
23.0
38.2
43.6
21.4
18.7
6.6
5.0
36.0
30.2
3.5
3.0
Aventis*
Neutral
4,442
-
10,230
2,082
2,371
17.4
20.8
118.2
151.5
37.6
29.3
5.5
4.4
19.9
25.5
4.6
3.8
Cadila Healthcare
Neutral
408
-
41,753
10,224
11,840
21.0
22.0
14.6
17.6
27.9
23.2
7.7
6.0
30.8
29.0
4.1
3.5
Cipla
Neutral
630
-
50,584
14,211
16,611
20.6
19.0
27.0
28.9
23.3
21.8
4.0
3.4
18.4
16.8
3.5
3.0
Dr Reddy's
Buy
3,376
3,933
57,559
16,838
19,575
25.0
23.1
167.5
178.8
20.2
18.9
4.2
3.5
23.1
20.4
3.3
2.8
Dishman Pharma
Neutral
331
-
2,671
1,716
1,888
20.2
20.2
16.3
21.6
20.3
15.3
1.9
1.7
9.7
11.7
1.7
1.4
GSK Pharma*
Neutral
3,114
-
26,373
2,870
3,158
20.0
22.1
59.5
68.3
52.3
45.6
15.4
15.9
28.5
34.3
8.7
7.9
Indoco Remedies
Neutral
303
-
2,788
1,033
1,199
15.9
18.2
9.4
13.6
32.2
22.2
4.8
4.1
15.7
19.7
2.8
2.4
Ipca labs
Buy
756
900
9,544
3,363
3,909
12.9
18.6
13.4
28.0
56.5
27.0
7.4
5.9
7.4
14.0
3.1
2.7
Stock Watch
November 19, 2015
Company Name
Reco
CMP
Target
Mkt Cap
Sales ( Čcr )
OPM(%)
EPS (Č)
PER(x)
P/BV(x)
RoE(%)
EV/Sales(x)
(Č)
Price ( Č)
( Č cr )
FY16E FY17E
FY16E
FY17E
FY16E
FY17E
FY16E
FY17E
FY16E
FY17E
FY16E
FY17E
FY16E
FY17E
Pharmaceuticals
Lupin
Neutral
1,784
-
80,299
13,092
16,561
25.0
27.0
50.4
68.3
35.4
26.1
7.3
5.8
22.8
24.7
5.9
4.5
Sun Pharma
Buy
754
950
181,433
28,163
32,610
25.8
30.7
17.4
26.9
43.3
28.0
4.1
3.6
13.0
16.6
5.9
4.9
Power
Tata Power
Neutral
66
-
17,810
35,923
37,402
22.6
22.8
4.1
5.2
16.2
12.8
1.2
1.2
7.5
9.3
1.4
1.3
NTPC
Buy
133
157
109,788
87,064
98,846
23.5
23.5
11.7
13.2
11.4
10.1
1.3
1.2
11.4
12.1
2.3
2.0
Power Grid
Buy
131
170
68,403
20,702
23,361
86.7
86.4
12.1
13.2
10.8
9.9
1.6
1.4
15.6
15.1
8.2
7.7
Telecom
Bharti Airtel
Neutral
334
-
133,593
101,748
109,191
32.1
31.7
12.0
12.5
27.9
26.7
1.9
1.8
6.9
6.7
1.9
1.8
Idea Cellular
Neutral
134
-
48,379
34,282
36,941
32.0
31.5
5.9
6.2
22.8
21.7
2.1
1.9
9.9
9.3
2.0
1.9
zOthers
Abbott India
Neutral
5,195
-
11,038
2,715
3,153
14.5
14.1
134.3
152.2
38.7
34.1
9.7
8.0
27.4
25.6
3.8
3.2
Bajaj Electricals
Buy
229
341
2,315
4,719
5,287
5.2
5.8
8.6
12.7
26.8
18.1
3.1
2.7
11.4
14.8
0.5
0.4
Finolex Cables
Neutral
256
-
3,921
2,520
2,883
12.2
12.0
12.7
14.2
20.2
18.1
2.8
2.4
13.6
13.5
1.3
1.1
Goodyear India*
Accumulate
560
622
1,292
1,888
1,680
12.1
11.9
62.2
56.6
9.0
9.9
2.1
1.8
25.9
19.7
0.5
0.5
Hitachi
Neutral
1,352
-
3,676
1,779
2,081
7.8
8.8
21.8
33.4
62.0
40.4
10.0
8.1
17.4
22.1
2.1
1.8
Jyothy Laboratories
Neutral
300
-
5,432
1,620
1,847
11.5
11.5
7.3
8.5
41.2
35.4
5.3
4.9
13.3
14.4
3.2
2.7
MRF
Buy
38,946
45,575
16,517
20,316
14,488
21.4
21.1
5,488.0
3,798.0
7.1
10.3
2.4
2.0
41.1
21.2
0.8
1.0
Page Industries
Neutral
12,744
-
14,214
1,929
2,450
19.8
20.1
229.9
299.0
55.4
42.6
24.5
17.0
52.1
47.1
7.4
5.8
Relaxo Footwears
Neutral
480
-
5,760
1,767
2,152
12.3
12.5
19.3
25.1
24.9
19.2
6.1
4.7
27.7
27.8
3.3
2.7
Siyaram Silk Mills
Buy
920
1,145
863
1,636
1,815
11.5
11.5
89.9
104.1
10.2
8.8
1.7
1.5
17.9
17.8
0.7
0.6
Styrolution ABS India*
Neutral
727
-
1,278
1,271
1,440
8.6
9.2
32.0
41.1
22.7
17.7
2.3
2.1
10.7
12.4
1.0
0.8
Tree House
Buy
242
314
1,022
256
315
57.2
57.5
16.5
21.0
14.6
11.5
1.4
1.3
9.6
10.9
4.1
3.5
TVS Srichakra
Buy
2,708
3,240
2,073
2,101
2,338
15.7
15.0
248.6
270.0
10.9
10.0
4.8
3.4
43.6
34.0
1.0
0.9
HSIL
Accumulate
273
302
1,975
2,123
2,384
16.1
16.5
15.0
18.9
18.2
14.5
1.4
1.3
8.0
9.4
1.3
1.1
Kirloskar Engines India
Neutral
262
-
3,792
2,471
2,826
8.8
10.4
9.1
13.3
28.7
19.7
2.7
2.5
9.7
13.4
1.2
1.0
Ltd
M M Forgings
Buy
509
614
614
511
615
21.7
21.6
43.1
55.8
11.8
9.1
2.2
1.8
19.9
21.2
1.4
1.1
Banco Products (India)
Neutral
123
-
879
1,208
1,353
11.0
12.3
10.8
14.5
11.4
8.5
1.3
1.2
11.9
14.5
0.7
0.6
Competent Automobiles Neutral
140
-
86
1,040
1,137
3.2
3.1
25.7
28.0
5.5
5.0
0.8
0.7
15.0
14.3
0.1
0.1
Nilkamal
Neutral
992
-
1,481
1,910
2,083
10.5
10.3
63.3
69.2
15.7
14.3
2.6
2.2
17.6
16.5
0.8
0.7
Visaka Industries
Buy
117
166
185
1,158
1,272
8.6
9.5
23.7
32.7
4.9
3.6
0.5
0.4
10.1
12.5
0.3
0.3
Transport Corporation of
Neutral
294
-
2,239
2,830
3,350
8.8
9.0
14.4
18.3
20.5
16.1
3.2
2.7
15.4
17.1
0.9
0.8
India
Elecon Engineering
Accumulate
79
85
860
1,369
1,533
13.7
14.9
3.3
6.1
23.8
13.0
1.6
1.4
6.6
11.4
1.0
0.9
Stock Watch
November 19, 2015
Company Name
Reco
CMP
Target Mkt Cap
Sales ( Čcr )
OPM(%)
EPS (Č)
PER(x)
P/BV(x)
RoE(%)
EV/Sales(x)
(Č)
Price ( Č)
( Č cr )
FY16E FY17E FY16E FY17E FY16E FY17E FY16E FY17E FY16E FY17E FY16E FY17E FY16E FY17E
zOthers
Surya Roshni
Buy
128
183
562
2,992
3,223
8.1
8.4
14.7
18.3
8.7
7.0
0.8
0.7
9.7
11.0
0.5
0.4
MT Educare
Buy
129
169
514
286
366
18.3
17.7
7.7
9.4
16.7
13.8
3.5
3.1
20.2
21.1
1.7
1.3
Radico Khaitan
Buy
118
156
1,565
1,565
1,687
12.2
13.0
5.7
7.1
20.6
16.6
1.7
1.6
8.3
9.6
1.5
1.3
Garware Wall Ropes
Buy
343
423
751
861
967
10.9
10.9
24.0
28.2
14.3
12.2
2.1
1.8
14.6
14.9
0.9
0.8
Wonderla Holidays
Neutral
380
-
2,144
206
308
44.0
43.6
9.0
12.9
42.2
29.4
5.8
5.2
13.7
17.8
10.3
6.9
Linc Pen & Plastics
Accumulate
168
185
249
340
371
8.3
8.9
10.8
13.2
15.6
12.7
2.5
2.2
16.0
17.1
0.8
0.7
The Byke Hospitality
Accumulate
165
181
660
222
287
20.5
20.5
5.6
7.6
29.2
21.8
5.5
4.5
18.9
20.8
3.0
2.3
Source: Company, Angel Research; Note: *December year end; #September year end; &October year end; Price as on November 18, 2015
Market Outlook
November 19, 2015
Research Team Tel: 022 - 39357800
DISCLAIMER
Angel Broking Private Limited (hereinafter referred to as “Angel”) is a registered Member of National Stock Exchange of India Limited,
Bombay Stock Exchange Limited and Metropolitian Stock Exchange of India Limited. It is also registered as a Depository Participant with
CDSL and Portfolio Manager with SEBI. It also has registration with AMFI as a Mutual Fund Distributor. Angel Broking Private Limited is a
registered entity with SEBI for Research Analyst in terms of SEBI (Research Analyst) Regulations, 2014 vide registration number
INH000000164. Angel or its associates has not been debarred/ suspended by SEBI or any other regulatory authority for accessing
/dealing in securities Market. Angel or its associates including its relatives/analyst do not hold any financial interest/beneficial ownership
of more than 1% in the company covered by Analyst. Angel or its associates/analyst has not received any compensation / managed or co
-managed public offering of securities of the company covered by Analyst during the past twelve months. Angel/analyst has not served as
an officer, director or employee of company covered by Analyst and has not been engaged in market making activity of the company
covered by Analyst.
This document is solely for the personal information of the recipient, and must not be singularly used as the basis of any investment
decision. Nothing in this document should be construed as investment or financial advice. Each recipient of this document should make
such investigations as they deem necessary to arrive at an independent evaluation of an investment in the securities of the companies
referred to in this document (including the merits and risks involved), and should consult their own advisors to determine the merits and
risks of such an investment.
Reports based on technical and derivative analysis center on studying charts of a stock's price movement, outstanding positions and
trading volume, as opposed to focusing on a company's fundamentals and, as such, may not match with a report on a company's
fundamentals.
The information in this document has been printed on the basis of publicly available information, internal data and other reliable sources
believed to be true, but we do not represent that it is accurate or complete and it should not be relied on as such, as this document is for
general guidance only. Angel Broking Pvt. Limited or any of its affiliates/ group companies shall not be in any way responsible for any
loss or damage that may arise to any person from any inadvertent error in the information contained in this report. Angel Broking Pvt.
Limited has not independently verified all the information contained within this document. Accordingly, we cannot testify, nor make any
representation or warranty, express or implied, to the accuracy, contents or data contained within this document. While Angel Broking
Pvt. Limited endeavors to update on a reasonable basis the information discussed in this material, there may be regulatory, compliance,
or other reasons that prevent us from doing so.
This document is being supplied to you solely for your information, and its contents, information or data may not be reproduced,
redistributed or passed on, directly or indirectly.
Neither Angel Broking Pvt. Limited, nor its directors, employees or affiliates shall be liable for any loss or damage that may arise from or
in connection with the use of this information.
Note: Please refer to the important ‘Stock Holding Disclosure' report on the Angel website (Research Section). Also, please refer to the
latest update on respective stocks for the disclosure status in respect of those stocks. Angel Broking Pvt. Limited and its affiliates may have
investment positions in the stocks recommended in this report.