Market Outlook
July 19, 2016
Market Cues
Domestic Indices
Chg (%)
(Pts)
(Close)
Indian markets are expected to open flat tracking SGX Nifty.
BSE Sensex
(0.3)
27,747
(90)
U.S. markets added to recent gains during trading on Monday, although buying
Nifty
(0.4)
8,509
(33)
interest was somewhat subdued throughout the session. The upward move lifted the
Mid Cap
(0.6)
12,050
Dow and the S&P 500 to new record closing highs, while the Nasdaq reached its
(75)
best levels of 2016.
Small Cap
(0.5)
11,922
(57)
The European markets got off to a positive start Monday. Early gains were driven by
Bankex
(0.1)
21,703
(18)
the takeover of British chip maker ARM Holdings and the failed coup attempt in
Turkey. However, the markets reversed after Bank of England policymaker Martin
Global Indices
Chg (%)
(Pts)
(Close)
Weale said there is little urgency to cut interest rates. The markets ended the choppy
trading session with mixed results.
Dow Jones
0.1
10
18,517
Nasdaq
(0.1)
(4)
5,030
Indian markets erased early gains to end slightly lower on Monday, with mixed
global cues.
FTSE
0.2
15
6,669
Nikkei
0.7
112
16,498
News Analysis
Hang Seng
0.7
144
21,803
Preview: Wipro
Shanghai Com
(0.4)
(11)
3,044
Detailed analysis on Pg2
Investor’s Ready Reckoner
Advances / Declines
BSE
NSE
Key Domestic & Global Indicators
Advances
1,108
613
Stock Watch: Latest investment recommendations on 150+ stocks
Declines
1,648
1,020
Refer Pg5 onwards
Unchanged
174
57
Top Picks
CMP
Target
Upside
Volumes (` Cr)
Company
Sector
Rating
(`)
(`)
(%)
BSE
3,304
Amara Raja
Auto/Auto Ancillary
Buy
859
1,076
25.2
NSE
17,425
HCL Tech
IT
Buy
723
1,000
38.4
LIC Housing
Financials
Buy
520
592
13.9
Net Inflows (` Cr)
Net
Mtd
Ytd
Bharat Electronics
Capital Goods
Accumulate
1,243
1,414
13.8
FII
1,409
4,391
23,935
Navkar Corporation Others
Buy
210
265
26.4
More Top Picks on Pg3
MFs
(42)
(139)
9,205
Key Upcoming Events
Top Gainers
Price (`)
Chg (%)
Previous
Consensus
Date
Region
Event Description
Reading
Expectations
Cyient
490
3.9
July 19 US
Housing Starts
1.164M
1.165M
Mrpl
73
3.1
July 19 UK
Jobless claims change
-0.40
3.00
Jppower
6
2.9
July 19 US
Building Permits (Jun)
1.136M
1.150M
Ceatltd
885
2.9
July 20 UK
CPI (YoY) (Jun) (%)
0.3
0.4
6.(
Cesc
601
2.8
More Events on Pg4
Top Losers
Price (`)
Chg (%)
Idea
104
(6.5)
Ongc
219
(5.0)
Jindalstel
69
(5.0)
Rcom
49
(4.5)
Albk
76
(4.2)
As on July 18, 2016
Market Outlook
July 19, 2016
Result Preview
Wipro (CMP: `552 / TP: `680 /Upside: 23.2%)
For 1QFY2017, company is expected to post a 2.3% sequential growth in USD IT
services revenues to end the period at US$1,925mn V/s US$1,882mn in
4QFY2016. In rupee terms, revenues came in at `14,154cr V/s `13,742cr
expected, up 3.0% QoQ. On the operating front, EBDITA and EBIT margins
dipped by ~59bp QoQ bps and ~112bps QoQ respectively to end the period at
20.6% and 17.1% respectively. Consequently, PAT is expected to be at `2,174cr
V/s `2,235cr, QoQ de-growth of 2.7%. We maintain our buy rating on the stock
with a target price of `680.
Y/E
Sales OPM
PAT
EPS ROE P/E P/BV EV/EBITDA EV/Sales
March
(` cr)
(%)
(` cr)
(`)
(%)
(x)
(x)
(x)
(x)
FY2017E
58,473
23.8
10,413
42.1
20.0
13.1
2.8
8.0
1.8
FY2018E
64,320
23.5
11,311
45.8
19.6
12.1
2.5
7.0
1.6
Economic and Political News
Fitch affirms India at 'BBB-'; outlook stable
UP forms panel to look into 7th Pay Commission proposals
Banks, FIs provide over `78,000 cr for clean energy projects
Corporate News
Exide Industries Q2 profit up 26% at `196cr
HUL gains across the board, Q1 grows 9.79% to `1,174cr
Nalco's revenue pegged at `7,100 crore in FY17
Quarterly Bloomberg Brokers Consensus Estimate
Wipro Ltd Consol- July 19, 2016
Particulars (` cr)
1QFY17E
1QFY16
y-o-y (%)
4QFY16
q-o-q (%)
Net sales
13,788
12,238
12.7
13,632
1.1
EBITDA
2,811
2,606
7.9
2,946
(4.6)
EBITDA margin (%)
20.4
21.3
21.6
Net profit
2,168
2,188
(0.9)
2,235
(3.0)
Ultratech Cement Ltd - July 19, 2016
Particulars (` cr)
1QFY17E
1QFY16
y-o-y (%)
4QFY16
q-o-q (%)
Net sales
6,391
6,038
5.8
6,436
(0.7)
EBITDA
1,373
1,152
19.2
1,353
1.5
EBITDA margin (%)
21.5
19.1
21.0
Net profit
722
591
22.3
681
6.0
Market Outlook
July 19, 2016
Top Picks ★★★★★
Large Cap
Market Cap
CMP
Target
Upside
Company
Rationale
(` Cr)
(`)
(`)
(%)
To outpace battery industry growth due to better technological
Amara Raja Batteries
14,675
859
1,076
25.2
products leading to market share gains in both the automotive
OEM and replacement segments.
Uptick in defense capex by government, coupled with BELs
Bharat Electronics
29,833
1,243
1,414
13.8
strong market positioning, indicate good times ahead for BEL.
HCL Tech
1,01,927
723
1,000
38.4
Stock is trading at attractive valuations & factors all bad news.
Back on the growth trend, expect a long term growth of 14% to
Infosys
2,48,461
1,082
1,374
27.0
be a US$20bn in FY2020.
Continues to grow its retail loan book at healthy pace with
LIC Housing Fin.
26,225
520
592
13.9
improvement in asset quality. Expect LICHF to post a healthy
loan book which is likely to reflect in a strong earnings growth.
Strong market positioning within the domestic AC markets to
Voltas
10,714
324
407
25.7
continue, EMP business set to revive
Source: Company, Angel Research
Mid Cap
Market Cap
CMP
Target
Upside
Company
Rationale
(` Cr)
(`)
(`)
(%)
Among the top 4 players in the consumer durables segment.
Bajaj Electricals
2,399
237
268
12.9
Improved profitability backed by turn around in E&P segment.
Strong order book lends earnings visibility.
Favourable outlook for AC industry to augur well for Cooling
Blue Star
3,883
432
495
14.7
products business. EMPPAC division's profitability to improve
once operating environment turns around.
With a focus on the low and medium income (LMI) consumer
Dewan Housing
6,331
217
270
24.5
segment, the company has increased its presence in tier-II & III
cities where the growth opportunity is immense.
Strong loan growth backed by diversified loan portfolio and
Equitas Holdings
5,923
177
235
33.1
adequate CAR. ROE & ROA likely to remain decent as risk of
dilution remains low. Attractive valuations considering growth.
Expectations of above average monsoon augurs well for
Goodyear India
1,204
522
631
20.9
Goodyear India as it derives ~50% of its turnover from farm
tyre segment.
Commencement of new projects, downtrend in the interest rate
IL&FS Transport
2,658
81
93
15.1
cycle, to lead to stock re-rating
Economic recovery to have favourable impact on advertising &
Jagran Prakashan
5,830
178
205
14.9
circulation revenue growth. Further, the acquisition of a radio business
(Radio City) would also boost the company's revenue growth.
Speedier execution and speedier sales, strong revenue visibility
Mahindra Lifespace
1,908
465
554
19.2
in short-to-long run, attractive valuations
Massive capacity expansion along with rail advantage at ICD
Navkar Corporation
2,990
210
265
26.4
as well CFS augurs well for the company
Earnings boost on back of stable material prices and
Radico Khaitan
1,202
90
125
38.4
favourable pricing environment. Valuation discount to peers
provides additional comfort
Strong brands and distribution network would boost growth
Siyaram Silk Mills
983
1,049
1,347
28.4
going ahead. Stock currently trades at an inexpensive
valuation.
Source: Company, Angel Research
Market Outlook
July 19, 2016
Key Upcoming Events
Result Calendar
Date
Company
July 19, 2016
UltraTech Cement, Wipro
July 20, 2016
Crompton Greaves
July 21, 2016
HDFC Bank, Cairn India
July 22, 2016
Axis Bank
July 23, 2016
Mphasis, Persistent
July 26, 2016
IDFC, L G Balakrishnan & Bros
July 27, 2016
Asian Paints
July 28, 2016
GSK Pharma
July 29, 2016
Sesa Goa
August 05, 2016
LMW
Source: Bloomberg, Angel Research
Global economic events release calendar
Bloomberg Data
Date
Time
Country Event Description
Unit
Period
Last Reported Estimated
Jul 19, 2016
6:00 PM
US
Housing Starts
Thousands
Jun
1164.00
1165.00
6:00 PM
US
Building permits
Thousands
Jun
1136.00
1150.00
2:00 PM
UK Jobless claims change
% Change
Jun
-0.40
3.00
Jul 20, 2016
2:00 PM
UK CPI (YoY)
% Change
Jun
0.30
0.40
7:30 PM Euro Zone Euro-Zone Consumer Confidence
Value
Jul A
-7.30
(8.00)
Jul 21, 2016
5:15 PM Euro Zone ECB announces interest rates
%
Jul 21
0.00
-
6:00 PM
US
Initial Jobless claims
Thousands
Jul 16
254.00
265.00
7:30 PM
US
Existing home sales
Million
Jun
5.53
5.48
July 22, 2016
1:00 PM Germany PMI Services
Value
Jul P
53.70
53.20
1:00 PM Germany PMI Manufacturing
Value
Jul P
54.50
53.40
2:00 PM
UK PMI Manufacturing
Value
Jul P
52.10
47.50
Jul 26, 2016
7:30 PM
US
Consumer Confidence
S.A./ 1985=100 Jul
98.00
95.25
7:30 PM
US
New home sales
Thousands
Jun
551.00
560.00
Jul 27, 2016
2:00 PM
UK GDP (YoY)
% Change
2Q A
2.00
11:30 PM
US
FOMC rate decision
%
Jul 27
0.50
0.50
Source: Bloomberg, Angel Research
Market Outlook
July 19, 2016
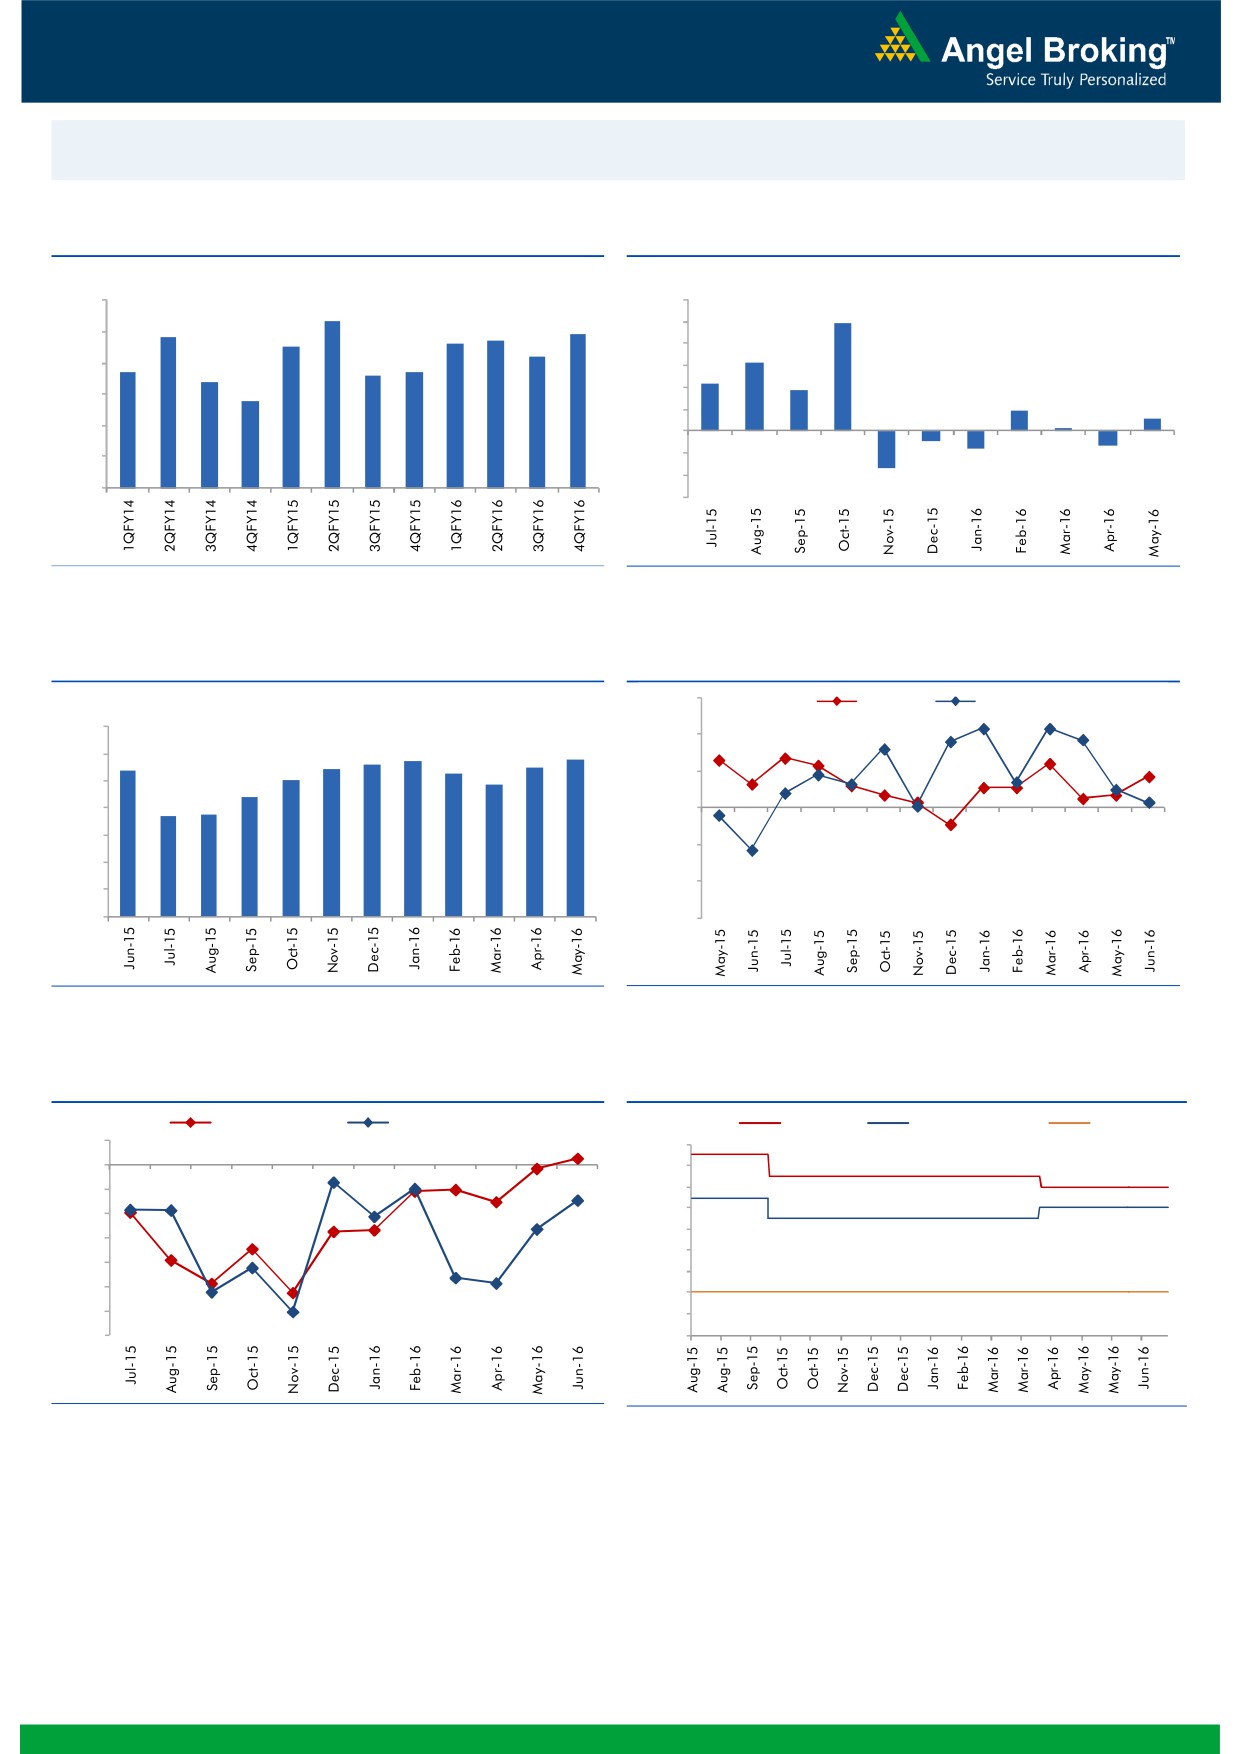
Macro watch
Exhibit 1: Quarterly GDP trends
Exhibit 2: IIP trends
(%)
(%)
9.0
12.0
8.3
9.9
7.8
7.7
7.9
10.0
8.0
7.5
7.6
7.2
8.0
6.3
6.7
6.6
6.7
7.0
6.4
6.0
4.3
3.7
5.8
4.0
6.0
1.9
1.2
2.0
0.3
5.0
-
4.0
(2.0)
(0.9)
(1.3)
(1.6)
(4.0)
3.0
(3.4)
(6.0)
Source: CSO, Angel Research
Source: MOSPI, Angel Research
Exhibit 3: Monthly CPI inflation trends
Exhibit 4: Manufacturing and services PMI
56.0
Mfg. PMI
Services PMI
(%)
7.0
54.0
5.7
5.8
5.4
5.4
5.6
5.5
6.0
5.3
5.0
4.8
52.0
5.0
4.4
3.7
3.7
4.0
50.0
3.0
48.0
2.0
46.0
1.0
-
44.0
Source: MOSPI, Angel Research
Source: Market, Angel Research; Note: Level above 50 indicates expansion
Exhibit 5: Exports and imports growth trends
Exhibit 6: Key policy rates
(%)
Exports yoy growth
Imports yoy growth
(%)
Repo rate
Reverse Repo rate
CRR
5.0
7.50
0.0
7.00
(5.0)
6.50
(10.0)
6.00
5.50
(15.0)
5.00
(20.0)
4.50
(25.0)
4.00
(30.0)
3.50
(35.0)
3.00
Source: Bloomberg, Angel Research
Source: RBI, Angel Research
Market Outlook
July 19, 2016
Global watch
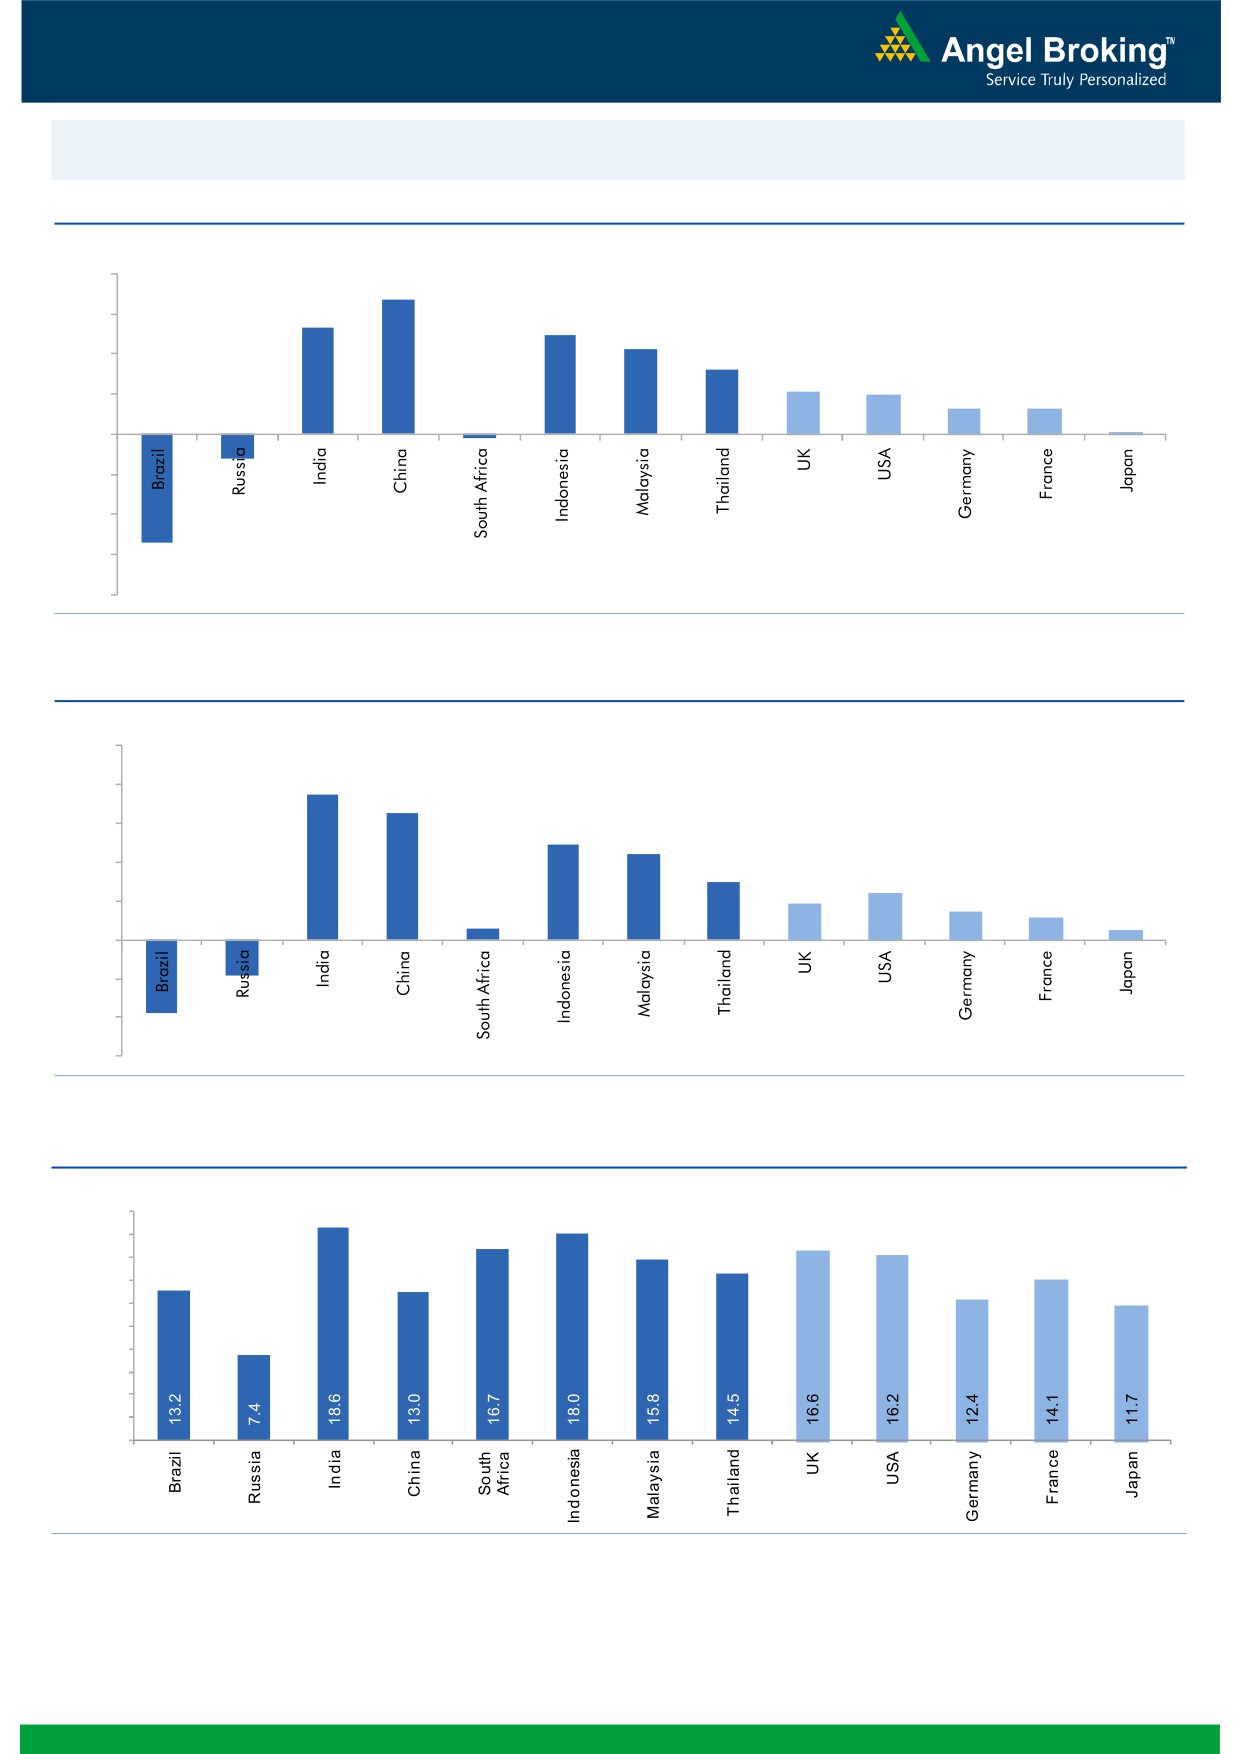
Exhibit 1: Latest quarterly GDP Growth (%, yoy) across select developing and developed countries
(%)
8.0
6.7
6.0
5.3
4.9
4.2
4.0
3.2
2.1
2.0
2.0
1.3
1.3
0.1
-
(2.0)
(4.0)
(1.2)
(6.0)
(0.2)
(5.4)
(8.0)
Source: Bloomberg, Angel Research
Exhibit 2: 2016 GDP Growth projection by IMF (%, yoy) across select developing and developed countries
(%)
10.0
7.5
8.0
6.5
6.0
4.9
4.4
4.0
3.0
2.4
1.9
1.5
2.0
1.1
0.6
0.5
(3.8)
(1.8)
-
(2.0)
(4.0)
(6.0)
Source: IMF, Angel Research
Exhibit 3: One year forward P-E ratio across select developing and developed countries
(x)
20.0
18.0
16.0
14.0
12.0
10.0
8.0
6.0
4.0
2.0
-
Source: IMF, Angel Research
Market Outlook
July 19, 2016
Exhibit 4: Relative performance of indices across globe
Returns (%)
Country
Name of index
Closing price
1M
3M
1YR
Brazil
Bovespa
56,484
14.3
6.1
6.3
Russia
Micex
1,936
3.5
0.2
17.2
India
Nifty
8,509
3.7
8.4
1.8
China
Shanghai Composite
3,044
4.9
(1.7)
(18.4)
South Africa
Top 40
46,431
0.8
(0.3)
(1.7)
Mexico
Mexbol
46,961
3.8
2.6
3.1
Indonesia
LQ45
881
7.0
7.1
4.3
Malaysia
KLCI
1,671
2.5
(3.0)
(1.5)
Thailand
SET 50
943
4.0
7.9
(3.3)
USA
Dow Jones
18,533
5.1
3.6
2.4
UK
FTSE
6,695
12.5
5.5
(1.1)
Japan
Nikkei
16,498
3.6
3.6
(19.0)
Germany
DAX
10,063
5.4
(0.6)
(12.7)
France
CAC
4,358
4.9
(4.6)
(11.6)
Source: Bloomberg, Angel Research
Stock Watch
July 19, 2016
Company Name
Reco
CMP
Target
Mkt Cap
Sales ( Čcr )
OPM(%)
EPS (Č)
PER(x)
P/BV(x)
RoE(%)
EV/Sales(x)
(Č)
Price ( Č)
( Č cr )
FY16E FY17E
FY16E
FY17E
FY16E
FY17E
FY16E
FY17E
FY16E
FY17E
FY16E
FY17E
FY16E
FY17E
Agri / Agri Chemical
Rallis
Neutral
209
-
4,061
1,612
1,911
13.3
13.3
7.4
9.5
28.2
22.0
4.5
4.0
16.7
18.4
2.6
2.2
United Phosphorus
Buy
556
684
23,813
13,083
15,176
18.5
18.5
31.5
37.4
17.6
14.9
3.5
2.9
21.4
21.4
2.0
1.7
Auto & Auto Ancillary
Ashok Leyland
Buy
93
111
26,452
17,995
21,544
11.4
11.6
3.4
4.7
27.3
19.8
4.8
4.4
17.7
22.2
1.4
1.1
Bajaj Auto
Neutral
2,756
-
79,744
22,709
25,860
20.9
20.1
129.0
143.6
21.4
19.2
6.6
5.6
30.7
29.4
3.0
2.6
Bharat Forge
Buy
738
875
17,174
7,351
8,318
19.9
19.7
31.2
36.5
23.7
20.2
4.2
3.6
19.3
19.2
2.4
2.1
Eicher Motors
Neutral
19,954
-
54,198
15,556
16,747
15.5
17.3
464.8
597.5
42.9
33.4
15.7
11.5
36.2
34.3
3.4
3.1
Gabriel India
Neutral
102
-
1,461
1,415
1,544
8.7
9.0
4.6
5.4
22.1
18.8
4.0
3.6
18.1
18.9
1.0
0.9
Hero Motocorp
Neutral
3,255
-
64,988
28,244
30,532
15.5
15.9
156.7
168.5
20.8
19.3
8.3
7.0
39.9
36.4
2.1
1.9
Jamna Auto Industries Neutral
171
-
1,368
1,281
1,473
11.2
11.5
7.6
9.2
22.5
18.6
5.7
4.7
25.4
25.2
1.1
1.0
L G Balakrishnan & Bros Neutral
500
-
785
1,254
1,394
11.6
11.8
35.9
41.7
13.9
12.0
1.9
1.7
13.5
13.8
0.7
0.7
Mahindra and Mahindra Neutral
1,467
-
91,120
38,416
42,904
13.7
13.9
54.8
63.4
26.8
23.1
4.1
3.7
15.4
15.8
2.0
1.8
Maruti
Neutral
4,460
-
134,713
57,865
68,104
16.4
16.7
176.3
225.5
25.3
19.8
4.9
4.2
19.4
21.2
2.1
1.7
Minda Industries
Neutral
1,159
-
1,839
2,523
2,890
8.7
9.0
55.0
65.4
21.1
17.7
4.1
3.3
19.3
18.7
0.8
0.7
Motherson Sumi
Neutral
297
-
39,279
39,343
45,100
8.8
9.1
10.1
12.5
29.4
23.8
9.3
7.3
35.3
34.4
1.1
1.0
Rane Brake Lining
Neutral
449
-
355
454
511
11.5
12.0
25.2
31.0
17.8
14.5
2.7
2.4
14.9
16.6
0.9
0.8
Setco Automotive
Neutral
46
-
611
594
741
12.7
13.7
1.7
3.2
26.9
14.3
2.8
2.5
10.4
16.9
1.5
1.2
Tata Motors
Neutral
493
-
142,238
259,686
273,957
13.0
13.4
25.9
29.5
19.0
16.7
2.5
2.2
8.0
9.0
0.7
0.7
TVS Motor
Accumulate
303
330
14,388
11,263
13,122
6.9
8.5
9.2
15.0
32.9
20.2
7.5
6.0
22.7
29.6
1.3
1.1
Amara Raja Batteries
Buy
859
1,076
14,675
4,690
5,429
17.5
17.5
28.5
35.3
30.2
24.3
7.0
5.7
23.1
25.9
3.2
2.7
Exide Industries
Neutral
179
-
15,245
6,950
7,784
14.4
14.8
6.6
7.3
27.2
24.6
3.4
3.1
12.6
12.8
1.9
1.7
Apollo Tyres
Buy
160
183
8,142
12,056
12,714
17.2
16.4
23.0
20.3
7.0
7.9
1.2
1.1
17.7
13.6
0.7
0.7
Ceat
Buy
885
1,119
3,578
6,041
6,597
14.1
13.7
99.5
111.9
8.9
7.9
1.8
1.5
19.6
18.5
0.7
0.6
JK Tyres
Neutral
90
-
2,039
7,446
7,669
15.2
14.0
19.6
18.4
4.6
4.9
1.2
1.0
25.2
19.5
0.7
0.6
Swaraj Engines
Neutral
1,120
-
1,391
552
630
14.2
14.7
44.6
54.1
25.1
20.7
5.8
5.3
23.2
25.6
2.4
2.1
Subros
Neutral
93
-
558
1,293
1,527
11.8
11.9
4.2
6.7
22.1
13.9
1.7
1.5
7.7
11.5
0.7
0.6
Indag Rubber
Neutral
186
-
488
283
329
17.0
17.2
13.0
15.4
14.4
12.1
3.1
2.6
21.8
21.6
1.5
1.2
Capital Goods
ACE
Neutral
44
-
430
660
839
4.7
8.2
1.0
3.9
43.5
11.2
1.4
1.2
3.2
11.3
0.8
0.6
BEML
Buy
935
1,157
3,894
3,277
4,006
6.0
8.9
36.2
64.3
25.8
14.5
1.8
1.6
5.7
11.7
1.3
1.0
Bharat Electronics
Accumulate
1,243
1,414
29,833
7,295
8,137
20.0
16.8
56.5
58.7
22.0
21.2
3.3
2.9
42.1
44.6
3.3
2.8
Stock Watch
July 19, 2016
Company Name
Reco
CMP
Target
Mkt Cap
Sales ( Čcr )
OPM(%)
EPS (Č)
PER(x)
P/BV(x)
RoE(%)
EV/Sales(x)
(Č)
Price ( Č)
( Č cr )
FY16E
FY17E
FY16E
FY17E
FY16E
FY17E
FY16E
FY17E
FY16E
FY17E
FY16E
FY17E
FY16E
FY17E
Capital Goods
Voltas
Buy
324
407
10,714
5,857
6,511
7.5
7.9
11.7
12.9
27.7
25.1
4.5
4.0
17.1
16.7
1.9
1.7
BGR Energy
Neutral
121
-
872
3,615
3,181
9.5
9.4
16.7
12.4
7.2
9.7
0.7
0.7
10.0
7.0
0.7
0.8
BHEL
Neutral
140
-
34,205
33,722
35,272
10.8
11.7
10.5
14.2
13.3
9.8
1.0
0.9
7.0
9.0
1.1
1.1
Blue Star
Accumulate
432
495
3,883
3,770
4,351
5.7
6.4
11.4
17.2
37.8
25.1
5.9
5.5
18.4
23.1
1.1
1.0
Crompton Greaves
Neutral
71
-
4,434
13,484
14,687
4.9
6.2
4.5
7.1
15.7
10.0
1.1
1.0
7.2
10.8
0.5
0.4
Greaves Cotton
Neutral
141
-
3,448
1,655
1,755
16.6
16.8
7.4
7.8
19.1
18.1
3.8
3.6
21.1
20.6
2.0
1.9
Inox Wind
Buy
234
286
5,197
5,605
6,267
15.7
16.4
24.8
30.0
9.4
7.8
2.6
1.9
25.9
24.4
1.0
0.9
KEC International
Neutral
142
-
3,651
8,791
9,716
6.1
6.8
5.4
8.2
26.3
17.3
2.6
2.4
10.0
14.0
0.6
0.6
Thermax
Neutral
915
-
10,908
6,413
7,525
7.4
8.5
30.5
39.3
30.0
23.3
4.6
4.0
15.0
17.0
1.7
1.4
VATech Wabag
Accumulate
593
681
3,232
3,136
3,845
8.9
9.1
26.0
35.9
22.8
16.5
2.9
2.4
13.4
15.9
1.0
0.8
Cement
ACC
Neutral
1,596
-
29,979
13,151
14,757
16.4
18.3
63.9
83.4
25.0
19.1
3.2
3.0
13.3
16.1
2.1
1.8
Ambuja Cements
Neutral
260
-
40,303
11,564
12,556
19.4
20.7
8.9
10.1
29.2
25.7
3.7
3.5
12.8
13.8
3.1
2.9
HeidelbergCement
Neutral
118
-
2,673
1,772
1,926
13.3
15.4
1.0
3.0
118.0
39.3
3.0
2.8
2.6
7.9
2.1
1.8
India Cements
Neutral
112
-
3,428
4,216
4,840
18.0
19.5
4.0
9.9
27.9
11.3
1.1
1.0
4.0
9.5
1.2
0.9
JK Cement
Neutral
712
-
4,976
3,661
4,742
10.1
15.8
7.5
28.5
94.9
25.0
2.9
2.5
7.5
22.9
1.8
1.4
J K Lakshmi Cement
Neutral
402
-
4,726
2,947
3,616
16.7
19.9
11.5
27.2
34.9
14.8
3.3
2.9
9.8
20.8
2.0
1.6
Mangalam Cements
Neutral
301
-
803
1,053
1,347
10.5
13.3
8.4
26.0
35.8
11.6
1.5
1.4
4.3
12.5
1.2
0.9
Orient Cement
Neutral
174
-
3,570
1,854
2,524
21.2
22.2
7.7
11.1
22.6
15.7
3.3
2.8
13.3
15.7
2.7
1.9
Ramco Cements
Neutral
561
-
13,362
4,036
4,545
20.8
21.3
15.1
18.8
37.2
29.9
4.5
4.0
12.9
14.3
3.8
3.3
Shree Cement^
Neutral
16,019
-
55,807
7,150
8,742
26.7
28.6
228.0
345.5
70.3
46.4
10.3
8.7
15.7
20.3
7.4
6.0
UltraTech Cement
Neutral
3,500
-
96,042
24,669
29,265
18.2
20.6
82.0
120.0
42.7
29.2
4.6
4.0
11.3
14.7
4.0
3.4
Construction
ITNL
Accumulate
81
93
2,658
7,360
8,682
34.0
32.2
7.0
8.6
11.5
9.4
0.4
0.4
3.2
2.5
3.7
3.6
KNR Constructions
Accumulate
572
603
1,609
937
1,470
14.3
14.0
44.2
38.6
12.9
14.8
2.6
2.2
15.4
15.4
1.8
1.2
Larsen & Toubro
Accumulate
1,575
1,700
146,787
58,870
65,708
8.3
10.3
42.0
53.0
37.5
29.7
2.6
2.4
8.8
11.2
2.7
2.5
Gujarat Pipavav Port
Neutral
182
-
8,801
629
684
51.0
52.2
6.4
5.9
28.5
30.9
3.8
3.4
15.9
12.7
13.5
12.2
MBL Infrastructures
Buy
143
285
592
2,313
2,797
12.2
14.6
19.0
20.0
7.5
7.1
0.8
0.7
11.3
10.6
1.0
0.9
Nagarjuna Const.
Neutral
78
-
4,345
7,892
8,842
8.8
9.1
3.0
5.3
26.1
14.8
1.3
1.2
5.0
8.5
0.8
0.7
PNC Infratech
Accumulate
570
647
2,926
1,873
2,288
13.2
13.5
24.0
32.0
23.8
17.8
2.3
2.1
12.1
12.3
1.7
1.4
Simplex Infra
Neutral
294
-
1,455
5,955
6,829
10.3
10.5
16.0
31.0
18.4
9.5
1.0
0.9
5.3
9.9
0.8
0.6
Stock Watch
July 19, 2016
Company Name
Reco
CMP
Target
Mkt Cap
Sales ( Čcr )
OPM(%)
EPS (Č)
PER(x)
P/BV(x)
RoE(%)
EV/Sales(x)
(Č)
Price ( Č)
( Č cr )
FY16E
FY17E
FY16E
FY17E
FY16E
FY17E
FY16E
FY17E
FY16E
FY17E
FY16E
FY17E
FY16E
FY17E
Construction
Power Mech Projects
Neutral
563
-
828
1,539
1,801
12.8
12.7
59.0
72.1
9.5
7.8
1.4
1.2
18.6
16.8
0.5
0.5
Sadbhav Engineering
Neutral
291
-
4,995
3,186
3,598
10.2
10.3
8.0
9.0
36.4
32.4
3.4
3.0
9.4
9.9
1.9
1.7
NBCC
Neutral
242
-
14,541
5,838
7,428
6.0
7.9
5.2
8.2
46.6
29.6
1.5
1.2
21.9
28.2
2.3
1.7
MEP Infra
Neutral
44
-
710
1,956
1,876
28.1
30.5
1.3
3.0
33.6
14.6
7.0
4.7
21.2
32.8
1.8
1.8
SIPL
Neutral
100
-
3,535
675
1,042
62.4
64.7
-
-
3.8
4.3
-
-
16.9
11.4
Engineers India
Neutral
205
-
6,904
1,667
1,725
13.5
16.0
9.7
11.4
21.1
18.0
2.5
2.4
11.7
13.4
3.0
3.0
Financials
Allahabad Bank
Neutral
76
-
5,481
8,569
9,392
2.8
2.9
16.3
27.5
4.7
2.8
0.4
0.3
7.6
11.9
-
-
Axis Bank
Neutral
570
-
136,057
26,204
29,738
3.6
3.5
34.5
35.4
16.5
16.1
2.6
2.3
16.8
14.9
-
-
Bank of Baroda
Neutral
159
-
36,659
18,802
21,088
2.0
2.2
(7.4)
13.0
12.2
1.3
1.0
(4.2)
7.3
-
-
Bank of India
Neutral
111
-
10,340
15,972
17,271
1.9
2.0
15.3
33.4
7.2
3.3
0.3
0.3
3.6
7.6
-
-
Canara Bank
Neutral
247
-
13,417
15,441
16,945
2.0
2.1
46.6
70.4
5.3
3.5
0.5
0.4
8.0
11.2
-
-
Dena Bank
Neutral
40
-
2,661
3,440
3,840
2.1
2.3
7.3
10.0
5.5
4.0
0.4
0.3
6.1
7.9
-
-
Dewan Housing Finance Buy
217
270
6,331
1,828
2,225
2.9
3.0
24.9
29.7
8.7
7.3
1.3
1.2
15.1
16.1
-
-
Equitas Holdings
Buy
177
235
5,923
679
1,076
12.4
11.7
6.2
6.7
28.5
26.4
3.6
2.6
13.3
12.5
-
-
Federal Bank
Neutral
60
-
10,283
3,279
3,787
2.8
2.9
3.9
5.5
15.2
10.8
1.2
1.1
8.4
10.8
-
-
HDFC
Neutral
1,345
-
212,671
10,358
11,852
3.3
3.3
41.1
47.0
32.8
28.6
6.2
5.7
24.7
24.9
-
-
HDFC Bank
Neutral
1,231
-
311,594
38,606
47,696
4.4
4.5
48.8
61.4
25.2
20.1
4.3
3.7
18.7
20.0
-
-
ICICI Bank
Neutral
264
-
153,334
34,279
39,262
3.3
3.3
21.0
24.4
12.6
10.8
2.1
1.8
14.4
14.7
-
-
IDBI Bank
Neutral
73
-
15,019
9,625
10,455
1.8
1.8
8.5
14.2
8.6
5.1
0.5
0.5
5.9
9.3
-
-
Indian Bank
Neutral
159
-
7,632
6,160
6,858
2.5
2.5
24.5
29.8
6.5
5.3
0.5
0.5
7.7
8.6
-
-
LIC Housing Finance
Accumulate
520
592
26,225
3,179
3,758
2.6
2.6
32.9
40.6
15.8
12.8
2.9
2.5
19.6
20.7
-
-
Oriental Bank
Neutral
118
-
4,097
7,643
8,373
2.4
2.4
37.2
45.4
3.2
2.6
0.3
0.3
8.2
9.4
-
-
Punjab Natl.Bank
Neutral
133
-
26,018
23,122
26,022
2.8
2.8
7.0
21.6
18.9
6.1
1.0
0.9
3.4
10.0
-
-
South Ind.Bank
Neutral
21
-
2,883
1,965
2,185
2.5
2.5
2.5
3.3
8.6
6.5
0.9
0.8
9.5
11.7
-
-
St Bk of India
Neutral
229
-
177,457
79,958
86,061
2.6
2.6
13.4
20.7
17.1
11.1
1.4
1.3
11.5
12.8
-
-
Union Bank
Neutral
138
-
9,518
12,646
14,129
2.3
2.4
31.0
39.1
4.5
3.5
0.5
0.4
9.8
11.4
-
-
Vijaya Bank
Neutral
43
-
4,310
3,536
3,827
1.9
1.9
5.5
6.7
7.8
6.5
0.6
0.6
7.8
8.8
-
-
Yes Bank
Neutral
1,175
-
49,457
7,190
9,011
3.2
3.3
58.2
69.7
20.2
16.9
3.6
3.1
19.2
19.6
-
-
FMCG
Asian Paints
Neutral
1,029
-
98,706
15,534
17,445
17.7
16.8
18.4
19.6
56.0
52.5
19.8
18.7
34.6
35.6
6.2
5.5
Stock Watch
July 19, 2016
Company Name
Reco
CMP
Target
Mkt Cap
Sales ( Čcr )
OPM(%)
EPS (Č)
PER(x)
P/BV(x)
RoE(%)
EV/Sales(x)
(Č)
Price ( Č)
( Č cr )
FY16E FY17E
FY16E
FY17E
FY16E
FY17E
FY16E
FY17E
FY16E
FY17E
FY16E
FY17E
FY16E
FY17E
FMCG
Britannia
Neutral
2,819
-
33,821
8,481
9,795
14.0
14.1
65.5
78.3
43.0
36.0
20.4
16.7
38.3
41.2
3.9
3.4
Colgate
Neutral
929
-
25,262
4,136
4,632
22.5
23.3
22.2
25.3
41.8
36.7
25.5
22.7
68.6
67.5
6.0
5.3
Dabur India
Neutral
313
-
55,123
9,370
10,265
17.6
17.3
7.3
8.1
42.7
38.7
11.1
10.1
31.7
30.6
5.7
5.2
GlaxoSmith Con*
Neutral
6,319
-
26,573
4,519
5,142
19.6
19.8
164.3
191.2
38.5
33.1
10.7
9.1
30.8
29.9
5.3
4.6
Godrej Consumer
Neutral
1,585
-
53,990
9,003
10,335
18.1
18.7
34.1
41.8
46.5
37.9
10.0
8.6
23.9
24.8
6.2
5.4
HUL
Neutral
920
-
199,208
33,299
35,497
17.1
17.1
18.9
20.0
48.7
46.0
42.7
37.2
87.6
80.8
5.9
5.5
ITC
Neutral
249
-
300,503
36,837
39,726
38.8
38.7
8.2
9.0
30.6
27.7
8.5
7.5
27.8
26.9
7.6
7.1
Marico
Neutral
279
-
35,976
6,151
6,966
17.2
17.3
5.4
6.4
51.6
43.6
16.2
12.8
33.2
32.4
5.7
5.1
Nestle*
Neutral
6,597
-
63,608
9,393
10,507
22.2
22.3
106.8
121.8
61.8
54.2
21.7
19.5
34.8
36.7
6.6
5.9
Tata Global
Neutral
130
-
8,202
8,635
9,072
9.8
9.9
5.8
7.2
22.4
18.1
2.0
1.9
6.8
7.4
1.0
0.9
Procter & Gamble
Buy
6,350
7,369
20,613
2,588
2,939
23.3
23.2
130.2
146.2
48.8
43.4
97.2
93.3
27.6
25.3
7.5
6.5
Hygiene
IT
HCL Tech^
Buy
723
1,000
101,927
37,061
30,781
21.5
20.5
51.4
40.0
14.1
18.1
3.6
2.6
20.1
20.3
2.5
2.6
Infosys
Buy
1,082
1,374
248,461
62,441
70,558
27.5
27.5
59.0
65.3
18.3
16.6
3.7
3.4
22.2
22.4
3.4
2.9
TCS
Buy
2,434
3,004
479,504
108,646
122,770
28.3
28.3
123.7
141.0
19.7
17.3
6.5
6.0
33.1
34.6
4.0
3.4
Tech Mahindra
Buy
507
700
49,254
26,494
30,347
16.3
17.0
32.2
37.5
15.8
13.5
3.4
3.0
21.7
21.8
1.6
1.3
Wipro
Buy
552
680
136,383
50,808
56,189
23.7
23.8
37.3
40.7
14.8
13.6
2.8
2.6
19.2
17.7
2.2
1.8
Media
D B Corp
Neutral
381
-
6,998
2,025
2,187
27.4
27.4
17.4
18.9
21.9
20.2
4.9
4.5
22.9
23.7
3.5
3.2
HT Media
Neutral
79
-
1,835
2,495
2,673
12.9
13.2
6.8
7.2
11.6
11.0
0.9
0.9
7.5
7.8
0.3
0.3
Jagran Prakashan
Accumulate
178
205
5,830
2,107
2,355
33.5
28.0
10.1
10.8
17.8
16.5
4.1
3.6
23.3
21.7
2.9
2.5
Sun TV Network
Neutral
381
-
15,028
2,510
2,763
71.8
71.5
21.9
24.8
17.4
15.4
4.1
3.7
22.8
24.3
5.6
5.1
Hindustan Media
Neutral
276
-
2,023
914
1,016
21.7
21.5
21.9
23.3
12.6
11.9
2.3
1.9
18.0
16.2
1.6
1.4
Ventures
Metals & Mining
Coal India
Buy
322
380
203,103
76,167
84,130
19.9
22.3
22.4
25.8
14.3
12.5
5.2
5.0
35.5
41.0
2.0
1.8
Hind. Zinc
Neutral
189
-
79,859
14,641
14,026
50.4
50.4
17.7
16.0
10.7
11.8
1.6
1.5
16.2
13.2
3.3
3.2
Hindalco
Neutral
137
-
28,290
104,356
111,186
8.7
9.5
6.7
11.1
20.4
12.4
0.7
0.7
3.5
5.9
0.8
0.7
JSW Steel
Neutral
1,602
-
38,732
42,308
45,147
16.4
20.7
(10.3)
49.5
32.4
1.8
1.7
(1.0)
5.6
2.0
1.8
NMDC
Neutral
95
-
37,645
8,237
10,893
46.6
44.5
10.0
11.7
9.6
8.1
1.1
0.9
12.5
13.0
4.4
3.3
SAIL
Neutral
48
-
19,990
45,915
53,954
7.2
10.5
1.5
4.4
32.1
11.1
0.5
0.5
2.3
4.1
1.1
1.0
Vedanta
Neutral
160
-
47,480
71,445
81,910
26.2
26.3
12.9
19.2
12.4
8.4
0.9
0.8
7.2
8.9
1.1
0.9
Tata Steel
Neutral
366
-
35,508
126,760
137,307
8.9
11.3
6.4
23.1
57.5
15.8
1.2
1.1
2.0
7.1
0.9
0.8
Stock Watch
July 19, 2016
Company Name
Reco
CMP
Target
Mkt Cap
Sales ( Čcr )
OPM(%)
EPS (Č)
PER(x)
P/BV(x)
RoE(%)
EV/Sales(x)
(Č)
Price ( Č)
( Č cr )
FY16E FY17E
FY16E
FY17E
FY16E
FY17E
FY16E
FY17E
FY16E
FY17E
FY16E
FY17E
FY16E
FY17E
Oil & Gas
Cairn India
Neutral
172
-
32,257
11,323
12,490
49.4
51.0
20.7
20.7
8.3
8.3
0.5
0.5
6.4
6.1
1.9
1.2
GAIL
Neutral
387
-
49,033
64,856
70,933
9.1
9.6
24.0
28.9
16.1
13.4
1.4
1.3
8.8
9.6
1.0
0.9
ONGC
Neutral
219
-
187,365
154,564
145,998
36.8
37.4
20.8
22.6
10.5
9.7
1.0
0.9
10.1
9.7
1.5
1.6
Petronet LNG
Neutral
287
-
21,521
29,691
31,188
5.8
6.2
12.8
13.4
22.5
21.4
3.4
3.0
15.8
14.8
0.8
0.8
Indian Oil Corp
Neutral
473
-
114,757
359,607
402,760
5.9
6.1
42.5
48.7
11.1
9.7
1.5
1.3
14.1
14.4
0.4
0.4
Reliance Industries
Neutral
1,004
-
325,623
304,775
344,392
12.6
13.4
91.3
102.6
11.0
9.8
1.2
1.1
11.8
12.0
1.0
0.8
Pharmaceuticals
Alembic Pharma
Neutral
581
-
10,957
3,145
3,483
31.9
16.2
38.2
18.7
15.2
31.1
6.9
5.8
57.9
20.1
3.4
3.1
Aurobindo Pharma
Neutral
751
-
43,926
13,651
15,702
21.7
21.7
33.9
38.4
22.1
19.6
6.2
4.8
32.5
27.7
3.5
3.1
Aventis*
Accumulate
4,492
4,738
10,346
2,049
2,375
15.4
17.3
115.4
153.5
38.9
29.3
6.4
5.0
19.3
25.8
4.8
4.0
Cadila Healthcare
Accumulate
361
400
36,911
9,469
11,246
21.2
22.0
14.9
17.1
24.2
21.1
6.9
5.4
28.8
26.6
3.9
3.3
Cipla
Neutral
508
-
40,829
13,372
15,378
16.4
17.4
18.8
21.6
27.0
23.5
3.4
3.0
13.3
13.7
3.1
3.0
Dr Reddy's
Neutral
3,570
-
60,874
15,471
17,479
24.6
24.6
138.2
152.4
25.8
23.4
4.7
4.1
19.7
18.7
3.9
3.5
Dishman Pharma
Neutral
134
-
2,166
1,733
1,906
21.5
21.5
10.1
10.0
13.3
13.4
1.6
1.4
10.5
11.2
1.8
1.5
GSK Pharma*
Neutral
3,412
-
28,897
2,741
3,528
16.5
18.9
44.2
60.1
77.2
56.8
17.0
16.9
21.2
29.9
10.3
8.1
Indoco Remedies
Neutral
301
-
2,773
977
1,112
14.9
18.2
9.0
13.2
33.4
22.8
4.8
4.1
15.1
19.2
2.9
2.6
Ipca labs
Buy
465
613
5,866
2,844
3,799
10.6
15.3
10.6
17.3
43.9
26.9
2.5
2.3
5.9
9.1
2.2
1.7
Lupin
Accumulate
1,665
1,809
75,072
13,702
15,912
23.7
26.4
50.5
58.1
33.0
28.7
6.8
5.6
22.9
21.4
6.0
4.8
Sun Pharma
Buy
777
944
186,916
27,744
31,129
26.0
30.0
22.0
28.0
35.3
27.7
5.1
4.3
18.3
18.7
6.5
5.6
Power
Tata Power
Neutral
70
-
19,027
35,923
37,402
22.6
22.8
4.1
5.2
17.4
13.7
1.3
1.2
7.5
9.3
1.5
1.4
NTPC
Neutral
156
-
128,217
87,271
99,297
23.5
23.5
11.8
13.3
13.2
11.7
1.5
1.4
11.5
12.2
2.5
2.2
Power Grid
Neutral
163
-
85,458
20,702
23,361
86.7
86.4
12.1
13.2
13.5
12.4
2.0
1.8
15.6
15.1
9.1
8.4
Real Estate
MLIFE
Buy
465
554
1,908
826
1,011
20.1
21.9
22.7
30.7
20.5
15.1
1.2
1.1
6.0
7.4
4.2
3.2
Telecom
Bharti Airtel
Neutral
363
-
145,286
101,748
109,191
32.1
31.7
12.0
12.5
30.3
29.1
2.1
2.0
6.9
6.7
2.1
1.9
Idea Cellular
Neutral
104
-
37,412
34,282
36,941
32.0
31.5
5.9
6.2
17.6
16.8
1.6
1.5
9.9
9.3
1.7
1.7
zOthers
Abbott India
Neutral
4,661
-
9,904
2,715
3,153
14.5
14.1
134.3
152.2
34.7
30.6
8.7
7.1
27.4
25.6
3.4
2.9
Bajaj Electricals
Accumulate
237
268
2,399
4,612
5,351
5.6
5.7
9.5
12.4
25.1
19.2
3.1
2.8
12.5
14.4
0.5
0.4
Finolex Cables
Neutral
377
-
5,772
2,520
2,883
12.2
12.0
12.7
14.2
29.8
26.6
4.1
3.6
13.6
13.5
2.0
1.7
Goodyear India*
Buy
522
631
1,204
1,750
1,598
11.3
10.4
53.7
49.4
9.7
10.6
2.1
1.8
23.0
18.2
0.5
0.4
Hitachi
Neutral
1,358
-
3,692
1,779
2,081
7.8
8.8
21.8
33.4
62.3
40.6
10.1
8.1
17.4
22.1
2.2
1.8
Stock Watch
July 19, 2016
Company Name
Reco
CMP
Target
Mkt Cap
Sales ( Čcr )
OPM(%)
EPS (Č)
PER(x)
P/BV(x)
RoE(%)
EV/Sales(x)
(Č)
Price ( Č)
( Č cr )
FY16E
FY17E
FY16E
FY17E
FY16E
FY17E
FY16E
FY17E
FY16E
FY17E
FY16E
FY17E
FY16E
FY17E
zOthers
Jyothy Laboratories
Neutral
288
-
5,220
1,620
1,847
11.5
11.5
7.3
8.5
39.5
34.0
5.1
4.7
13.3
14.4
3.1
2.7
MRF
Buy
34,492
45,575
14,629
20,316
14,488
21.4
21.1
5,488.0
3,798.0
6.3
9.1
2.1
1.7
41.1
21.2
0.7
0.9
Page Industries
Neutral
13,346
-
14,886
1,929
2,450
19.8
20.1
229.9
299.0
58.1
44.6
25.6
17.8
52.1
47.1
7.8
6.1
Relaxo Footwears
Neutral
484
-
5,812
1,767
2,152
12.3
12.5
19.3
25.1
25.2
19.3
6.2
4.7
27.7
27.8
3.3
2.7
Siyaram Silk Mills
Buy
1,049
1,347
983
1,619
1,799
11.6
11.6
93.5
104.9
11.2
10.0
1.9
1.6
17.1
16.4
0.9
0.8
Styrolution ABS India* Neutral
641
-
1,127
1,271
1,440
8.6
9.2
32.0
41.1
20.0
15.6
2.0
1.8
10.7
12.4
0.9
0.7
TVS Srichakra
Buy
2,379
2,932
1,821
2,035
2,252
15.9
15.3
248.6
268.1
9.6
8.9
4.2
3.0
43.6
33.9
0.9
0.8
HSIL
Neutral
297
-
2,150
2,123
2,384
16.1
16.5
15.0
18.9
19.8
15.8
1.5
1.4
8.0
9.4
1.4
1.2
Kirloskar Engines India
Neutral
263
-
3,803
2,403
2,554
8.6
9.9
9.2
10.5
28.6
25.1
2.7
2.6
9.7
10.7
1.2
1.1
Ltd
M M Forgings
Buy
414
546
499
511
615
21.7
21.6
43.1
55.8
9.6
7.4
1.8
1.4
19.9
21.2
1.2
0.9
Banco Products (India) Neutral
150
-
1,072
1,208
1,353
11.0
12.3
10.8
14.5
13.9
10.4
1.6
1.4
11.9
14.5
0.9
0.7
Competent Automobiles Neutral
143
-
88
1,040
1,137
3.2
3.1
25.7
28.0
5.5
5.1
0.8
0.7
15.0
14.3
0.1
0.1
Nilkamal
Neutral
1,195
-
1,783
1,871
2,031
10.7
10.5
63.2
69.8
18.9
17.1
3.1
2.6
17.6
16.6
1.0
0.9
Visaka Industries
Neutral
154
-
245
1,020
1,120
8.7
9.1
13.9
20.1
11.1
7.7
0.7
0.7
6.4
8.7
0.5
0.4
Transport Corporation of
Neutral
349
-
2,673
2,830
3,350
8.8
9.0
14.4
18.3
24.3
19.1
3.7
3.3
15.4
17.1
1.1
1.0
India
Elecon Engineering
Neutral
63
-
683
1,359
1,482
10.3
13.7
0.8
3.9
78.1
16.1
1.3
1.2
1.6
7.8
0.9
0.8
Surya Roshni
Buy
162
201
710
2,992
3,223
8.1
8.4
14.7
18.3
11.0
8.8
1.0
0.9
9.7
11.0
0.5
0.5
MT Educare
Neutral
155
-
618
286
366
18.3
17.7
7.7
9.4
20.1
16.6
4.2
3.7
20.2
21.1
2.1
1.6
Radico Khaitan
Buy
90
125
1,202
1,543
1,659
12.6
13.0
5.8
6.3
15.6
14.3
1.3
1.2
8.5
8.6
1.3
1.2
Garware Wall Ropes
Accumulate
404
460
883
828
898
11.2
10.3
28.3
29.0
14.3
13.9
2.4
2.1
16.8
14.9
1.0
0.9
Wonderla Holidays
Neutral
390
-
2,205
206
308
44.0
43.6
9.0
12.9
43.4
30.3
5.9
5.4
13.7
17.8
10.7
7.1
Linc Pen & Plastics
Neutral
256
-
379
344
382
9.1
9.1
12.4
13.1
20.7
19.6
3.7
3.3
18.0
16.7
1.2
1.1
The Byke Hospitality
Neutral
161
-
646
222
287
20.5
20.5
5.6
7.6
28.6
21.3
5.4
4.4
18.9
20.8
3.0
2.3
Interglobe Aviation
Neutral
950
-
34,245
17,022
21,122
20.7
14.5
63.9
53.7
14.9
17.7
22.3
18.3
149.9
103.2
2.1
1.7
Coffee Day Enterprises
Neutral
237
-
4,879
2,692
2,964
17.0
18.6
-
4.7
-
50.0
2.9
2.7
0.2
5.5
2.2
2.1
Ltd
Navneet Education
Neutral
96
-
2,294
998
1,062
24.1
24.0
5.8
6.1
16.7
15.8
3.7
3.3
22.0
20.6
2.4
2.3
Navkar Corporation
Buy
210
265
2,990
347
408
43.2
42.9
6.7
6.8
31.4
31.0
2.3
2.1
7.3
6.9
9.2
8.3
UFO Moviez
Neutral
554
-
1,529
558
619
32.0
33.2
22.5
30.0
24.6
18.5
3.0
2.6
12.0
13.8
2.6
2.2
VRL Logistics
Neutral
313
-
2,858
1,725
1,902
16.5
16.7
12.2
14.6
25.7
21.5
5.4
4.7
20.8
21.9
1.8
1.6
Stock Watch
July 19, 2016
Company Name
Reco
CMP
Target Mkt Cap
Sales ( Čcr )
OPM(%)
EPS (Č)
PER(x)
P/BV(x)
RoE(%)
EV/Sales(x)
(Č)
Price ( Č)
( Č cr )
FY16E FY17E FY16E FY17E FY16E FY17E FY16E FY17E FY16E FY17E FY16E FY17E FY16E FY17E
zOthers
Team Lease Serv.
Neutral
1,027
-
1,756
2,565
3,229
1.3
1.5
15.2
22.8
67.7
45.1
5.4
4.8
8.0
10.7
0.6
0.4
S H Kelkar & Co.
Neutral
224
-
3,242
928
1,036
15.3
15.1
4.9
6.1
45.4
36.7
4.3
3.9
9.4
10.7
3.4
3.0
Quick Heal
Neutral
252
-
1,767
339
408
27.8
27.3
7.1
7.7
35.7
32.6
3.0
3.0
8.5
9.3
4.6
3.9
Narayana Hrudaya
Neutral
297
-
6,074
1,603
1,873
10.9
11.5
1.0
2.6
312.0
112.4
7.5
6.9
2.4
6.1
3.8
3.3
Manpasand Bever.
Neutral
667
-
3,339
540
836
19.9
19.6
10.2
16.9
65.1
39.5
5.3
4.7
8.1
12.0
5.9
3.8
Parag Milk Foods
Neutral
318
-
2,675
1,645
1,919
9.0
9.3
6.7
9.5
47.3
33.7
6.2
5.2
13.1
15.5
1.9
1.6
Source: Company, Angel Research; Note: *December year end; #September year end; &October year end; Price as on July 18, 2016
Market Outlook
July 19, 2016
Research Team Tel: 022 - 39357800
DISCLAIMER
Angel Broking Private Limited (hereinafter referred to as “Angel”) is a registered Member of National Stock Exchange of India Limited,
Bombay Stock Exchange Limited and Metropolitan Stock Exchange of India Limited. It is also registered as a Depository Participant with
CDSL and Portfolio Manager with SEBI. It also has registration with AMFI as a Mutual Fund Distributor. Angel Broking Private Limited is
a registered entity with SEBI for Research Analyst in terms of SEBI (Research Analyst) Regulations, 2014 vide registration number
INH000000164. Angel or its associates has not been debarred/ suspended by SEBI or any other regulatory authority for accessing
/dealing in securities Market.
This document is solely for the personal information of the recipient, and must not be singularly used as the basis of any investment
decision. Nothing in this document should be construed as investment or financial advice. Each recipient of this document should
make such investigations as they deem necessary to arrive at an independent evaluation of an investment in the securities of the
companies referred to in this document (including the merits and risks involved), and should consult their own advisors to determine
the merits and risks of such an investment.
Reports based on technical and derivative analysis center on studying charts of a stock's price movement, outstanding positions and
trading volume, as opposed to focusing on a company's fundamentals and, as such, may not match with a report on a company's
fundamentals.
The information in this document has been printed on the basis of publicly available information, internal data and other reliable
sources believed to be true, but we do not represent that it is accurate or complete and it should not be relied on as such, as this
document is for general guidance only. Angel Broking Pvt. Limited or any of its affiliates/ group companies shall not be in any way
responsible for any loss or damage that may arise to any person from any inadvertent error in the information contained in this report.
Angel Broking Pvt. Limited has not independently verified all the information contained within this document. Accordingly, we cannot
testify, nor make any representation or warranty, express or implied, to the accuracy, contents or data contained within this document.
While Angel Broking Pvt. Limited endeavors to update on a reasonable basis the information discussed in this material, there may be
regulatory, compliance, or other reasons that prevent us from doing so.
This document is being supplied to you solely for your information, and its contents, information or data may not be reproduced,
redistributed or passed on, directly or indirectly.
Neither Angel Broking Pvt. Limited, nor its directors, employees or affiliates shall be liable for any loss or damage that may arise from
or in connection with the use of this information.
Disclosure:
Angel or its associates including its relatives/analyst do not hold any financial interest/beneficial ownership of more than 1% in the
company covered by Analyst. Angel or its associates/analyst has not received any compensation / managed or co-managed public
offering of securities of the company covered by Analyst during the past twelve months. Angel/analyst has not served as an officer,
director or employee of company covered by Analyst and has not been engaged in market making activity of the company covered by
Analyst.