Market Outlook
November 18, 2015
Market Cues
Domestic Indices
Chg (%)
(Pts)
(Close)
Indian markets are expected to open flat to negative tracking the SGX Nifty and
BSE Sensex
0.4
104
25,864
global cues.
Nifty
0.4
31
7,837
US markets ended the session roughly flat after showing a substantial move to the
Mid Cap
0.3
33
10,711
upside in the previous session. The choppy trading on Wall Street came as traders
Small Cap
0.5
52
11,233
expressed uncertainty about the outlook for the markets following the terrorist
Bankex
(0.2)
(51)
19,603
attacks in Paris.
The European markets surged Tuesday, as investors shrugged off geopolitical
Global Indices
Chg (%)
(Pts)
(Close)
concerns. Defence stocks were among the best performers, following the terrorist
attacks in Paris late Friday. Investor sentiment also received a boost from the
Dow Jones
00
6.4
17,490
stronger than expected German economic confidence report.
Nasdaq
0.0
1
4,986
Indian markets extended rally for second consecutive session, tracking strength seen
FTSE
2.0
122
6,287
in Asian and European indices on the back of rally seen in the US markets in
Nikkei
1.2
237
19,631
overnight trade. The sentiment on the Street remained strong, with 20 of the Sensex
Hang Seng
1.2
253
22,264
stocks ending the day in positive. Relief rally in FMCG, metals and select banking &
Shanghai Com
(0.1)
(2)
3,605
financials helped the Sensex close 0.4% points higher at 25,864. Infosys declined
more than 1.8 percent on margin warning for second half of FY16.
Advances / Declines
BSE
NSE
News & Result Analysis
Advances
1,383
815
CCI imposes `258 cr fine on Jet Airways, IndiGo, SpiceJet
Declines
1,310
695
SpiceJet in talks to buy 150 planes
Unchanged
166
84
Detailed analysis on Pg2
estor’s Ready Reckoner
Volumes (` Cr)
Key Domestic & Global Indicators
BSE
2,520
Stock Watch: Latest investment recommendations on 150+ stocks
NSE
15,313
Refer P4 onwards
Net Inflows (` Cr)
Net
Mtd
Ytd
Top Picks
CMP
Target
Upside
FII
(947)
(2,927)
(17,747)
Company
Sector
Rating
(`)
(`)
(%)
MFs
(3.5)
1,883
52,230
Axis Bank
Financials
Buy
475
630
32.5
HCL Tech
IT
Buy
854
1,132
32.6
Top Gainers
Price (`)
Chg (%)
ICICI Bank
Financials
Buy
267
357
33.4
Renuka
16
19.2
Ashok Leyland
Automobiles
Buy
92
111
20.7
Larsen & Toubro
Construction
Buy
1,354
1,646
21.6
Centurytex
736
11.9
More Top Picks on Pg3
Pmcfin
1
9.6
Eidparry
209
9.3
Key Upcoming Events
Kscl
418
7.6
Previous
Consensus
Date
Region
Event Description
Reading
Expectations
Nov 19
UK
Retail Sales (Oct)(MoM)
1.9%
(0.5)%
Top Losers
Price (`)
Chg (%)
Nov 24
US
GDP (QoQ) (Q3)
1.5%
2.0%
Rtnpower
9
(3.0)
Nov 27
UK
GDP (QoQ) (Q3)
0.5%
-
Sobha
312
(2.9)
Dec 1
India
RBI Repo Rate
6.75%
-
Hathway
44
(2.8)
Jpassociat
13
(2.7)
Welcorp
104
(2.7)
As on November 17, 2015
Market Outlook
November 18, 2015
CCI imposes `258 cr fine on Jet Airways, IndiGo, SpiceJet
Clamping down on unfair business practices in the aviation sector, Competition
Commission slapped penalties totalling `258cr on Jet Airways, IndiGo and
SpiceJet for cartelisation in fixing fuel surcharge for transporting cargo.
The Competition Commission of India (CCI) has penalised three carriers -- Jet
Airways, InterGlobe Aviation Ltd and SpiceJet -- for "concerted action in fixing and
revising Fuel Surcharge (FSC) for transporting cargo."
While a penalty of `151.69cr has been imposed on Jet Airways, the fines slapped
on InterGlobe and SpiceJet are `63.74cr and `42.48cr, respectively.
InterGlobe Aviation operates no-frills carrier IndiGo. These carriers have also been
directed to cease and desist from indulging in anti-competitive practices.
According to CCI, such anti-competitive ways in the air cargo industry undermines
economic development of the country and ultimately acts to the detriment of end-
consumers.
However, considering the precarious financial position of airlines, the penalty was
imposed by the Commission at the rate of one per cent of their average turnover
of the last three financial years.
SpiceJet in talks to buy 150 planes
SpiceJet has initiated talks with aircraft manufacturers to place orders for at least
150 planes. SpiceJet is in talks to buy 100 narrow-bodied aircraft (Boeing 737
MAX or Airbus 320 Neo) and 50 turboprop aircraft. Large aircraft for metros and
larger towns and small aircraft for smaller regional towns. Currently, SpiceJet
operates a fleet of 25 Boeing, two Airbus (on wet lease) and 14 Bombardier
aircraft. SpiceJet's decision to opt for two types of aircraft is further bolstered by the
draft civil aviation policy, which has put emphasis on carriers to fly regional routes.
Market leader IndiGo has 430 aircraft on order from Airbus, while earlier this
month Jet Airways placed an order for 75 Boeing 737 Max. SpiceJet, in view of its
financial vulnerability earlier under the Marans, has been late in placing an order
to add a new fleet.
Economic and Political News
Policy on coal linkages likely in 15 days: Govt
Labour Ministry to push for 6 bills in Winter Session
7th Pay Commission will submit its report to Finance Minister Arun Jaitley on
November 19
Corporate News
Aiming for 15-20% topline growth in FY16: J Kumar Infra
SpiceJet likely to challenge CCI penalty order
Bhushan Steel, Electrosteel Steels might look for strategic investors
Market Outlook
November 18, 2015
Top Picks ★★★★★
Large Cap
Market Cap
CMP
Target
Upside
Company
Rationale
(` Cr)
(`)
(`)
(%)
To outpace battery industry growth due to better technological
Amara Raja Batteries
15,389
901
1,040
15.4
products leading to market share gains in both the automotive
OEM and replacement segments.
Earnings to grow strongly given the MHCV cyclical upturn.
Ashok Leyland
26,168
92
111
20.7
Focus on exports and LCV's provides additional growth
avenue.
Healthy pace of branch expansion, backed by distribution
Axis Bank
1,13,008
475
630
32.5
network, will be the driving force for the bank’s retail business
and overall earnings.
The stock is trading at attractive valuations and is factoring all
HCL Tech
1,20,041
854
1,132
32.6
the bad news.
Strong visibility for a robust 20% earnings trajectory, coupled
HDFC Bank
2,67,130
1,061
1,262
19.0
with high quality of earnings on account of high quality retail
business and strategic focus on highly rated corporates.
Due to its robust franchise and capital adequacy position, the
bank is well positioned to grow by at least a few percentage
ICICI Bank
1,55,268
267
357
33.4
points higher than the average industry growth rate from a
structural point of view.
Back on the growth trend, expect a long term growth of 14%
Infosys
2,43,729
1,061
1,306
23.1
to be a US$20bn in FY2020.
Well positioned to benefit from such expected gradual
recovery in the overall domestic capex cycle, given its presence
Larsen & Toubro
1,25,970
1,354
1,646
21.6
across various infrastructure segments, its execution
capabilities, and its strong balance sheet.
LICHF continues to grow its retail loan book at a healthy pace
with improvement in asset quality. We expect the company to
LIC Housing Finance
23,497
466
571
22.6
post a healthy loan book which is likely to reflect in a strong
earnings growth.
Source: Company, Angel Research
Mid Cap
Market Cap
CMP
Target
Upside
Company
Rationale
(` Cr)
(`)
(`)
(%)
Government thrust on Renewable sector and strong order
Inox Wind
8,096
365
505
38.4
book would drive future growth.
Change in business focus towards high-margin chronic and
Ipca labs
9,378
743
900
21.1
lifestyle segments and increasing penetration in Europe and
US
Economic recovery to have favourable impact on advertising &
circulation revenue growth. Further, the acquisition of a radio
Jagran Prakashan
4,843
148
169
14.1
business (Radio City) would also boost the company's revenue
growth.
Strong brand & quality teaching with innovative technologies
MT Educare
521
131
169
29.2
& higher government educational spending to boost growth
Earnings boost on back of stable material prices and
Radico Khaitan
1,624
122
156
27.8
favourable pricing environment. Valuation discount to peers
provides additional comfort
Strong brands and distribution network would boost growth
Siyaram Silk Mills
878
937
1,145
22.2
going ahead. Stock currently trades at an inexpensive
valuation.
Structural shift in the Lighting industry towards LED lighting will
Surya Roshni
576
131
183
39.3
drive growth.
Source: Company, Angel Research
Market Outlook
November 18, 2015
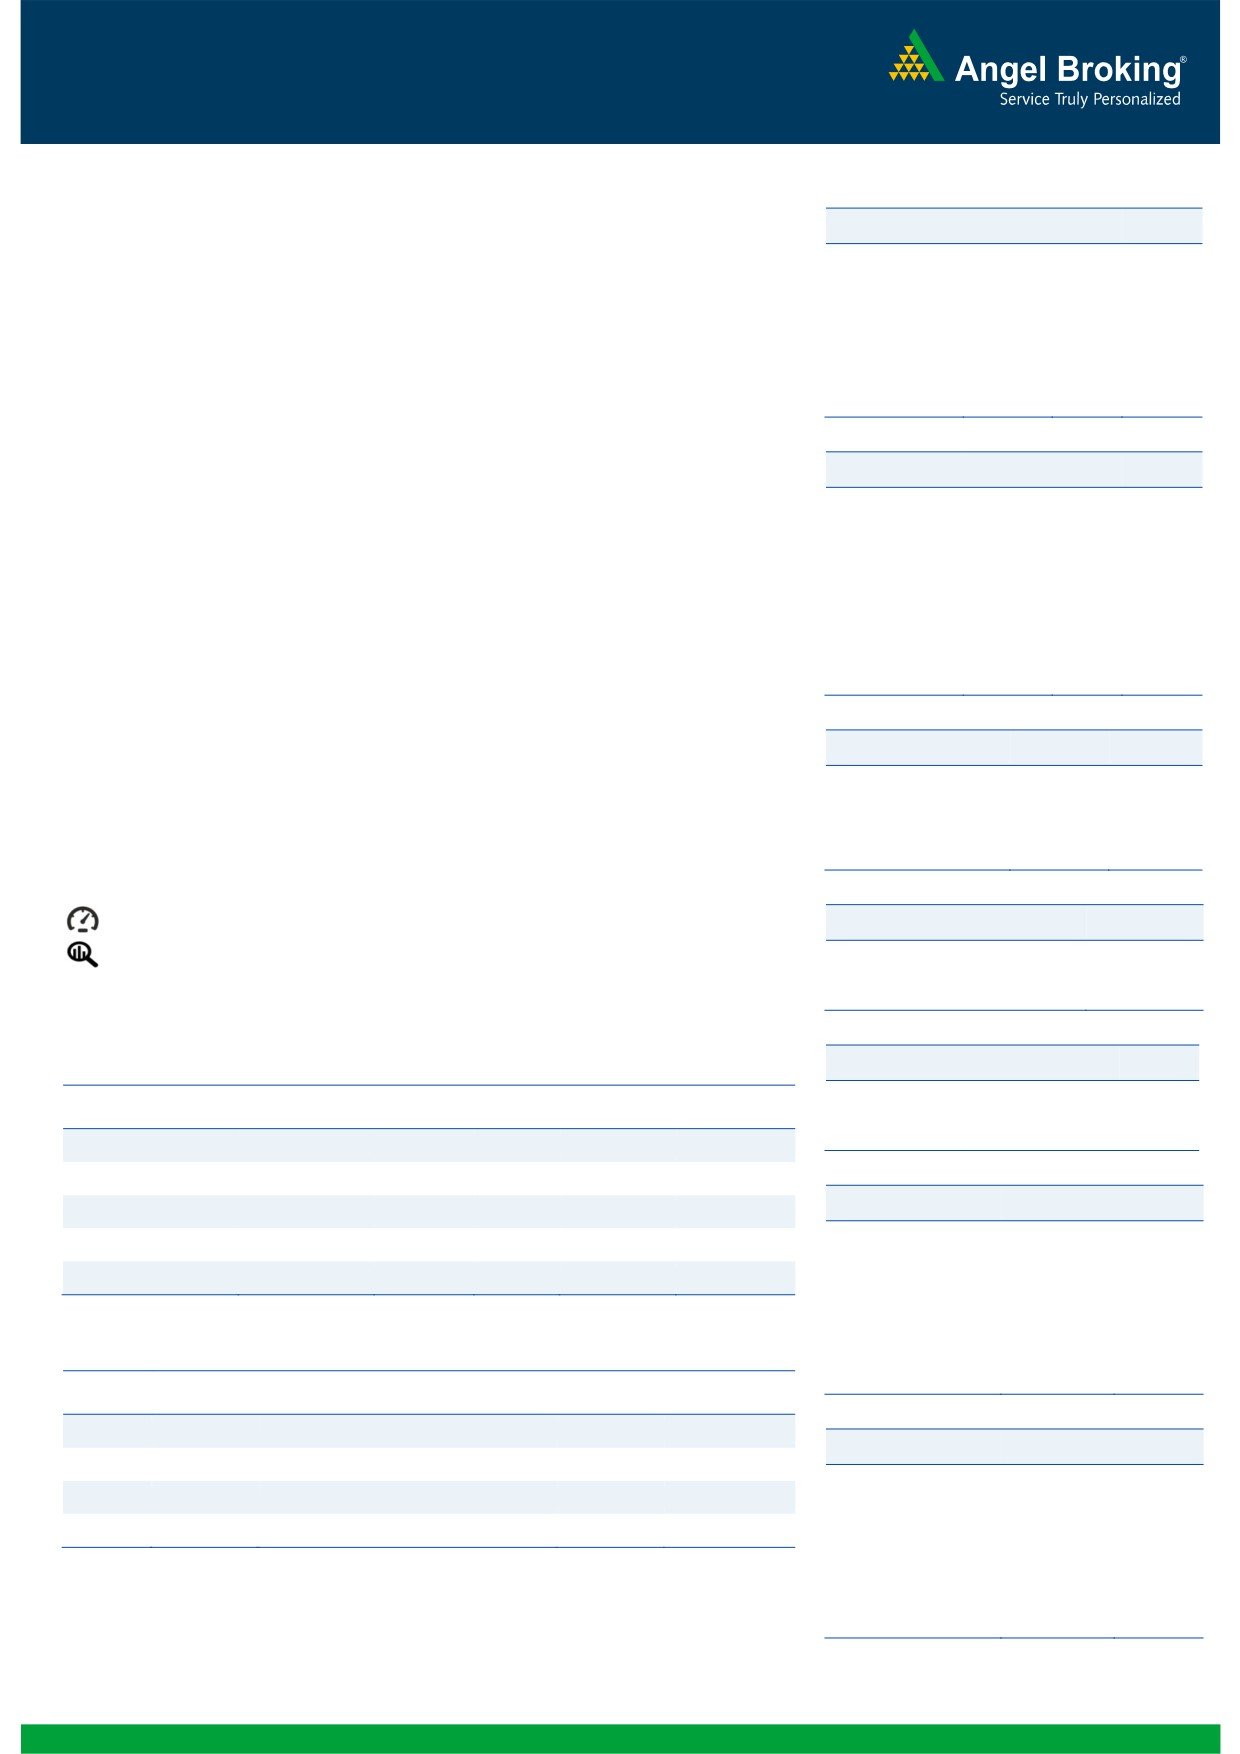
Macro watch
Exhibit 1: Quarterly GDP trends
Exhibit 2: IIP trends
(%)
(%)
9.0
8.4
7.0
6.3
8.0
7.5
7.5
6.0
5.2
7.0
7.0
4.8
6.7
6.7
5.0
7.0
6.4
6.6
4.2
4.1
6.3
3.6
3.6
4.0
6.0
2.8
3.0
2.5
2.5
5.0
3.0
4.7
5.0
2.0
4.0
1.0
3.0
-
Source: CSO, Angel Research
Source: MOSPI, Angel Research
Exhibit 3: Monthly CPI inflation trends
Exhibit 4: Manufacturing and services PMI
(%)
56.0
Mfg. PMI
Services PMI
6.0
5.4
5.3
5.4
5.2
5.0
5.0
54.0
4.9
5.0
4.3
4.4
3.7
3.7
52.0
4.0
3.3
50.0
3.0
2.0
48.0
1.0
46.0
-
44.0
Source: MOSPI, Angel Research
Source: Market, Angel Research; Note: Level above 50 indicates expansion
Exhibit 5: Exports and imports growth trends
Exhibit 6: Key policy rates
(%)
Exports yoy growth
Imports yoy growth
(%)
Repo rate
Reverse Repo rate
CRR
30.0
9.00
20.0
8.00
10.0
7.00
0.0
6.00
(10.0)
5.00
(20.0)
4.00
(30.0)
3.00
Source: Bloomberg, Angel Research
Source: RBI, Angel Research
Market Outlook
November 18, 2015
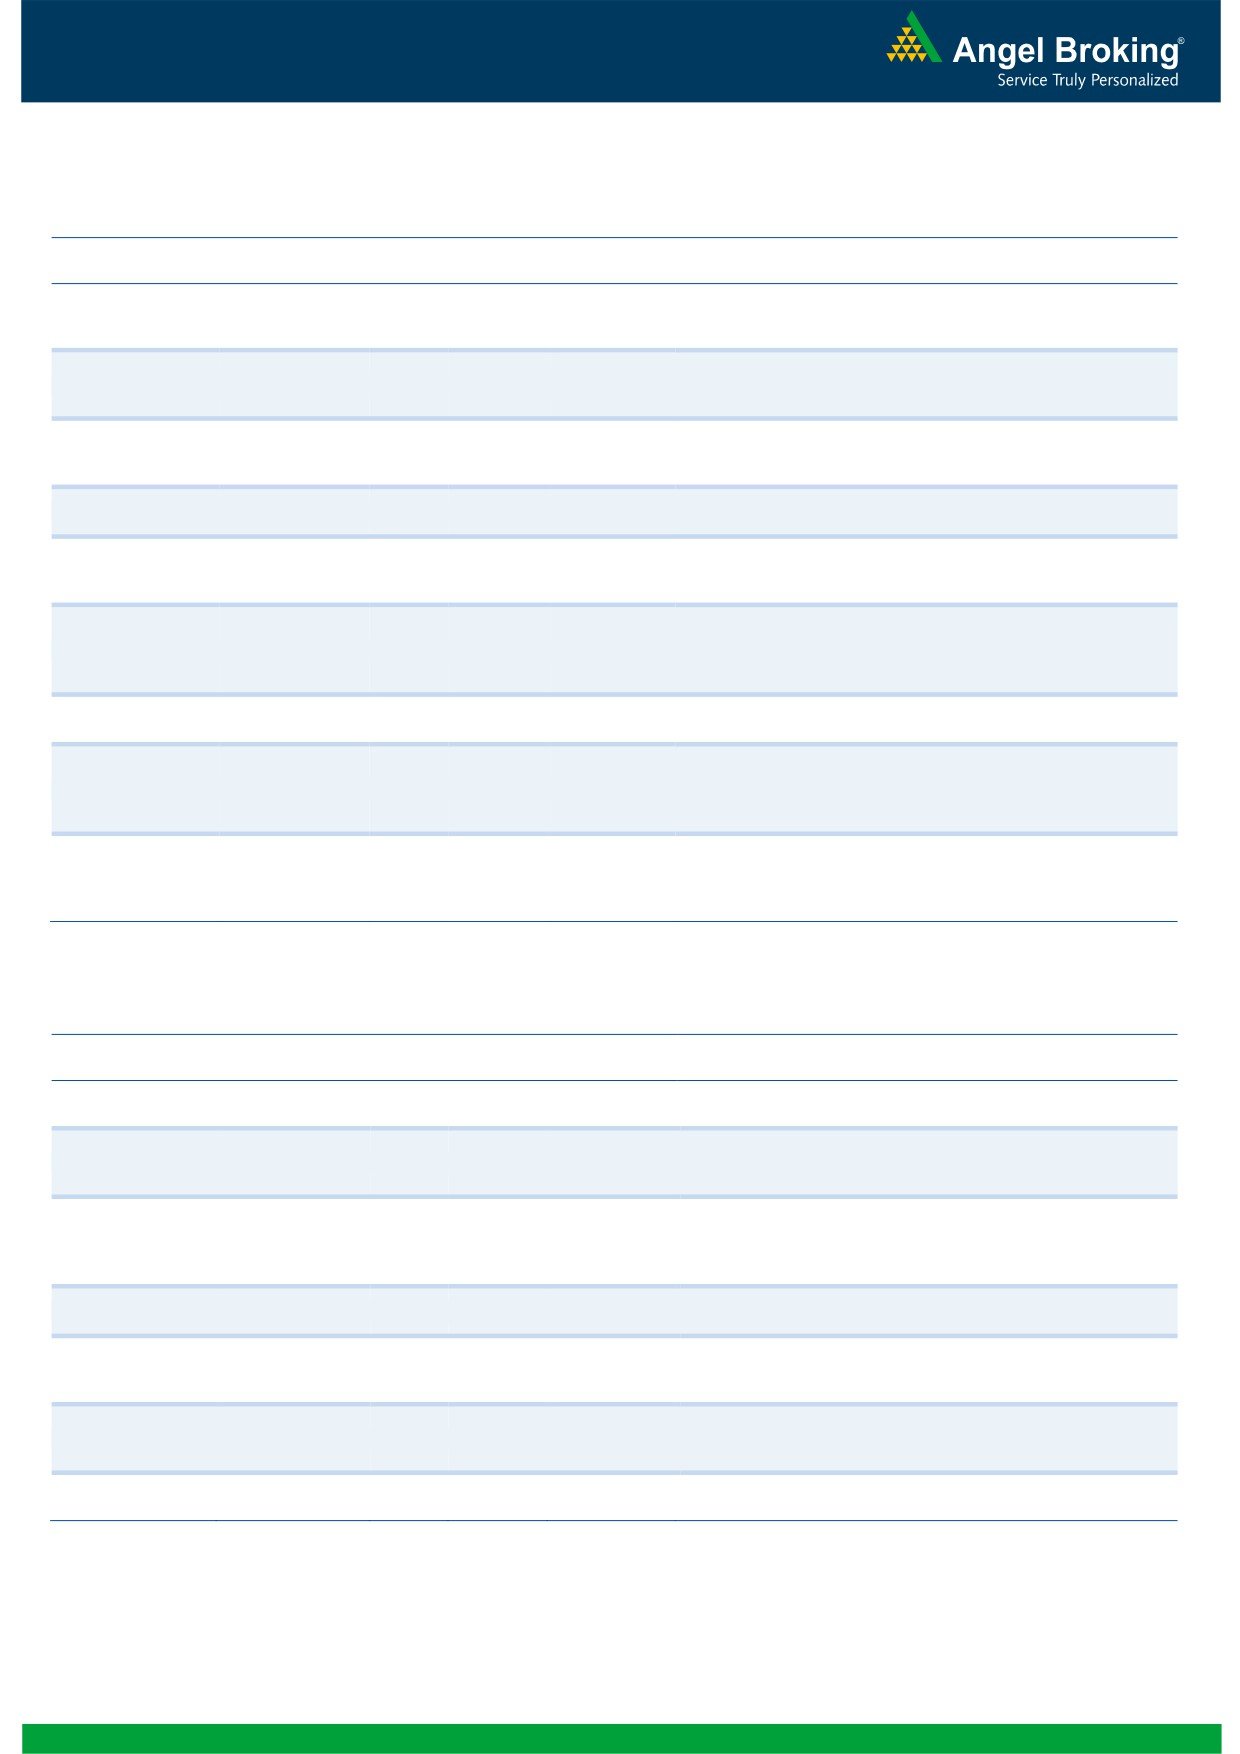
Global watch
Exhibit 1: Latest quarterly GDP Growth (%, yoy) across select developing and developed countries
(%)
8.0
6.9
5.3
6.0
4.9
4.7
4.0
2.8
2.3
2.0
1.6
2.0
1.2
1.1
0.8
(2.6)
-
(2.0)
(4.0)
(4.6)
(6.0)
Source: Bloomberg, Angel Research
Exhibit 2: 2015 GDP Growth projection by IMF (%, yoy) across select developing and developed countries
(%)
10.0
7.5
8.0
6.8
5.2
6.0
4.8
3.7
3.1
4.0
2.7
2.0
1.6
2.0
1.2
1.0
-
(2.0)
(4.0)
(1.0)
(3.8)
(6.0)
Source: IMF, Angel Research
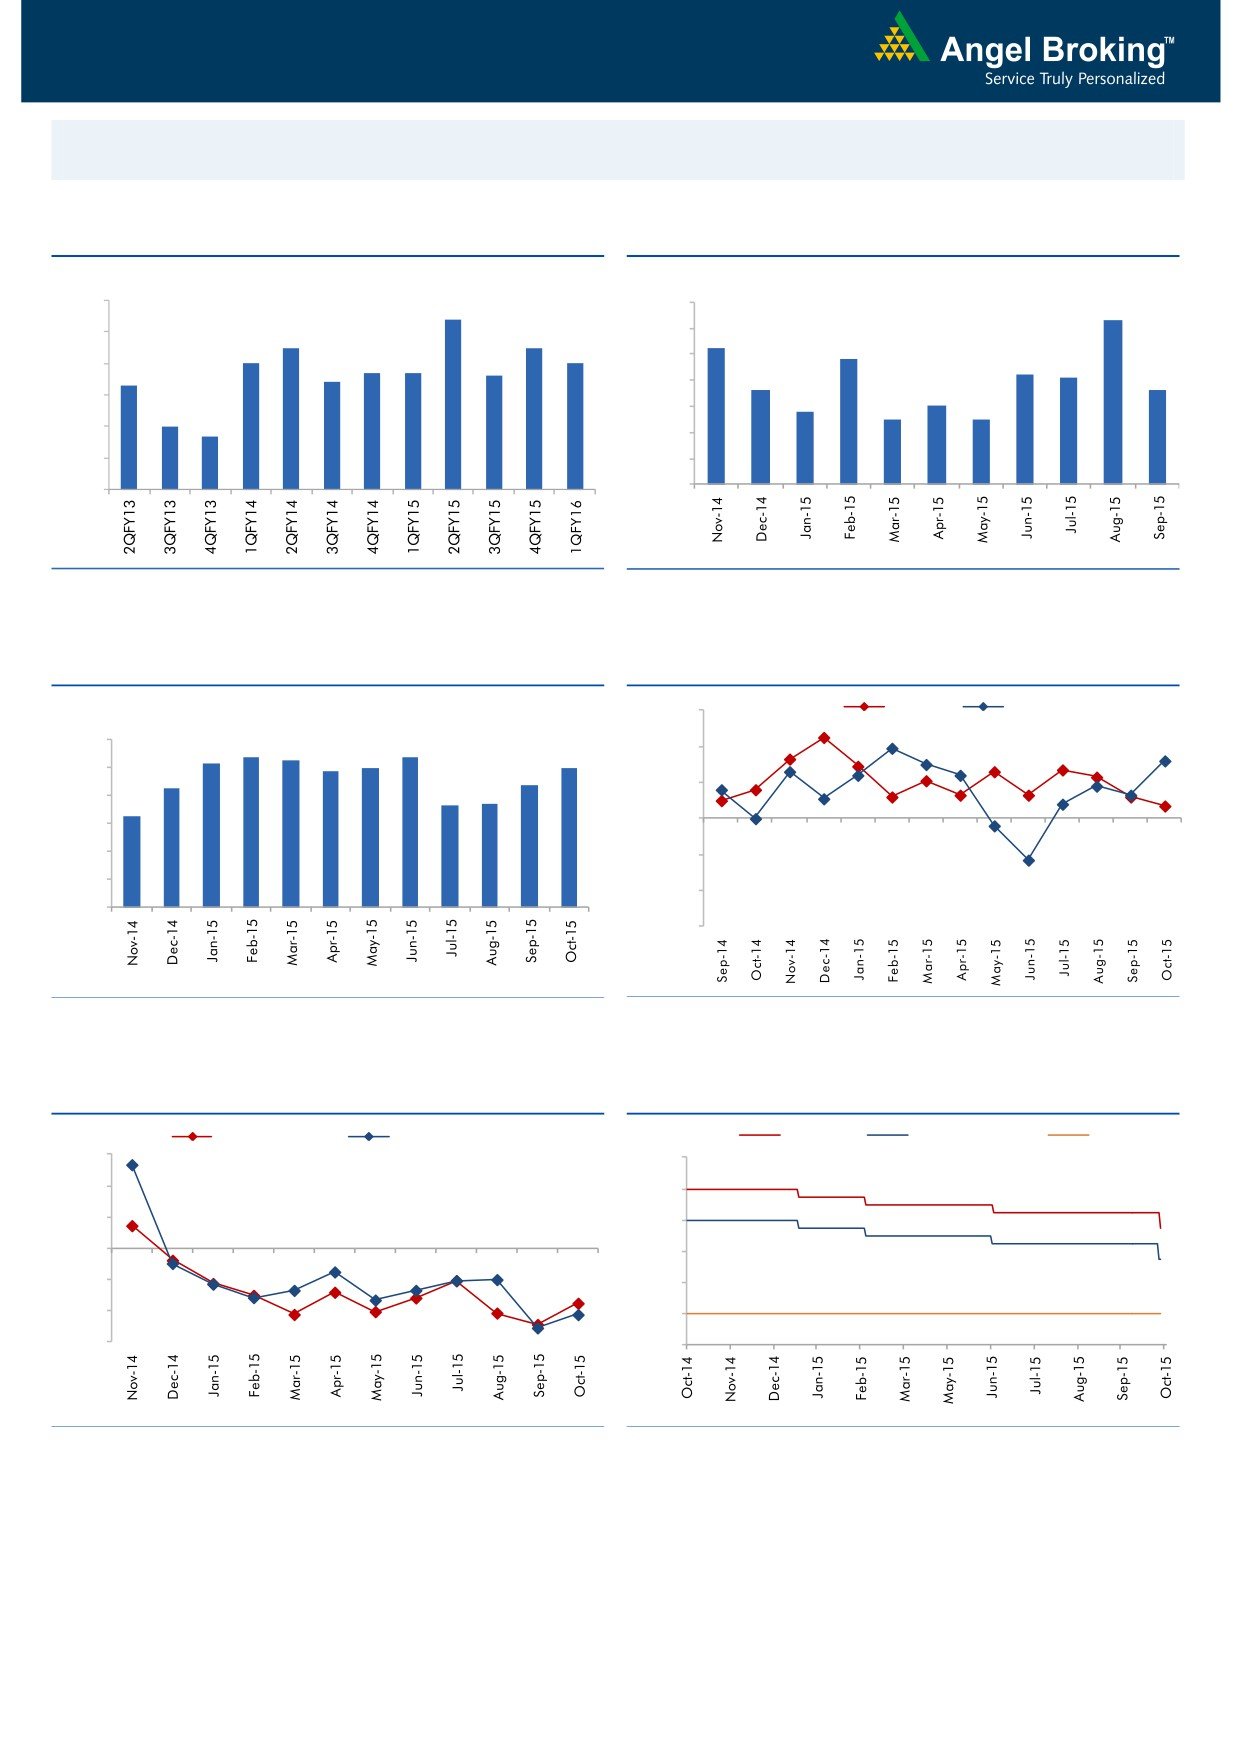
Exhibit 3: One year forward P-E ratio across select developing and developed countries
(x)
20.0
18.0
16.0
14.0
12.0
10.0
8.0
6.0
4.0
2.0
-
Source: IMF, Angel Research
Market Outlook
November 18, 2015
Exhibit 4: Relative performance of indices across globe
Returns (%)
Country
Name of index
Closing price
1M
3M
1YR
Brazil
Bovespa
47,247
0.0
(0.4)
(7.8)
Russia
Micex
1,787
4.0
5.7
18.6
India
Nifty
7,838
(5.0)
(7.4)
(7.0)
China
Shanghai Composite
3,605
6.5
(3.8)
46.9
South Africa
Top 40
46,751
(1.5)
2.8
4.3
Mexico
Mexbol
44,185
(0.4)
0.7
1.6
Indonesia
LQ45
771
(0.2)
1.2
(12.1)
Malaysia
KLCI
1,662
(3.2)
5.2
(8.6)
Thailand
SET 50
893
(3.0)
(0.2)
(15.5)
USA
Dow Jones
17,490
1.6
(0.1)
(0.9)
UK
FTSE
6,269
(1.8)
(4.0)
(6.6)
Japan
Nikkei
19,631
8.3
(3.6)
14.3
Germany
DAX
10,971
8.6
0.5
16.0
France
CAC
4,937
5.0
(0.7)
15.8
Source: Bloomberg, Angel Research
Stock Watch
November 18, 2015
Company Name
Reco
CMP
Target
Mkt Cap
Sales ( Čcr )
OPM(%)
EPS (Č)
PER(x)
P/BV(x)
RoE(%)
EV/Sales(x)
(Č)
Price ( Č)
( Č cr )
FY16E FY17E
FY16E
FY17E
FY16E
FY17E
FY16E
FY17E
FY16E
FY17E
FY16E
FY17E
FY16E
FY17E
Agri / Agri Chemical
Rallis
Neutral
199
-
3,868
2,075
2,394
14.4
14.4
9.5
11.0
20.9
18.1
4.2
3.6
21.1
21.3
1.9
1.6
United Phosphorus
Accumulate
444
510
19,043
13,698
15,752
17.6
17.6
32.1
38.5
13.8
11.5
2.7
2.3
21.4
21.3
1.5
1.2
Auto & Auto Ancillary
Ashok Leyland
Buy
92
111
26,168
18,763
22,357
11.1
11.2
3.6
4.8
25.5
19.2
4.7
4.3
18.7
22.6
1.4
1.1
Bajaj Auto
Accumulate
2,364
2,672
68,402
24,115
27,600
21.3
21.0
136.8
157.2
17.3
15.0
5.6
4.7
32.2
31.5
2.4
2.1
Eicher Motors
Buy
15,490
19,036
42,043
15,379
16,498
15.6
16.6
473.2
574.8
32.7
27.0
12.1
9.0
36.7
33.2
2.7
2.4
Hero Motocorp
Neutral
2,598
-
51,875
28,561
31,559
14.7
14.7
151.1
163.2
17.2
15.9
6.7
5.7
38.7
35.6
1.7
1.5
L G Balakrishnan & Bros Neutral
457
-
717
1,254
1,394
11.6
11.8
35.9
41.7
12.7
11.0
1.7
1.5
13.5
13.8
0.7
0.6
Mahindra and Mahindra Accumulate
1,288
1,410
80,025
38,513
43,579
13.6
13.7
56.1
65.1
23.0
19.8
3.6
3.2
15.7
16.2
1.7
1.5
Maruti
Accumulate
4,630
4,960
139,865
57,865
68,104
16.4
16.7
176.3
225.5
26.3
20.5
5.1
4.3
19.4
21.2
2.2
1.8
Minda Industries
Accumulate
740
809
1,174
2,567
2,965
8.0
8.3
46.1
57.8
16.1
12.8
2.7
2.2
16.7
17.3
0.6
0.5
Rane Brake Lining
Accumulate
321
366
254
454
511
11.1
11.4
23.8
28.1
13.5
11.4
1.9
1.7
14.2
15.3
0.7
0.6
Setco Automotive
Neutral
200
-
535
594
741
12.7
13.7
8.4
15.8
23.9
12.7
2.5
2.1
10.4
16.9
1.3
1.1
Tata Motors
Neutral
407
-
117,596
255,254
301,772
12.9
13.4
23.7
37.3
17.2
10.9
2.1
1.8
7.4
12.1
0.6
0.6
TVS Motor
Accumulate
294
313
13,975
11,845
14,040
7.2
9.0
10.4
17.4
28.3
16.9
7.1
5.4
25.1
32.0
1.2
1.0
Amara Raja Batteries
Buy
901
1,040
15,389
4,892
5,871
17.4
17.6
28.8
37.1
31.3
24.3
7.3
5.8
23.4
24.1
3.1
2.5
Exide Industries
Accumulate
147
162
12,491
6,950
7,784
14.4
14.8
6.6
7.3
22.3
20.1
2.8
2.6
12.6
12.8
1.5
1.4
Apollo Tyres
Accumulate
162
171
8,244
12,146
12,689
16.8
16.0
21.2
19.0
7.6
8.5
1.3
1.1
16.5
13.0
0.8
0.8
Ceat
Accumulate
1,054
1,119
4,264
6,041
6,597
14.1
13.7
99.5
111.9
10.6
9.4
2.1
1.7
19.6
18.5
0.9
0.7
JK Tyres
Neutral
100
-
2,260
7,446
7,669
15.2
14.0
19.6
18.4
5.1
5.4
1.3
1.1
25.2
19.5
0.7
0.6
Swaraj Engines
Neutral
939
-
1,166
552
630
14.2
14.7
44.6
54.1
21.1
17.4
4.9
4.5
23.2
25.6
2.0
1.7
Subros
Neutral
85
-
507
1,268
1,488
11.6
11.9
3.7
6.6
22.9
12.8
1.5
1.4
6.8
11.4
0.7
0.6
Indag Rubber
Neutral
206
-
539
283
329
17.0
17.2
13.0
15.4
15.9
13.3
3.5
2.9
21.8
21.6
1.6
1.3
Capital Goods
ACE
Neutral
44
-
432
660
839
4.7
8.2
1.0
3.9
43.7
11.2
1.4
1.2
3.2
11.3
0.8
0.6
BEML
Neutral
1,089
-
4,534
3,277
4,006
6.0
8.9
29.2
64.3
37.3
16.9
2.1
1.9
5.7
11.7
1.5
1.2
BGR Energy
Neutral
113
-
815
3,615
3,181
9.5
9.4
16.7
12.4
6.8
9.1
0.6
0.6
10.0
7.0
0.6
0.8
BHEL
Neutral
179
-
43,775
33,722
35,272
10.8
11.7
10.5
14.2
17.0
12.6
1.3
1.2
7.0
9.0
1.4
1.3
Blue Star
Accumulate
351
382
3,154
3,624
4,157
5.3
6.0
9.6
14.5
36.4
24.2
6.6
5.7
18.6
25.4
1.0
0.8
Crompton Greaves
Buy
173
204
10,868
13,484
14,687
4.9
6.2
4.5
7.1
38.5
24.4
2.7
2.5
7.2
10.8
0.9
0.9
Inox Wind
Buy
365
505
8,096
4,980
5,943
17.0
17.5
26.6
31.6
13.7
11.5
4.1
3.0
35.0
30.0
1.8
1.4
Stock Watch
November 18, 2015
Company Name
Reco
CMP
Target
Mkt Cap
Sales ( Čcr )
OPM(%)
EPS (Č)
PER(x)
P/BV(x)
RoE(%)
EV/Sales(x)
(Č)
Price ( Č)
( Č cr )
FY16E
FY17E
FY16E
FY17E
FY16E
FY17E
FY16E
FY17E
FY16E
FY17E
FY16E
FY17E
FY16E
FY17E
Capital Goods
KEC International
Neutral
151
-
3,876
8,791
9,716
6.1
6.8
5.4
8.2
27.9
18.4
2.8
2.6
10.0
14.0
0.7
0.6
Thermax
Neutral
850
-
10,126
6,413
7,525
7.4
8.5
30.5
39.3
27.9
21.6
4.3
3.7
15.0
17.0
1.6
1.3
Cement
ACC
Buy
1,327
1,630
24,905
13,151
14,757
16.4
18.3
63.9
83.4
20.8
15.9
2.7
2.5
13.3
16.1
1.7
1.5
Ambuja Cements
Buy
199
233
30,891
11,564
12,556
19.4
20.7
8.9
10.1
22.4
19.7
2.8
2.7
12.8
13.8
2.3
2.1
India Cements
Buy
82
112
2,510
4,216
4,840
18.0
19.5
4.0
9.9
20.4
8.3
0.8
0.8
4.0
9.5
0.9
0.7
JK Cement
Buy
645
744
4,510
3,661
4,742
10.1
15.8
18.0
61.0
35.8
10.6
2.6
2.3
7.5
22.9
1.7
1.3
J K Lakshmi Cement
Buy
348
430
4,093
2,947
3,616
16.7
19.9
11.5
27.2
30.3
12.8
2.9
2.5
9.8
20.8
1.8
1.4
Mangalam Cements
Neutral
199
-
531
1,053
1,347
10.5
13.3
8.4
26.0
23.7
7.7
1.0
0.9
4.3
12.5
0.9
0.7
Orient Cement
Accumulate
166
183
3,391
1,854
2,524
21.2
22.2
7.7
11.1
21.5
14.9
3.1
2.7
13.3
15.7
2.6
1.8
Ramco Cements
Neutral
374
-
8,904
4,036
4,545
20.8
21.3
15.1
18.8
24.8
19.9
3.0
2.7
12.9
14.3
2.7
2.3
Shree Cement^
Neutral
10,826
-
37,714
7,150
8,742
26.7
28.6
228.0
345.5
47.5
31.3
7.0
5.9
15.7
20.3
5.0
4.0
UltraTech Cement
Buy
2,740
3,282
75,180
25,021
30,023
19.1
21.6
89.0
132.0
30.8
20.8
3.6
3.1
12.2
15.9
3.1
2.6
Construction
ITNL
Neutral
92
-
3,025
7,360
8,825
34.0
35.9
1.0
5.0
92.0
18.4
0.4
0.4
0.3
1.4
3.8
3.7
KNR Constructions
Accumulate
592
673
1,665
937
1,470
14.3
14.0
33.5
38.6
17.7
15.3
2.7
2.3
15.4
15.4
1.9
1.2
Larsen & Toubro
Buy
1,354
1,646
125,970
64,148
73,241
11.5
11.7
62.0
66.0
21.8
20.5
2.2
2.0
13.4
14.0
2.2
1.9
Gujarat Pipavav Port
Neutral
164
-
7,924
629
684
51.0
52.2
6.4
5.9
25.6
27.8
3.4
3.1
15.9
12.7
12.3
11.1
MBL Infrastructures
Buy
208
285
862
2,313
2,797
12.2
14.6
19.0
20.0
11.0
10.4
1.1
1.1
11.3
10.6
1.1
1.0
Nagarjuna Const.
Neutral
79
-
4,372
7,892
8,842
8.3
9.1
2.4
5.3
32.8
14.8
1.3
1.2
4.2
8.6
0.8
0.7
PNC Infratech
Neutral
529
-
2,715
1,798
2,132
13.2
13.5
22.0
30.0
24.1
17.6
2.2
2.0
11.5
11.4
1.6
1.4
Simplex Infra
Neutral
319
-
1,578
6,241
7,008
10.4
10.7
20.0
36.0
16.0
8.9
1.3
1.2
6.8
11.1
0.8
0.6
Financials
Allahabad Bank
Neutral
76
-
4,555
8,332
9,259
2.8
2.8
21.0
25.6
3.6
3.0
0.4
0.3
9.8
10.9
-
-
Axis Bank
Buy
475
630
113,008
26,473
31,527
3.5
3.6
35.7
43.5
13.3
10.9
2.6
2.2
17.9
18.9
-
-
Bank of Baroda
Neutral
173
-
39,908
19,105
21,474
2.0
2.0
19.1
24.8
9.1
7.0
0.9
0.8
10.2
12.1
-
-
Bank of India
Neutral
132
-
10,441
15,972
17,271
1.9
2.0
15.3
33.4
8.6
4.0
0.4
0.3
3.6
7.6
-
-
Canara Bank
Neutral
276
-
15,008
15,251
16,725
2.0
2.0
59.3
68.6
4.7
4.0
0.5
0.4
10.1
10.7
-
-
Dena Bank
Neutral
41
-
2,320
3,440
3,840
2.1
2.3
7.3
10.0
5.7
4.1
0.4
0.4
6.1
7.9
-
-
Federal Bank
Neutral
57
-
9,749
3,477
3,999
3.0
3.0
5.0
6.2
11.3
9.1
1.1
1.0
10.6
11.9
-
-
HDFC
Neutral
1,200
-
189,369
10,358
11,852
3.3
3.3
41.1
47.0
29.2
25.5
5.6
5.1
24.7
24.9
-
-
HDFC Bank
Buy
1,061
1,262
267,130
38,309
47,302
4.3
4.3
49.3
61.1
21.5
17.4
3.7
3.2
18.5
19.7
-
-
Stock Watch
November 18, 2015
Company Name
Reco
CMP
Target
Mkt Cap
Sales ( Čcr )
OPM(%)
EPS (Č)
PER(x)
P/BV(x)
RoE(%)
EV/Sales(x)
(Č)
Price ( Č)
( Č cr )
FY16E
FY17E
FY16E
FY17E
FY16E
FY17E
FY16E
FY17E
FY16E
FY17E
FY16E
FY17E
FY16E
FY17E
Financials
ICICI Bank
Buy
267
357
155,268
35,168
40,517
3.4
3.4
21.4
25.2
12.5
10.6
2.1
1.8
14.7
15.2
-
-
IDBI Bank
Neutral
87
-
13,890
9,625
10,455
1.8
1.8
8.5
14.2
10.2
6.1
0.6
0.6
5.9
9.3
-
-
Indian Bank
Neutral
127
-
6,076
6,160
6,858
2.5
2.5
24.5
29.8
5.2
4.2
0.4
0.4
7.7
8.6
-
-
LIC Housing Finance
Buy
466
571
23,497
3,101
3,745
2.5
2.5
33.0
40.2
14.1
11.6
2.6
2.2
19.7
20.5
-
-
Oriental Bank
Neutral
151
-
4,528
7,643
8,373
2.4
2.4
37.2
45.4
4.1
3.3
0.4
0.3
8.2
9.4
-
-
Punjab Natl.Bank
Neutral
141
-
27,687
23,638
26,557
2.8
2.8
17.9
27.2
7.9
5.2
0.8
0.7
8.5
12.0
-
-
South Ind.Bank
Neutral
21
-
2,768
1,965
2,185
2.5
2.5
2.5
3.3
8.2
6.2
0.8
0.7
9.5
11.7
-
-
St Bk of India
Accumulate
248
283
192,517
82,520
93,299
2.7
2.8
20.0
24.5
12.4
10.1
1.4
1.2
11.5
12.8
-
-
Union Bank
Neutral
165
-
11,332
12,646
14,129
2.3
2.4
31.0
39.1
5.3
4.2
0.6
0.5
9.8
11.4
-
-
Vijaya Bank
Neutral
34
-
2,934
3,536
3,827
1.9
1.9
5.5
6.7
6.2
5.1
0.5
0.5
7.8
8.8
-
-
Yes Bank
Buy
745
914
31,207
7,228
9,043
3.2
3.3
57.7
69.4
12.9
10.7
2.3
2.0
19.1
19.6
-
-
FMCG
Asian Paints
Neutral
807
-
77,407
16,553
19,160
16.0
16.2
17.7
21.5
45.7
37.5
12.1
10.9
29.4
31.2
4.5
3.9
Britannia
Neutral
2,881
-
34,567
8,065
9,395
9.6
10.2
47.2
65.5
61.0
44.0
20.3
19.2
38.3
41.2
4.1
3.5
Colgate
Neutral
945
-
25,714
4,836
5,490
19.5
19.7
48.5
53.2
19.5
17.8
14.3
12.4
99.8
97.5
5.2
4.6
Dabur India
Neutral
265
-
46,494
9,370
10,265
17.1
17.2
7.3
8.1
36.1
32.7
10.9
8.9
33.7
30.6
4.9
4.4
GlaxoSmith Con*
Neutral
5,873
-
24,698
4,919
5,742
17.2
17.4
168.3
191.2
34.9
30.7
9.9
8.4
28.8
28.9
4.6
3.9
Godrej Consumer
Neutral
1,219
-
41,518
10,168
12,886
16.1
16.1
32.1
38.4
38.0
31.8
7.7
7.1
19.7
21.0
4.2
3.3
HUL
Neutral
797
-
172,482
34,940
38,957
17.5
17.7
20.8
24.7
38.3
32.3
42.6
34.1
110.5
114.2
4.7
4.2
ITC
Buy
348
409
279,442
41,068
45,068
37.8
37.4
13.9
15.9
25.0
21.9
8.4
7.4
34.1
33.8
6.4
5.8
Marico
Neutral
402
-
25,900
6,551
7,766
15.7
16.0
10.4
12.5
38.7
32.1
11.2
9.3
33.2
32.4
3.9
3.3
Nestle*
Accumulate
6,075
6,646
58,568
11,291
12,847
22.2
22.3
158.9
184.6
38.2
32.9
20.0
18.0
55.0
57.3
5.0
4.4
Tata Global
Accumulate
132
144
8,334
8,635
9,072
9.8
9.9
6.5
7.6
20.3
17.4
2.0
1.9
6.8
7.4
0.9
0.9
IT
HCL Tech^
Buy
854
1,132
120,041
42,038
47,503
23.2
23.5
55.8
62.9
15.3
13.6
3.5
2.7
23.0
19.8
2.5
2.0
Infosys
Buy
1,061
1,306
243,729
60,250
66,999
28.0
28.0
58.3
63.7
18.2
16.7
3.8
3.3
20.9
19.7
3.4
2.9
TCS
Buy
2,391
3,165
471,031
111,274
126,852
28.4
28.7
125.4
143.9
19.1
16.6
7.5
7.0
39.9
42.2
3.8
3.3
Tech Mahindra
Buy
522
646
50,237
25,566
28,890
16.0
17.0
26.3
31.9
19.9
16.4
3.6
3.0
17.9
18.6
1.7
1.5
Wipro
Buy
556
719
137,215
52,414
58,704
23.7
23.8
38.4
42.3
14.5
13.1
2.8
2.5
19.5
18.0
2.2
1.8
Media
D B Corp
Accumulate
321
356
5,904
2,241
2,495
27.8
27.9
21.8
25.6
14.8
12.6
3.9
3.4
26.7
28.5
2.6
2.3
HT Media
Neutral
77
-
1,794
2,495
2,603
11.2
11.2
7.3
8.6
10.6
9.0
0.8
0.8
7.4
8.1
0.2
0.2
Stock Watch
November 18, 2015
Company Name
Reco
CMP
Target
Mkt Cap
Sales ( Čcr )
OPM(%)
EPS (Č)
PER(x)
P/BV(x)
RoE(%)
EV/Sales(x)
(Č)
Price ( Č)
( Č cr )
FY16E FY17E
FY16E
FY17E
FY16E
FY17E
FY16E
FY17E
FY16E
FY17E
FY16E
FY17E
FY16E
FY17E
Media
Jagran Prakashan
Accumulate
148
169
4,843
2,170
2,355
27.0
27.6
12.8
10.3
11.5
14.4
3.2
3.0
21.8
19.4
2.0
1.7
Sun TV Network
Neutral
383
-
15,109
2,779
3,196
70.2
70.5
22.8
27.3
16.8
14.0
4.1
3.8
26.7
28.3
5.2
4.5
Hindustan Media
Neutral
272
-
1,993
920
1,031
20.0
20.0
19.2
20.9
14.1
13.0
2.3
2.0
16.4
15.3
1.7
1.5
Ventures
Metals & Mining
Coal India
Accumulate
332
380
209,830
76,167
84,130
19.9
22.3
22.4
25.8
14.8
12.9
5.3
5.2
35.5
41.0
2.1
1.9
Hind. Zinc
Buy
148
175
62,323
14,641
14,026
50.4
50.4
17.7
16.0
8.4
9.2
1.3
1.2
16.2
13.2
1.9
1.7
Hindalco
Neutral
81
-
16,685
104,356
111,186
8.7
9.5
6.7
11.1
12.0
7.3
0.4
0.4
3.5
5.9
0.7
0.6
JSW Steel
Neutral
896
-
21,651
42,308
45,147
16.4
20.7
(10.3)
49.5
18.1
1.0
1.0
(1.0)
5.6
1.6
1.5
NMDC
Neutral
93
-
37,030
8,237
10,893
46.6
44.5
10.0
11.7
9.4
8.0
1.0
0.9
12.5
13.0
4.3
3.3
SAIL
Neutral
45
-
18,771
45,915
53,954
7.2
10.5
1.5
4.4
30.2
10.4
0.4
0.4
2.3
4.1
1.1
0.9
Vedanta
Neutral
92
-
27,290
71,445
81,910
26.2
26.3
12.9
19.2
7.2
4.8
0.5
0.4
7.2
8.9
0.8
0.6
Tata Steel
Neutral
235
-
22,775
126,760
137,307
8.9
11.3
6.4
23.1
36.9
10.2
0.7
0.7
2.0
7.1
0.8
0.7
Oil & Gas
Cairn India
Neutral
135
-
25,376
11,323
12,490
49.4
51.0
20.7
20.7
6.5
6.6
0.4
0.4
6.4
6.1
1.3
0.7
GAIL
Neutral
307
-
38,885
64,856
70,933
9.1
9.6
24.0
28.9
12.8
10.6
1.1
1.0
8.8
9.6
0.8
0.7
ONGC
Neutral
232
-
198,830
154,564
167,321
36.8
37.4
28.6
32.5
8.1
7.2
1.0
1.0
12.7
13.5
1.5
1.4
Petronet LNG
Neutral
208
-
15,593
29,691
31,188
5.8
6.2
12.8
13.4
16.3
15.5
2.4
2.2
15.8
14.8
0.6
0.6
Indian Oil Corp
Accumulate
400
455
97,009
359,607
402,760
5.9
6.1
42.5
48.7
9.4
8.2
1.3
1.1
14.1
14.4
0.4
0.3
Reliance Industries
Accumulate
928
1,050
300,364
304,775
344,392
12.6
13.4
91.3
102.6
10.2
9.0
1.1
1.0
11.8
12.0
0.9
0.8
Pharmaceuticals
Alembic Pharma
Neutral
662
-
12,478
2,658
3,112
24.1
20.2
24.6
23.9
26.9
27.7
9.7
7.4
42.5
30.2
4.7
3.9
Aurobindo Pharma
Neutral
831
-
48,536
14,923
17,162
23.0
23.0
38.2
43.6
21.8
19.1
6.7
5.0
36.0
30.2
3.6
3.1
Aventis*
Neutral
4,517
-
10,402
2,082
2,371
17.4
20.8
118.2
151.5
38.2
29.8
5.6
4.5
19.9
25.5
4.7
3.9
Cadila Healthcare
Neutral
413
-
42,270
10,224
11,840
21.0
22.0
14.6
17.6
28.3
23.5
7.8
6.1
30.8
29.0
4.2
3.5
Cipla
Neutral
634
-
50,917
14,211
16,611
20.6
19.0
27.0
28.9
23.5
21.9
4.0
3.4
18.4
16.8
3.6
3.0
Dr Reddy's
Accumulate
3,440
3,933
58,658
16,838
19,575
25.0
23.1
167.5
178.8
20.5
19.2
4.3
3.6
23.1
20.4
3.4
2.9
Dishman Pharma
Neutral
325
-
2,623
1,716
1,888
20.2
20.2
16.3
21.6
19.9
15.1
1.9
1.7
9.7
11.7
1.7
1.4
GSK Pharma*
Neutral
3,114
-
26,380
2,870
3,158
20.0
22.1
59.5
68.3
52.3
45.6
15.4
15.9
28.5
34.3
8.7
8.0
Indoco Remedies
Neutral
309
-
2,847
1,033
1,199
15.9
18.2
9.4
13.6
32.9
22.7
4.9
4.1
15.7
19.7
2.8
2.5
Ipca labs
Buy
743
900
9,378
3,363
3,909
12.9
18.6
13.4
28.0
55.5
26.5
7.2
5.8
7.4
14.0
3.1
2.6
Lupin
Neutral
1,798
-
80,956
13,092
16,561
25.0
27.0
50.4
68.3
35.7
26.3
7.4
5.8
22.8
24.7
5.9
4.5
Sun Pharma
Buy
753
950
181,289
28,163
32,610
25.8
30.7
17.4
26.9
43.3
28.0
4.1
3.6
13.0
16.6
5.9
4.9
Stock Watch
November 18, 2015
Company Name
Reco
CMP
Target
Mkt Cap
Sales ( Čcr )
OPM(%)
EPS (Č)
PER(x)
P/BV(x)
RoE(%)
EV/Sales(x)
(Č)
Price ( Č)
( Č cr )
FY16E FY17E
FY16E
FY17E
FY16E
FY17E
FY16E
FY17E
FY16E
FY17E
FY16E
FY17E
FY16E
FY17E
Power
Tata Power
Neutral
67
-
18,229
35,923
37,402
22.6
22.8
4.1
5.2
16.6
13.1
1.3
1.2
7.5
9.3
1.5
1.3
NTPC
Buy
132
157
109,005
87,064
98,846
23.5
23.5
11.7
13.2
11.3
10.0
1.3
1.2
11.4
12.1
2.3
2.0
Power Grid
Buy
131
170
68,429
20,702
23,361
86.7
86.4
12.1
13.2
10.8
9.9
1.6
1.4
15.6
15.1
8.2
7.7
Telecom
Bharti Airtel
Neutral
335
-
133,773
101,748
109,191
32.1
31.7
12.0
12.5
27.9
26.8
1.9
1.8
6.9
6.7
2.0
1.8
Idea Cellular
Neutral
131
-
47,173
34,282
36,941
32.0
31.5
5.9
6.2
22.2
21.1
2.0
1.9
9.9
9.3
2.0
1.8
zOthers
Abbott India
Neutral
5,043
-
10,715
2,715
3,153
14.5
14.1
134.3
152.2
37.6
33.1
9.4
7.7
27.4
25.6
3.7
3.1
Bajaj Electricals
Buy
232
341
2,339
4,719
5,287
5.2
5.8
8.6
12.7
27.1
18.3
3.1
2.7
11.4
14.8
0.5
0.4
Finolex Cables
Neutral
263
-
4,025
2,520
2,883
12.2
12.0
12.7
14.2
20.8
18.5
2.8
2.5
13.6
13.5
1.3
1.1
Goodyear India*
Accumulate
566
622
1,306
1,888
1,680
12.1
11.9
62.2
56.6
9.1
10.0
2.1
1.8
25.9
19.7
0.5
0.5
Hitachi
Neutral
1,351
-
3,673
1,779
2,081
7.8
8.8
21.8
33.4
62.0
40.4
10.0
8.1
17.4
22.1
2.1
1.8
Jyothy Laboratories
Neutral
300
-
5,430
1,620
1,847
11.5
11.5
7.3
8.5
41.1
35.4
5.3
4.9
13.3
14.4
3.2
2.7
MRF
Buy
39,526
45,575
16,764
20,316
14,488
21.4
21.1
5,488.0
3,798.0
7.2
10.4
2.5
2.0
41.1
21.2
0.8
1.0
Page Industries
Neutral
12,379
-
13,807
1,929
2,450
19.8
20.1
229.9
299.0
53.9
41.4
23.8
16.5
52.1
47.1
7.2
5.6
Relaxo Footwears
Neutral
483
-
5,792
1,767
2,152
12.3
12.5
19.3
25.1
25.1
19.3
6.2
4.7
27.7
27.8
3.3
2.7
Siyaram Silk Mills
Buy
937
1,145
878
1,636
1,815
11.5
11.5
89.9
104.1
10.4
9.0
1.7
1.5
17.9
17.8
0.7
0.6
Styrolution ABS India*
Neutral
725
-
1,275
1,271
1,440
8.6
9.2
32.0
41.1
22.6
17.7
2.3
2.1
10.7
12.4
1.0
0.8
Tree House
Buy
251
314
1,064
256
315
57.2
57.5
16.5
21.0
15.2
12.0
1.5
1.3
9.6
10.9
4.3
3.6
TVS Srichakra
Buy
2,738
3,240
2,097
2,101
2,338
15.7
15.0
248.6
270.0
11.0
10.1
4.8
3.5
43.6
34.0
1.0
0.9
HSIL
Accumulate
283
302
2,045
2,123
2,384
16.1
16.5
15.0
18.9
18.8
15.0
1.5
1.4
8.0
9.4
1.3
1.2
Kirloskar Engines India
Neutral
265
-
3,831
2,471
2,826
8.8
10.4
9.1
13.3
29.0
19.9
2.8
2.6
9.7
13.4
1.2
1.0
Ltd
M M Forgings
Buy
521
614
629
511
615
21.7
21.6
43.1
55.8
12.1
9.3
2.2
1.8
19.9
21.2
1.4
1.1
Banco Products (India)
Neutral
127
-
908
1,208
1,353
11.0
12.3
10.8
14.5
11.8
8.8
1.4
1.2
11.9
14.5
0.7
0.6
Competent Automobiles Neutral
142
-
87
1,040
1,137
3.2
3.1
25.7
28.0
5.5
5.1
0.8
0.7
15.0
14.3
0.1
0.1
Nilkamal
Neutral
1,015
-
1,515
1,910
2,083
10.5
10.3
63.3
69.2
16.0
14.7
2.6
2.3
17.6
16.5
0.9
0.7
Visaka Industries
Buy
119
166
189
1,158
1,272
8.6
9.5
23.7
32.7
5.0
3.6
0.5
0.5
10.1
12.5
0.3
0.3
Transport Corporation of
Neutral
298
-
2,268
2,830
3,350
8.8
9.0
14.4
18.3
20.8
16.3
3.2
2.8
15.4
17.1
0.9
0.8
India
Elecon Engineering
Accumulate
78
85
854
1,369
1,533
13.7
14.9
3.3
6.1
23.6
12.9
1.5
1.4
6.6
11.4
1.0
0.9
Surya Roshni
Buy
131
183
576
2,992
3,223
8.1
8.4
14.7
18.3
8.9
7.2
0.8
0.8
9.7
11.0
0.5
0.4
MT Educare
Buy
131
169
521
286
366
18.3
17.7
7.7
9.4
16.9
14.0
3.6
3.1
20.2
21.1
1.7
1.3
Stock Watch
November 18, 2015
Company Name
Reco
CMP
Target Mkt Cap
Sales ( Čcr )
OPM(%)
EPS (Č)
PER(x)
P/BV(x)
RoE(%)
EV/Sales(x)
(Č)
Price ( Č)
( Č cr )
FY16E FY17E FY16E FY17E FY16E FY17E FY16E FY17E FY16E FY17E FY16E FY17E FY16E FY17E
zOthers
Radico Khaitan
Buy
122
156
1,624
1,565
1,687
12.2
13.0
5.7
7.1
21.4
17.2
1.8
1.7
8.3
9.6
1.5
1.4
Garware Wall Ropes
Buy
345
423
756
861
967
10.9
10.9
24.0
28.2
14.4
12.2
2.1
1.8
14.6
14.9
0.9
0.8
Wonderla Holidays
Neutral
381
-
2,154
206
308
44.0
43.6
9.0
12.9
42.4
29.6
5.8
5.2
13.7
17.8
10.4
6.9
Linc Pen & Plastics
Accumulate
163
185
241
340
371
8.3
8.9
10.8
13.2
15.1
12.4
2.4
2.1
16.0
17.1
0.7
0.7
The Byke Hospitality
Accumulate
166
181
665
222
287
20.5
20.5
5.6
7.6
29.4
22.0
5.6
4.6
18.9
20.8
3.0
2.3
Source: Company, Angel Research; Note: *December year end; #September year end; &October year end; Price as on November 17, 2015
Market Outlook
November 18, 2015
Research Team Tel: 022 - 39357800
DISCLAIMER
Angel Broking Private Limited (hereinafter referred to as “Angel”) is a registered Member of National Stock Exchange of India Limited,
Bombay Stock Exchange Limited and Metropolitian Stock Exchange of India Limited. It is also registered as a Depository Participant with
CDSL and Portfolio Manager with SEBI. It also has registration with AMFI as a Mutual Fund Distributor. Angel Broking Private Limited is a
registered entity with SEBI for Research Analyst in terms of SEBI (Research Analyst) Regulations, 2014 vide registration number
INH000000164. Angel or its associates has not been debarred/ suspended by SEBI or any other regulatory authority for accessing
/dealing in securities Market. Angel or its associates including its relatives/analyst do not hold any financial interest/beneficial ownership
of more than 1% in the company covered by Analyst. Angel or its associates/analyst has not received any compensation / managed or co
-managed public offering of securities of the company covered by Analyst during the past twelve months. Angel/analyst has not served as
an officer, director or employee of company covered by Analyst and has not been engaged in market making activity of the company
covered by Analyst.
This document is solely for the personal information of the recipient, and must not be singularly used as the basis of any investment
decision. Nothing in this document should be construed as investment or financial advice. Each recipient of this document should make
such investigations as they deem necessary to arrive at an independent evaluation of an investment in the securities of the companies
referred to in this document (including the merits and risks involved), and should consult their own advisors to determine the merits and
risks of such an investment.
Reports based on technical and derivative analysis center on studying charts of a stock's price movement, outstanding positions and
trading volume, as opposed to focusing on a company's fundamentals and, as such, may not match with a report on a company's
fundamentals.
The information in this document has been printed on the basis of publicly available information, internal data and other reliable sources
believed to be true, but we do not represent that it is accurate or complete and it should not be relied on as such, as this document is for
general guidance only. Angel Broking Pvt. Limited or any of its affiliates/ group companies shall not be in any way responsible for any
loss or damage that may arise to any person from any inadvertent error in the information contained in this report. Angel Broking Pvt.
Limited has not independently verified all the information contained within this document. Accordingly, we cannot testify, nor make any
representation or warranty, express or implied, to the accuracy, contents or data contained within this document. While Angel Broking
Pvt. Limited endeavors to update on a reasonable basis the information discussed in this material, there may be regulatory, compliance,
or other reasons that prevent us from doing so.
This document is being supplied to you solely for your information, and its contents, information or data may not be reproduced,
redistributed or passed on, directly or indirectly.
Neither Angel Broking Pvt. Limited, nor its directors, employees or affiliates shall be liable for any loss or damage that may arise from or
in connection with the use of this information.
Note: Please refer to the important ‘Stock Holding Disclosure' report on the Angel website (Research Section). Also, please refer to the
latest update on respective stocks for the disclosure status in respect of those stocks. Angel Broking Pvt. Limited and its affiliates may have
investment positions in the stocks recommended in this report.