Market Outlook
August 18, 2015
Dealer’s Diary
Domestic Indices
Chg (%)
(Pts)
(Close)
BSE Sensex
(0.7)
(189)
27,878
Indian markets are expected to open positively tracking the SGX Nifty and some of
its Asian peers.
Nifty
(0.5)
(41)
8,477
MID CAP
0.3
35
11,488
US markets closed higher as the Chinese currency steadied and home builders index
SMALL CAP
0.2
25
11,792
for August beat expectations.
BSE HC
(0.3)
(58)
18,000
BSE PSU
1.1
82
7,497
European stocks ended a choppy session in mixed territory after a duo of US data
sent conflicting signals about the strength of the country’s economy.
BANKEX
0.5
109
21,598
AUTO
(0.6)
(124)
19,338
Indian markets ended in the red as the investors continue to watch the progress of
METAL
1.3
102
7,908
the monsoon. As per the IMD’s latest report, the rainfall in the country weakened
OIL & GAS
(1.0)
(92)
9,415
further during last week, with the cumulative rainfall upto 16th August 2015 being
BSE IT
(0.3)
(38)
11,584
10% below Long Period Average.
Global Indices
Chg (%)
(Pts)
(Close)
News & Result Analysis
Dow Jones
0.4
68
17,545
Mahindra & Mahindra to launch compact SUV “TUV300” in September 2015
NASDAQ
0.9
43
5,092
Refer detailed news & result analysis on the following page
FTSE
(0.0)
(0)
6,550
Markets Today
Nikkei
0.5
101
20,620
The trend deciding level for the day is 27,904 / 8,479 levels. If NIFTY trades above
Hang Sang
(0.7)
(176)
23,815
this level during the first half-an-hour of trade then we may witness a further rally up
Straits Times
(1.5)
(47)
3,067
to 28,070 - 28,261 / 8,529 - 8,581 levels. However, if NIFTY trades below
Shanghai Com
0.7
28
3,994
27,904 / 8,479 levels for the first half-an-hour of trade then it may correct towards
27,713 - 27,548 / 8,427 - 8,376 levels.
Indian ADR
Chg (%)
(Pts)
(Close)
Indices
S2
S1
PIVOT
R1
R2
INFY
(0.4)
(0.1)
$17.9
SENSEX
27,548
27,713
27,904
28,070
28,261
WIT
(0.4)
(0.1)
$12.5
NIFTY
8,376
8,427
8,479
8,529
8,581
IBN
0.4
0.0
$9.8
HDB
(0.1)
(0.1)
$62.9
Net Inflows (August 14, 2015)
` cr
Purch
Sales
Net
MTD
YTD
Advances / Declines
BSE
NSE
FII
4,445
3,984
461
(489)
140,481
Advances
1,438
772
MFs
919
708
211
732
58,681
Declines
1,437
750
Unchanged
117
57
FII Derivatives (August 17, 2015)
` cr
Purch
Sales
Net
Open Interest
Volumes (` cr)
Index Futures
1,405
2,006
(601)
14,411
BSE
2,929
Stock Futures
2,629
2,666
(37)
52,641
NSE
15,964
Gainers / Losers
Gainer
Loser
Company
Price (`)
chg (%)
Company
Price (`)
chg (%)
BANKBARODA
212
15.2
KSCL
500
(17.0)
CANBK
347
13.4
PUNJLLOYD
28
(12.2)
SREINFRA
45
9.3
AMTEKAUTO
133
(10.8)
INDIANB
162
9.0
JETAIRWAYS
380
(5.2)
BANKINDIA
185
8.7
UNITECH
7
(5.0)
Market Outlook
August 18, 2015
Mahindra & Mahindra to launch compact SUV “TUV300” in
September2015
Utility vehicle major Mahindra & Mahindra will launch its new compact SUV
named “TUV300” on September 10, 2015. M&M will position the “TUV300” as a
"a true blue SUV" and is expected to compete with the likes of Toyota Etios Cross,
Hyundai 120 Active and Fiat Avventura which are priced at a range of Rs 6.23
lakh and Rs 8.89 lakh (ex-showroom Delhi). The company is targeting to address
needs of those customers who are looking for a pure SUV in the compact segment,
which at present is dominated by crossover models. As per the company, the
design of the Mahindra TUV300 has been inspired by a battle tank with raised
shoulders, high front nose, flat roof, high ground clearance and straight bonnet.
The TUV300 is an all-new SUV platform designed and developed in-house by the
Mahindra team. The vehicle will be manufactured at the company's manufacturing
facility at Chakan, where it also produces trucks and other vehicles of Maxximo
platform.
M&M lost market share in the utility vehicle space on lack of new products
particularly in the compact utility space. We believe with the launch of “TUV 300”,
M&M is well poised to regain market share. We have an Accumulate rating on the
stock.
Economic and Political News
India's fuel demand rose 5.52% in July
CBDT to clarify bank a/c disclosure norms under black money law
Monsoon deficit widens to 10%
Corporate News
Vedanta to issue `2,000-crore NCDs to refinance debt
Goldman Sachs to invest $150 mn in Piramal Realty
Apex consumer court accepts case against Maggi
Market Outlook
August 18, 2015
Top Picks
Large Cap
Market
CMP
Target
Upside
Company
Sector
Rating
Cap (` Cr)
(`)
(`)
(%)
Axis Bank
Financials
133,435
Buy
562
716
27.5
ICICI Bank
Financials
175,863
Buy
303
370
22.1
Inox Wind
Capital Goods
8,784
Buy
396
505
27.6
LIC Housing Fin. Financials
25,263
Buy
501
590
17.9
Power Grid
Power
72,144
Buy
138
170
23.3
TCS
IT
525,869
Buy
2,685
3,168
18.0
Tech Mahindra IT
53,148
Buy
553
646
16.9
Yes Bank
Financials
33,056
Buy
791
989
25.1
Infosys
IT
262,277 Accumulate
1,142
1,306
14.4
Source: Angel Research, Bloomberg
Mid Cap
Market
CMP
Target
Upside
Company
Sector
Rating
Cap (` Cr)
(`)
(`)
(%)
Bajaj Electricals
Others
2,674
Buy
265
341
28.6
Garware Wall Ropes Others
734
Buy
336
390
16.2
Hindustan Media
Media
1,728
Buy
236
292
24.0
JK Tyre
Auto Ancillary
2,479
Buy
109
147
34.5
MBL Infrastructures Construction
1,085
Buy
262
395
50.7
Radico Khaitan
Others
1,253
Buy
94
112
19.0
Surya Roshni
Others
608
Buy
139
183
31.9
Minda Industries
Auto Ancillary
933 Accumulate
588
652
10.8
MT Educare
Others
514 Accumulate
129
141
9.1
Source: Angel Research, Bloomberg
Market Outlook
August 18, 2015
Global economic events release calendar
Date
Time
Country Event Description
Unit
Period
Bloomberg Data
Last Reported Estimated
August 18, 2015
6:00PM
US
Building permits
Thousands
Jul
1,337.00
1,230.00
6:00PM
US
Housing Starts
Thousands
Jul
1,174.00
1,186.00
2:00PM
UK
CPI (YoY)
% Change
Jul
--
August 19, 2015
6:00PM
US
Consumer price index (mom)
% Change
Jul
0.30
0.20
August 20, 2015
6:00PM
US
Initial Jobless claims
Thousands
Aug 15
274.00
272.00
7:30PM
US
Existing home sales
Million
Jul
5.49
5.43
August 21, 2015
7:30PM
Euro Zone Euro-Zone Consumer Confidence
Value
Aug A
(7.10)
(6.90)
1:00PM
Germany PMI Services
Value
Aug P
53.80
53.60
1:00PM
Germany PMI Manufacturing
Value
Aug P
51.80
51.60
August 25, 2015
11:30AM
Germany GDP nsa (YoY)
% Change
2Q F
1.60
--
7:30PM
US
New home sales
Thousands
Jul
482.00
510.00
7:30PM
US
Consumer Confidence
S.A./ 1985=100
Aug
90.91
93.00
August 27, 2015
6:00PM
US
GDP Qoq (Annualised)
% Change
2Q S
2.30
3.40
August 28, 2015
2:00PM
UK
GDP (YoY)
% Change
2Q P
2.60
--
September 1, 2015
1:25PM
Germany Unemployment change (000's)
Thousands
Aug
9.00
--
6:30AM
China
PMI Manufacturing
Value
Aug
50.00
--
2:00PM
UK
PMI Manufacturing
Value
Aug
51.90
--
September 3, 2015
5:15PM
Euro Zone ECB announces interest rates
%
Sep 3
0.05
--
September 4, 2015
2:30PM
Euro Zone Euro-Zone GDP s.a. (QoQ)
% Change
2Q P
0.30
--
6:00PM
US
Change in Nonfarm payrolls
Thousands
Aug
215.00
--
6:00PM
US
Unnemployment rate
%
Aug
5.30
--
September 8, 2015
China
Exports YoY%
% Change
Aug
(8.30)
--
September 9, 2015
7:00AM
China
Consumer Price Index (YoY)
% Change
Aug
1.60
--
2:00PM
UK
Industrial Production (YoY)
% Change
Jul
1.50
--
Source: Bloomberg, Angel Research
Market Outlook
August 18, 2015
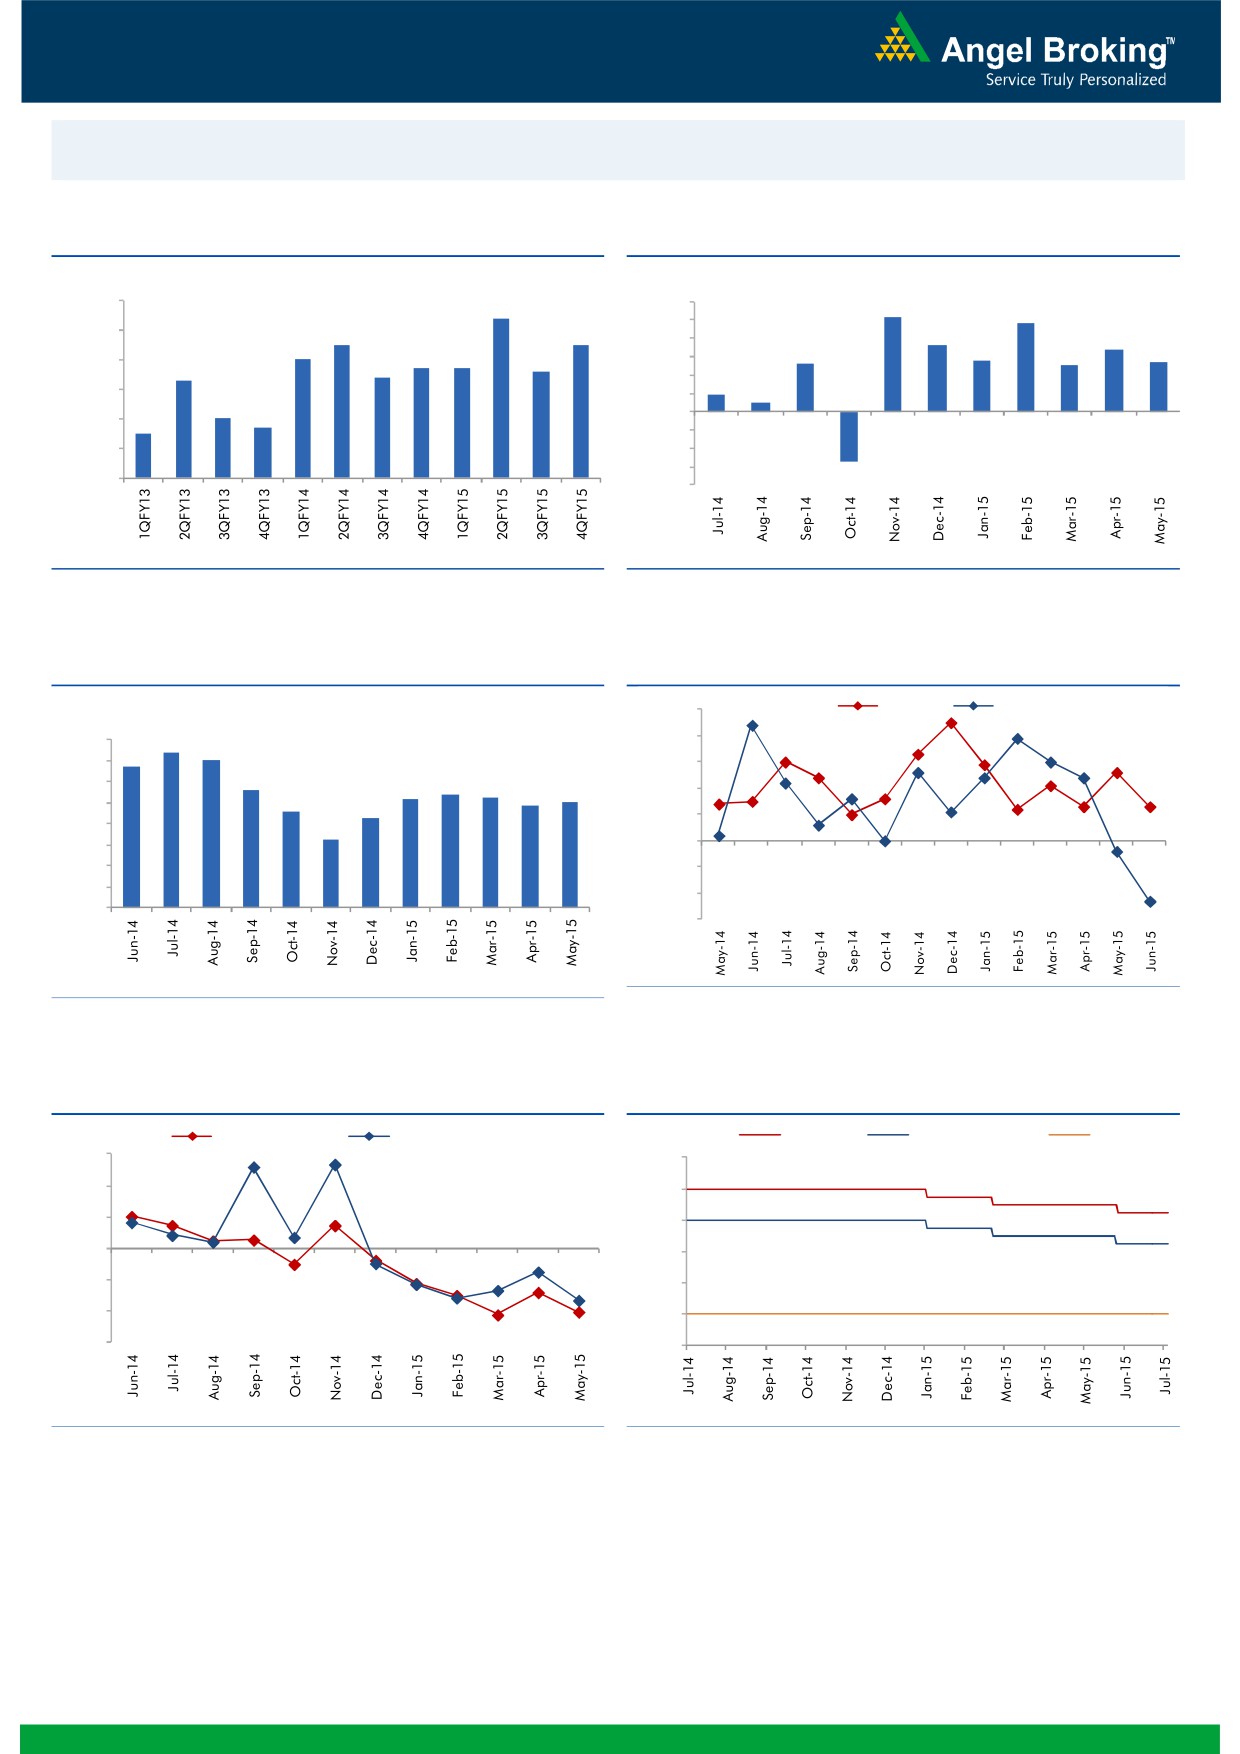
Macro watch
Exhibit 1: Quarterly GDP trends
Exhibit 2: IIP trends
(%)
(%)
9.0
8.4
6.0
5.2
4.8
5.0
8.0
7.5
7.5
3.6
4.0
3.4
7.0
2.8
2.7
6.7
6.7
6.6
2.6
2.5
7.0
6.3
6.4
3.0
2.0
0.9
6.0
0.5
1.0
5.0
4.7
-
5.0
4.5
(1.0)
4.0
(2.0)
(3.0)
3.0
(2.7)
(4.0)
Source: CSO, Angel Research
Source: MOSPI, Angel Research
Exhibit 3: Monthly CPI inflation trends
Exhibit 4: Manufacturing and services PMI
(%)
55.0
Mfg. PMI
Services PMI
8.0
7.4
54.0
7.0
6.8
7.0
53.0
5.6
5.2
5.4
5.3
6.0
4.9
5.0
52.0
4.6
5.0
4.3
51.0
4.0
3.3
3.0
50.0
2.0
49.0
1.0
48.0
-
47.0
Source: Market, Angel Research; Note: Level above 50 indicates expansion
Source: MOSPI, Angel Research
Exhibit 5: Exports and imports growth trends
Exhibit 6: Key policy rates
(%)
Exports yoy growth
Imports yoy growth
(%)
Repo rate
Reverse Repo rate
CRR
30.0
9.00
20.0
8.00
10.0
7.00
0.0
6.00
(10.0)
5.00
(20.0)
4.00
(30.0)
3.00
Source: Bloomberg, Angel Research
Source: RBI, Angel Research
Market Outlook
August 18, 2015
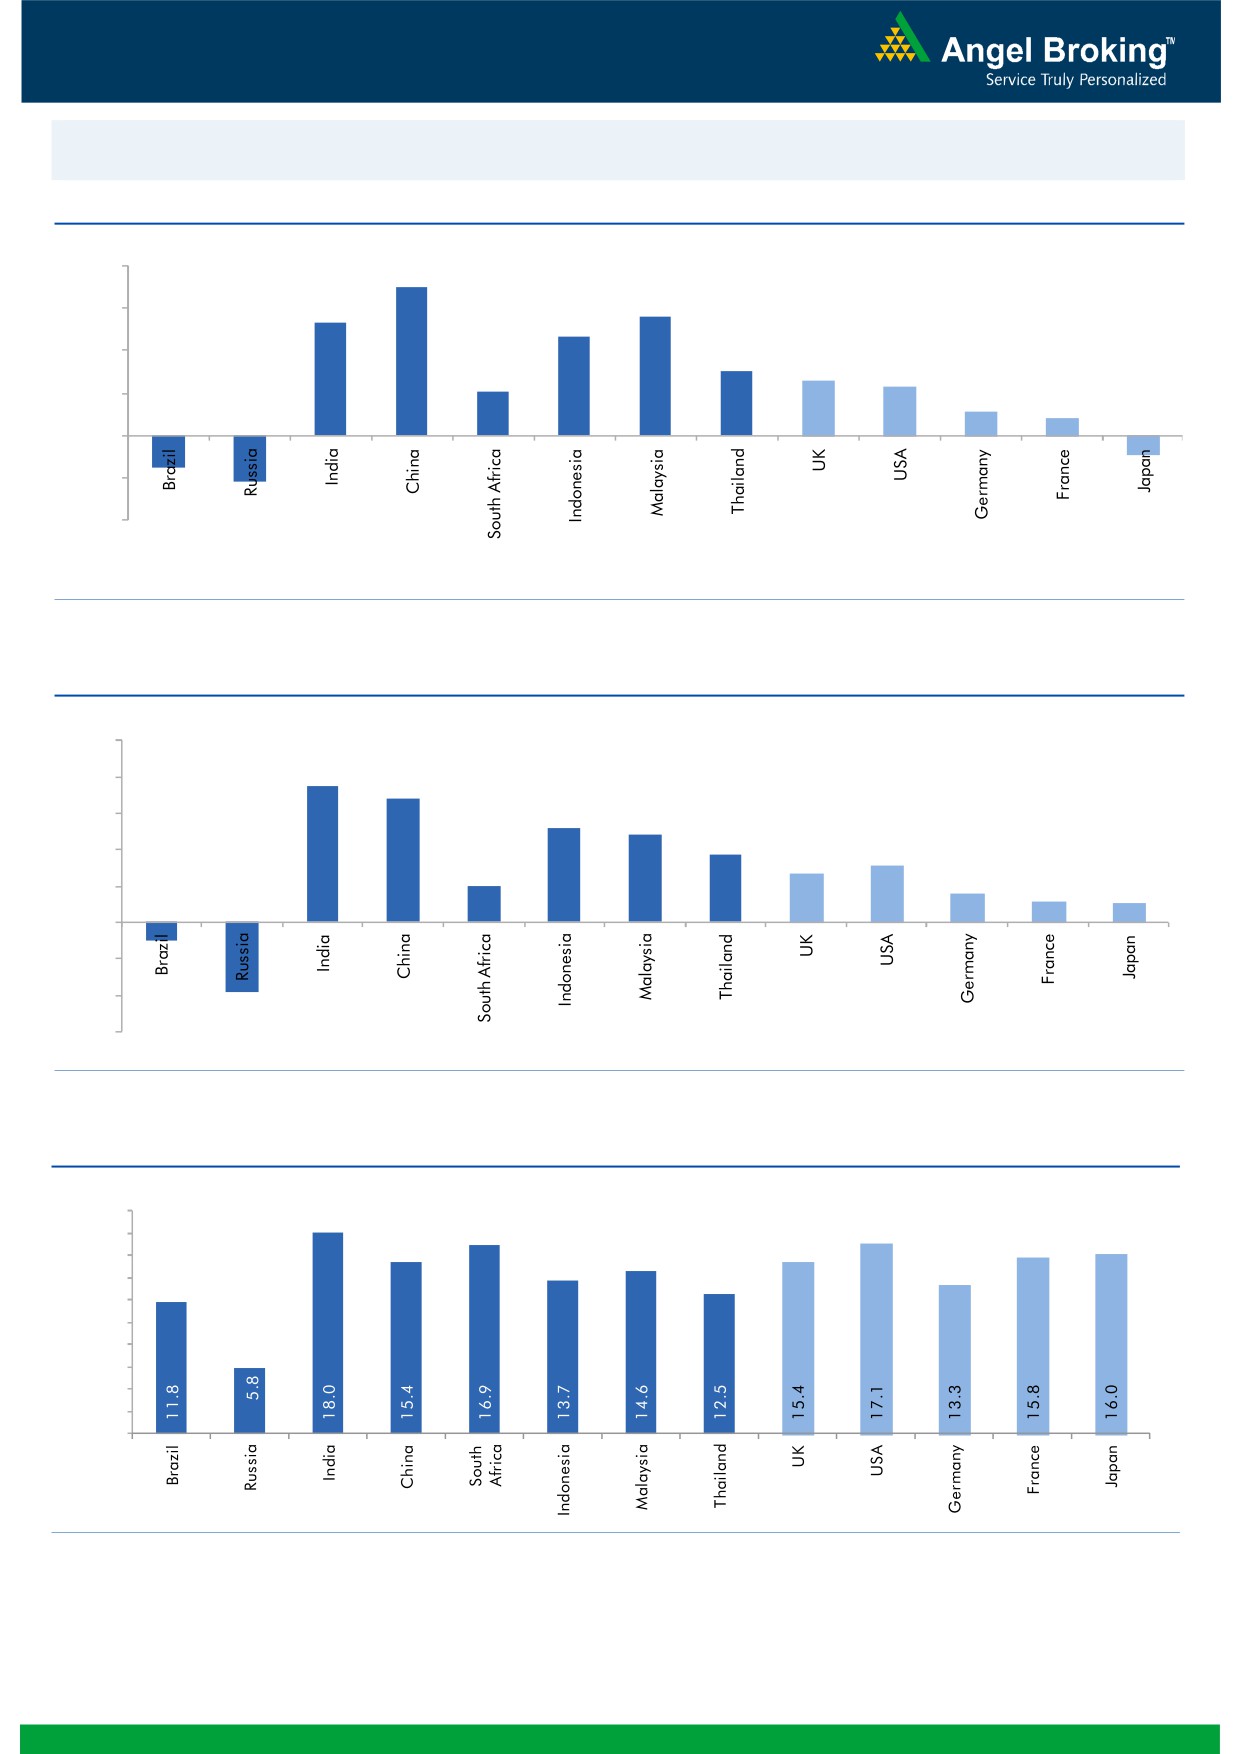
Global watch
Exhibit 1: Latest quarterly GDP Growth (%, yoy) across select developing and developed countries
(%)
8.0
7.0
5.6
6.0
5.3
4.7
4.0
3.0
2.6
2.1
2.3
2.0
1.1
0.8
(1.6)
(2.2)
(0.9)
-
(2.0)
(4.0)
Source: Bloomberg, Angel Research
Exhibit 2: 2015 GDP Growth projection by IMF (%, yoy) across select developing and developed countries
(%)
10.0
7.5
8.0
6.8
6.0
5.2
4.8
3.7
4.0
3.1
2.7
2.0
1.6
2.0
1.2
1.0
(1.0)
(3.8)
-
(2.0)
(4.0)
(6.0)
Source: IMF, Angel Research
Exhibit 3: One year forward P-E ratio across select developing and developed countries
(x)
20.0
18.0
16.0
14.0
12.0
10.0
8.0
6.0
4.0
2.0
-
Source: Bloomberg, Angel Research
Market Outlook
August 18, 2015
Exhibit 4: Relative performance of indices across globe
Returns (%)
Country
Name of index
Closing price
1M
3M
1YR
Brazil
Bovespa
47,217
(11.0)
(17.5)
(15.0)
Russia
Micex
1,708
3.3
1.8
21.3
India
Nifty
8,477
(1.5)
1.3
10.8
China
Shanghai Composite
3,994
0.9
(9.6)
81.9
South Africa
Top 40
45,288
(3.5)
(5.5)
(1.4)
Mexico
Mexbol
43,953
(3.1)
(3.0)
(1.5)
Indonesia
LQ45
776
(7.5)
(14.5)
(12.7)
Malaysia
KLCI
1,573
(9.0)
(13.2)
(15.5)
Thailand
SET 50
920
(5.9)
(7.5)
(8.5)
USA
Dow Jones
17,545
(3.2)
(4.0)
4.2
UK
FTSE
6,550
(3.6)
(6.0)
(3.4)
Japan
Nikkei
20,620
0.2
3.1
39.7
Germany
DAX
10,940
(6.6)
(5.6)
20.3
France
CAC
4,985
(2.7)
(2.6)
16.1
Source: Bloomberg, Angel Research
Market Outlook
August 18, 2015
Stock Watch
Company Name
Reco
CMP
Target
Mkt Cap
Sales ( Čcr )
OPM(%)
EPS (Č)
PER(x)
P/BV(x)
RoE(%)
EV/Sales(x)
(Č)
Price ( Č)
( Č cr )
FY16E FY17E
FY16E
FY17E
FY16E
FY17E
FY16E
FY17E
FY16E
FY17E
FY16E
FY17E
FY16E
FY17E
Agri / Agri Chemical
Rallis
Neutral
227
-
4,415
2,075
2,394
14.4
14.4
9.5
11.0
23.9
20.6
4.8
4.1
21.1
21.3
2.2
1.9
United Phosphorus
Neutral
554
-
23,732
13,698
15,752
17.6
17.6
32.1
38.5
17.3
14.4
3.4
2.8
21.4
21.3
1.8
1.5
Auto & Auto Ancillary
Ashok Leyland
Neutral
92
-
26,097
17,850
20,852
10.6
11.1
3.2
4.3
28.7
21.3
4.8
4.4
16.4
20.8
1.4
1.2
Bajaj Auto
Neutral
2,530
-
73,208
23,842
27,264
19.8
19.6
128.4
144.4
19.7
17.5
6.0
5.2
30.5
29.5
2.6
2.3
Eicher Motors
Accumulate
20,665
21,843
56,089
11,681
15,550
15.3
16.9
358.5
564.3
57.6
36.6
17.3
12.9
29.8
34.9
4.7
3.5
Hero Motocorp
Neutral
2,654
-
52,987
28,500
33,028
13.8
14.1
144.2
166.3
18.4
16.0
6.8
5.7
36.7
36.0
1.7
1.4
L G Balakrishnan & Bros Neutral
462
-
725
1,254
1,394
11.6
11.8
35.9
41.7
12.9
11.1
1.7
1.5
13.5
13.8
0.7
0.6
Mahindra and Mahindra Accumulate
1,352
1,493
83,953
40,088
45,176
13.8
14.0
59.6
70.4
22.7
19.2
3.8
3.3
16.6
17.2
1.8
1.5
Maruti
Neutral
4,542
-
137,215
58,102
68,587
16.7
16.9
182.0
225.5
25.0
20.1
5.0
4.2
19.9
21.0
2.1
1.8
Minda Industries
Accumulate
588
652
933
2,567
2,965
7.3
8.0
38.8
54.3
15.2
10.8
2.2
1.8
14.4
16.8
0.5
0.4
Rane Brake Lining
Accumulate
320
366
253
454
511
11.1
11.4
23.8
28.1
13.5
11.4
1.9
1.7
14.2
15.3
0.7
0.6
Setco Automotive
Neutral
227
-
605
594
741
12.7
13.7
8.4
15.8
27.0
14.3
2.8
2.4
10.4
16.9
1.5
1.2
Tata Motors
Buy
356
455
102,770
267,464
311,225
13.7
13.7
34.6
41.8
10.3
8.5
1.3
1.1
13.2
13.9
0.6
0.5
TVS Motor
Accumulate
230
255
10,918
11,839
13,985
7.0
8.0
10.8
15.9
21.3
14.5
5.4
4.3
25.5
29.7
0.9
0.7
Amara Raja Batteries
Neutral
1,056
-
18,034
5,101
6,326
17.7
17.5
30.8
37.8
34.3
27.9
8.4
6.8
24.6
24.2
3.5
2.8
Exide Industries
Neutral
162
-
13,766
7,363
8,247
13.7
14.5
6.6
7.7
24.5
21.0
3.1
2.8
12.6
13.3
1.6
1.4
Apollo Tyres
Neutral
192
-
9,778
12,428
13,262
16.8
16.4
21.9
21.1
8.8
9.1
1.5
1.3
17.0
14.1
0.9
0.9
Ceat
Neutral
1,070
-
4,330
6,041
6,770
14.3
13.9
101.5
117.7
10.6
9.1
2.1
1.8
20.0
19.2
0.9
0.7
JK Tyres
Buy
109
147
2,479
7,446
7,942
15.2
14.7
19.6
21.0
5.6
5.2
1.4
1.1
25.2
21.7
0.7
0.6
Swaraj Engines
Neutral
968
-
1,202
593
677
14.5
14.8
51.2
60.8
18.9
15.9
4.4
3.9
23.3
24.8
1.9
1.6
Subros
Neutral
91
-
548
1,268
1,488
11.6
11.9
3.7
6.6
24.7
13.8
1.7
1.5
6.8
11.4
0.7
0.6
Indag Rubber
Neutral
194
-
510
283
329
17.0
17.2
13.0
15.4
15.0
12.6
3.3
2.7
21.8
21.6
1.5
1.3
Capital Goods
ACE
Neutral
45
-
448
660
839
4.7
8.2
1.0
3.9
45.3
11.6
1.4
1.3
3.2
11.3
0.8
0.7
BEML
Neutral
1,355
-
5,645
3,277
4,006
6.0
8.9
29.2
64.3
46.4
21.1
2.6
2.4
5.7
11.7
1.8
1.4
BGR Energy
Neutral
131
-
944
3,615
3,181
9.5
9.4
16.7
12.4
7.8
10.6
0.7
0.7
10.0
7.0
0.7
0.8
BHEL
Neutral
261
-
63,968
33,722
35,272
10.8
11.7
10.5
14.2
24.9
18.4
1.8
1.7
7.0
9.0
2.0
1.9
Blue Star
Accumulate
362
387
3,257
3,649
4,209
5.0
5.9
9.2
14.7
39.6
24.6
7.2
6.7
9.1
17.5
1.0
0.9
Crompton Greaves
Accumulate
189
204
11,836
13,484
14,687
4.9
6.2
4.5
7.1
42.0
26.6
3.0
2.8
7.2
10.8
1.0
0.9
Inox Wind
Buy
396
505
8,784
4,980
5,943
17.0
17.5
26.6
31.6
14.9
12.5
4.5
3.3
35.0
30.0
1.9
1.6
Market Outlook
August 18, 2015
Stock Watch
Company Name
Reco
CMP
Target
Mkt Cap
Sales ( Čcr )
OPM(%)
EPS (Č)
PER(x)
P/BV(x)
RoE(%)
EV/Sales(x)
(Č)
Price ( Č)
( Č cr )
FY16E
FY17E
FY16E
FY17E
FY16E
FY17E
FY16E
FY17E
FY16E
FY17E
FY16E
FY17E
FY16E
FY17E
Capital Goods
KEC International
Neutral
142
-
3,657
8,791
9,716
6.1
6.8
5.4
8.2
26.3
17.4
2.6
2.4
10.0
14.0
0.6
0.6
Thermax
Neutral
1,026
-
12,219
6,413
7,525
7.4
8.5
30.5
39.3
33.6
26.1
5.2
4.5
15.0
17.0
1.9
1.6
Cement
ACC
Accumulate
1,368
1,548
25,687
11,856
14,092
14.5
17.8
47.6
76.1
28.7
18.0
3.0
2.7
10.6
15.7
2.0
1.7
Ambuja Cements
Neutral
225
-
34,964
10,569
12,022
20.7
22.2
8.7
10.7
25.9
21.1
3.3
3.1
13.0
15.2
2.9
2.5
India Cements
Buy
83
112
2,543
4,716
5,133
15.9
16.9
3.7
7.5
22.4
11.0
0.8
0.8
3.8
7.3
0.8
0.7
JK Cement
Buy
642
767
4,491
4,056
4,748
14.5
17.0
22.6
41.1
28.4
15.6
2.5
2.3
9.3
15.3
1.5
1.3
J K Lakshmi Cement
Buy
357
443
4,206
3,004
3,618
17.6
19.9
13.9
27.2
25.7
13.1
2.9
2.5
11.8
20.5
1.8
1.5
Mangalam Cements
Buy
225
349
601
1,111
1,336
12.2
15.1
16.3
34.6
13.8
6.5
1.1
1.0
8.2
16.0
0.8
0.6
Orient Cement
Accumulate
170
183
3,486
1,854
2,524
21.2
22.2
7.7
11.1
22.1
15.3
3.2
2.7
13.3
15.7
2.6
1.8
Ramco Cements
Neutral
348
-
8,285
4,036
4,545
20.8
21.3
15.1
18.8
23.1
18.5
2.8
2.5
12.9
14.3
2.6
2.2
Shree Cement^
Neutral
10,926
-
38,064
7,150
8,742
26.7
28.6
228.0
345.5
47.9
31.6
7.1
5.9
15.7
20.3
5.1
4.1
UltraTech Cement
Accumulate
3,082
3,282
84,568
27,562
31,548
20.4
22.3
111.9
143.3
27.5
21.5
3.9
3.4
15.2
16.8
3.1
2.7
Construction
ITNL
Accumulate
117
130
2,892
7,360
8,825
34.0
35.9
1.0
5.0
117.2
23.4
0.5
0.5
0.3
1.4
3.8
3.7
KNR Constructions
Neutral
562
-
1,450
915
1,479
14.3
13.9
20.3
37.2
27.7
15.1
2.5
2.2
9.6
15.6
1.7
1.1
Larsen & Toubro
Accumulate
1,778
2,013
165,422
68,920
82,446
10.9
11.5
57.0
73.0
31.2
24.4
2.9
2.7
13.6
15.5
2.6
2.2
Gujarat Pipavav Port
Neutral
193
-
9,311
740
843
53.1
53.6
8.0
10.0
24.1
19.3
3.8
3.0
20.4
19.4
12.1
10.3
MBL Infrastructures
Buy
262
395
1,085
2,507
2,986
12.4
14.4
21.5
20.5
12.2
12.8
1.5
1.3
12.6
12.7
1.2
1.1
PNC Infratech
Accumulate
481
522
2,466
1,798
2,132
13.2
13.5
22.0
30.0
21.9
16.0
2.0
1.8
11.5
11.4
1.5
1.2
Financials
Allahabad Bank
Neutral
96
-
5,491
8,859
9,817
3.0
3.0
23.7
30.1
4.1
3.2
0.5
0.4
10.6
12.3
-
-
Axis Bank
Buy
562
716
133,435
26,522
31,625
3.6
3.6
36.2
45.4
15.5
12.4
3.0
2.6
18.2
19.6
-
-
Bank of Baroda
Neutral
212
-
46,972
18,934
21,374
2.0
2.0
13.2
15.1
16.1
14.1
1.2
1.1
7.1
7.7
-
-
Bank of India
Neutral
185
-
12,307
17,402
20,003
2.0
2.1
40.3
50.7
4.6
3.7
0.5
0.4
9.0
10.4
-
-
Canara Bank
Neutral
347
-
17,857
15,805
17,745
2.0
2.2
64.3
73.5
5.4
4.7
0.6
0.5
10.8
11.3
-
-
Dena Bank
Neutral
46
-
2,562
3,580
4,040
2.1
2.2
8.4
10.9
5.5
4.2
0.5
0.4
6.8
8.4
-
-
Federal Bank
Neutral
68
-
11,592
3,522
4,045
3.2
3.2
12.2
14.1
5.5
4.8
0.7
0.6
12.9
13.4
-
-
HDFC
Neutral
1,280
-
201,761
11,198
13,321
3.5
3.5
45.1
53.7
28.4
23.8
5.9
5.3
27.2
28.2
-
-
HDFC Bank
Buy
1,091
1,255
274,150
38,629
47,500
4.5
4.7
52.6
66.4
20.7
16.4
3.8
3.2
19.6
21.2
-
-
ICICI Bank
Buy
303
370
175,863
36,037
41,647
3.5
3.6
22.9
26.7
13.2
11.4
2.2
1.9
15.7
15.9
-
-
IDBI Bank
Neutral
71
-
11,332
9,806
11,371
1.7
1.9
10.0
16.3
7.1
4.3
0.5
0.5
6.8
10.4
-
-
Market Outlook
August 18, 2015
Stock Watch
Company Name
Reco
CMP
Target
Mkt Cap
Sales ( Čcr )
OPM(%)
EPS (Č)
PER(x)
P/BV(x)
RoE(%)
EV/Sales(x)
(Č)
Price ( Č)
( Č cr )
FY16E FY17E
FY16E
FY17E
FY16E
FY17E
FY16E
FY17E
FY16E
FY17E
FY16E
FY17E
FY16E
FY17E
Financials
Indian Bank
Neutral
162
-
7,762
6,454
7,321
2.5
2.6
26.4
33.3
6.1
4.9
0.5
0.5
8.1
9.6
-
-
LIC Housing Finance
Buy
501
590
25,263
2,934
3,511
2.3
2.3
30.9
36.8
16.2
13.6
2.6
2.3
16.8
17.5
-
-
Oriental Bank
Neutral
181
-
5,426
7,930
8,852
2.5
2.5
51.8
57.1
3.5
3.2
0.4
0.4
9.3
9.5
-
-
Punjab Natl.Bank
Neutral
173
-
32,093
24,160
27,777
2.9
3.0
18.5
24.6
9.4
7.0
0.9
0.8
8.8
10.8
-
-
South Ind.Bank
Neutral
23
-
3,132
1,999
2,249
2.4
2.4
3.5
4.0
6.7
5.8
0.8
0.8
12.6
13.1
-
-
St Bk of India
Neutral
279
-
211,135
86,900
100,550
3.1
3.1
22.1
27.7
12.7
10.1
1.6
1.4
12.7
14.3
-
-
Union Bank
Neutral
219
-
13,930
12,995
14,782
2.4
2.4
32.3
40.9
6.8
5.4
0.8
0.7
10.7
12.3
-
-
Vijaya Bank
Neutral
41
-
3,497
3,474
3,932
1.8
1.9
5.9
7.2
6.9
5.7
0.6
0.5
8.1
9.3
-
-
Yes Bank
Buy
791
989
33,056
7,006
8,825
3.1
3.3
61.4
77.1
12.9
10.3
2.4
2.0
20.1
21.3
-
-
FMCG
Asian Paints
Neutral
900
-
86,333
16,553
19,160
16.0
16.2
17.7
21.5
50.9
41.9
13.5
12.2
29.4
31.2
5.1
4.4
Britannia
Neutral
3,293
-
39,506
8,065
9,395
9.6
10.2
47.2
65.5
69.7
50.3
23.2
21.9
38.3
41.2
4.8
4.1
Colgate
Neutral
1,983
-
26,961
4,836
5,490
19.5
19.7
48.5
53.2
40.9
37.3
30.0
26.1
99.8
97.5
5.5
4.8
Dabur India
Neutral
303
-
53,205
9,370
10,265
17.1
17.2
7.3
8.1
41.3
37.4
12.5
10.1
33.7
30.6
5.6
5.1
GlaxoSmith Con*
Neutral
6,225
-
26,181
4,919
5,742
17.2
17.4
168.3
191.2
37.0
32.6
10.5
8.9
28.8
28.9
4.9
4.1
Godrej Consumer
Neutral
1,298
-
44,188
10,168
12,886
16.1
16.1
32.1
38.4
40.4
33.8
8.2
7.6
19.7
21.0
4.4
3.5
HUL
Neutral
873
-
188,804
34,940
38,957
17.5
17.7
20.8
24.7
42.0
35.3
46.7
37.3
110.5
114.2
5.2
4.6
ITC
Buy
317
409
254,103
41,068
45,068
37.8
37.4
13.9
15.9
22.8
19.9
7.6
6.7
34.1
33.8
5.8
5.3
Marico
Neutral
425
-
27,413
6,551
7,766
15.7
16.0
10.4
12.5
40.9
34.0
11.9
9.9
33.2
32.4
4.1
3.5
Nestle*
Accumulate
6,132
6,646
59,122
11,291
12,847
22.2
22.3
158.9
184.6
38.6
33.2
20.2
18.1
55.0
57.3
5.1
4.4
Tata Global
Buy
131
152
8,261
8,635
9,072
9.8
9.9
6.5
7.6
20.2
17.2
2.0
1.9
6.8
7.4
0.9
0.9
IT
HCL Tech^
Buy
967
1,132
135,993
42,038
47,503
23.5
23.5
56.4
62.9
17.2
15.4
4.0
3.0
23.2
19.8
2.8
2.3
Infosys
Accumulate
1,142
1,306
262,277
60,250
66,999
28.0
28.0
58.3
63.7
19.6
17.9
4.1
3.5
20.9
19.7
3.7
3.1
TCS
Buy
2,685
3,168
525,870
108,420
123,559
28.8
28.7
127.2
143.9
21.1
18.7
8.4
7.8
39.9
41.8
4.4
3.9
Tech Mahindra
Buy
553
646
53,148
25,566
28,890
16.0
17.0
26.3
31.9
21.0
17.3
3.8
3.2
17.9
18.6
1.9
1.6
Wipro
Buy
576
719
142,247
52,414
58,704
23.7
23.8
38.4
42.3
15.0
13.6
2.9
2.6
19.5
18.0
2.3
1.9
Media
D B Corp
Accumulate
325
356
5,977
2,241
2,495
27.8
27.9
21.8
25.6
15.0
12.7
3.9
3.4
26.7
28.5
2.6
2.3
HT Media
Neutral
87
-
2,020
2,495
2,603
11.2
11.2
7.3
8.6
11.9
10.1
0.9
0.9
7.4
8.1
0.3
0.3
Jagran Prakashan
Accumulate
140
156
4,585
1,939
2,122
26.0
26.0
8.3
9.2
16.9
15.2
2.9
2.6
17.5
17.1
2.3
2.1
Sun TV Network
Neutral
364
-
14,351
2,779
3,196
70.2
70.5
22.8
27.3
16.0
13.3
3.9
3.6
26.7
28.3
4.9
4.3
Market Outlook
August 18, 2015
Stock Watch
Company Name
Reco
CMP
Target
Mkt Cap
Sales ( Čcr )
OPM(%)
EPS (Č)
PER(x)
P/BV(x)
RoE(%)
EV/Sales(x)
(Č)
Price ( Č)
( Č cr )
FY16E FY17E
FY16E
FY17E
FY16E
FY17E
FY16E
FY17E
FY16E
FY17E
FY16E
FY17E
FY16E
FY17E
Media
Hindustan Media
Buy
236
292
1,728
920
1,031
20.0
20.0
19.2
20.9
12.3
11.3
2.0
1.7
16.4
15.3
1.4
1.2
Ventures
Metals & Mining
Coal India
Buy
380
450
240,022
77,595
89,628
22.9
24.4
27.6
30.0
13.8
12.7
5.9
5.9
33.9
33.2
2.4
2.1
Hind. Zinc
Neutral
149
-
62,978
15,546
16,821
47.5
49.0
19.7
20.3
7.6
7.3
1.3
1.1
17.2
16.6
1.8
1.3
Hindalco
Neutral
91
-
18,760
112,328
119,817
7.7
7.9
16.3
20.1
5.6
4.5
0.4
0.4
8.0
8.5
0.6
0.5
JSW Steel
Neutral
968
-
23,393
48,125
53,595
18.8
21.0
46.9
97.5
20.6
9.9
1.0
0.9
4.4
9.5
1.3
1.2
NMDC
Neutral
99
-
39,310
12,544
13,330
59.5
59.7
16.3
16.5
6.1
6.0
1.1
1.0
5.1
9.9
1.9
1.8
SAIL
Neutral
57
-
23,707
56,365
63,383
6.9
8.0
7.1
8.2
8.1
7.0
0.5
0.5
7.0
7.1
1.0
0.9
Vedanta
Neutral
105
-
31,129
81,842
88,430
30.6
32.8
20.2
25.7
5.2
4.1
0.4
0.3
7.5
8.5
0.8
0.6
Tata Steel
Neutral
247
-
23,945
136,805
149,228
11.3
11.9
26.4
36.8
9.3
6.7
0.7
0.7
6.0
8.0
0.7
0.7
Oil & Gas
Cairn India
Neutral
154
-
28,948
12,617
14,513
33.7
40.0
25.5
27.7
6.1
5.6
0.5
0.4
7.4
7.7
1.0
0.8
GAIL
Neutral
346
-
43,826
75,595
85,554
8.6
8.0
31.8
36.1
10.9
9.6
1.2
1.1
10.7
11.4
0.7
0.6
ONGC
Neutral
264
-
225,993
174,773
192,517
22.7
24.8
34.6
38.2
7.6
6.9
1.1
1.0
14.2
14.9
1.4
1.2
Petronet LNG
Accumulate
185
210
13,901
39,007
40,785
3.8
4.2
9.2
11.0
20.3
16.9
2.3
2.1
11.6
12.7
0.4
0.4
Reliance Industries
Accumulate
950
1,050
307,640
339,083
384,014
7.8
9.5
75.7
94.5
12.6
10.1
1.2
1.2
10.7
12.2
1.2
1.1
Pharmaceuticals
Alembic Pharma
Neutral
717
-
13,512
2,601
3,115
21.2
20.2
20.8
23.9
34.5
30.0
11.1
8.4
37.2
31.8
5.2
4.3
Aurobindo Pharma
Accumulate
783
824
45,745
14,435
16,600
22.6
22.6
36.1
41.2
21.7
19.0
6.5
4.9
34.5
29.3
3.5
3.0
Aventis*
Neutral
4,118
-
9,483
2,156
2,455
15.1
16.8
109.7
133.9
37.5
30.8
5.2
4.2
18.4
22.5
4.1
3.4
Cadila Healthcare
Neutral
1,981
-
40,570
10,224
11,840
20.0
21.0
71.0
85.6
27.9
23.2
7.5
5.9
30.1
28.5
4.0
3.4
Cipla
Neutral
704
-
56,527
14,051
16,515
18.9
18.7
25.1
28.9
28.0
24.4
4.5
3.8
17.2
16.9
4.0
3.4
Dr Reddy's
Neutral
4,173
-
71,146
17,903
20,842
22.7
22.8
160.5
189.5
26.0
22.0
5.3
4.4
22.2
21.7
3.9
3.3
Dishman Pharma
Buy
209
293
1,688
1,716
1,888
20.2
20.2
16.3
21.6
12.8
9.7
1.2
1.1
9.7
11.7
1.2
0.9
GSK Pharma*
Neutral
3,645
-
30,872
2,870
3,158
20.0
22.1
59.5
68.3
61.3
53.4
18.1
18.6
28.5
34.3
10.3
9.4
Indoco Remedies
Neutral
349
-
3,217
1,088
1,262
18.2
18.2
13.1
15.5
26.7
22.5
5.2
4.4
21.2
21.1
3.0
2.6
Ipca labs
Neutral
824
-
10,395
3,507
4,078
17.6
18.6
25.8
32.0
31.9
25.8
4.1
3.6
13.8
14.9
3.2
2.8
Lupin
Neutral
1,793
-
80,693
14,864
17,244
26.9
26.9
62.1
71.1
28.9
25.2
7.0
5.6
27.4
24.6
5.2
4.3
Sun Pharma
Neutral
906
-
218,119
28,163
32,610
25.8
30.7
17.4
26.9
52.1
33.7
4.9
4.3
13.0
16.6
7.2
6.0
Power
Tata Power
Neutral
69
-
18,567
38,302
38,404
14.1
13.1
5.1
6.0
13.4
11.5
1.3
1.2
9.2
10.3
1.4
1.3
NTPC
Buy
128
157
105,583
87,064
98,846
23.5
23.5
11.7
13.2
10.9
9.7
1.2
1.1
11.4
12.1
2.2
2.0
Power Grid
Buy
138
170
72,144
20,702
23,361
86.7
86.4
12.1
13.2
11.4
10.4
1.7
1.5
15.6
15.1
8.4
7.8
Market Outlook
August 18, 2015
Stock Watch
Company Name
Reco
CMP
Target
Mkt Cap
Sales ( Čcr )
OPM(%)
EPS (Č)
PER(x)
P/BV(x)
RoE(%)
EV/Sales(x)
(Č)
Price ( Č)
( Č cr )
FY16E FY17E
FY16E
FY17E
FY16E
FY17E
FY16E
FY17E
FY16E
FY17E
FY16E
FY17E
FY16E
FY17E
Telecom
Bharti Airtel
Neutral
390
-
155,939
101,748
109,191
32.1
31.7
12.0
12.5
32.5
31.2
2.2
2.1
6.9
6.7
2.2
2.0
Idea Cellular
Accumulate
163
171
58,479
34,282
36,941
32.0
31.5
5.9
6.2
27.5
26.2
2.5
2.3
9.9
9.3
2.3
2.2
zOthers
Abbott India
Neutral
4,773
-
10,143
2,715
3,153
14.5
14.1
134.3
152.2
35.6
31.4
8.9
7.3
27.4
25.6
3.5
2.9
Bajaj Electricals
Buy
265
341
2,674
4,719
5,287
5.2
5.8
8.6
12.7
31.0
21.0
3.5
3.1
11.4
14.8
0.6
0.5
Finolex Cables
Neutral
251
-
3,832
2,728
3,036
10.8
11.0
14.4
16.8
17.4
15.0
2.6
2.3
15.2
15.3
1.2
1.0
Goodyear India*
Accumulate
602
655
1,388
1,953
1,766
12.4
12.0
67.4
59.6
8.9
10.1
2.2
1.9
27.7
20.2
0.5
0.5
Hitachi
Neutral
1,343
-
3,652
1,806
2,112
9.0
9.2
28.6
29.1
47.0
46.2
11.7
9.4
28.1
22.6
2.1
1.8
Jyothy Laboratories
Neutral
320
-
5,794
1,620
1,847
11.5
11.5
7.3
8.5
43.9
37.8
5.7
5.3
13.3
14.4
3.4
2.9
MRF
Neutral
42,564
-
18,052
20,727
14,841
19.3
18.6
4,905.8
3,351.9
8.7
12.7
2.8
2.3
37.6
19.6
0.8
1.1
Page Industries
Neutral
14,440
-
16,106
1,929
2,450
19.8
20.1
229.9
299.0
62.8
48.3
27.7
19.3
52.1
47.1
8.4
6.6
Relaxo Footwears
Neutral
555
-
6,656
1,767
2,152
12.3
12.5
19.3
25.1
28.8
22.1
7.1
5.4
27.7
27.8
3.8
3.1
Siyaram Silk Mills
Accumulate
1,084
1,221
1,016
1,653
1,873
11.7
12.2
99.3
122.1
10.9
8.9
2.0
1.7
19.5
20.2
0.8
0.7
Styrolution ABS India*
Neutral
803
-
1,412
1,271
1,440
8.6
9.2
32.0
41.1
25.1
19.6
2.6
2.3
10.7
12.4
1.1
0.9
Tree House
Accumulate
408
433
1,726
259
324
56.8
56.8
17.0
21.7
24.0
18.8
2.4
2.2
10.1
11.5
6.6
5.4
TVS Srichakra
Neutral
3,183
-
2,437
2,127
2,388
15.2
14.9
237.7
267.5
13.4
11.9
5.7
4.0
51.7
39.8
1.2
1.0
HSIL
Buy
297
434
2,148
2,085
2,436
18.5
18.6
21.7
28.9
13.7
10.3
1.4
1.2
10.0
12.1
1.2
0.9
Kirloskar Engines India
Accumulate
269
297
3,891
2,634
3,252
10.1
12.0
10.9
17.4
24.7
15.4
2.8
2.5
11.4
16.8
1.1
0.8
Ltd
M M Forgings
Buy
668
797
807
563
671
22.1
22.9
51.0
66.5
13.1
10.1
2.7
2.2
23.1
24.1
1.6
1.3
Banco Products (India)
Neutral
128
-
915
1,208
1,353
11.0
12.3
10.8
14.5
11.9
8.8
1.4
1.2
11.9
14.5
0.7
0.6
Competent Automobiles Neutral
166
-
102
1,007
1,114
3.1
3.1
23.7
28.2
7.0
5.9
1.0
0.9
13.9
14.6
0.1
0.1
Nilkamal
Neutral
1,033
-
1,542
1,948
2,147
10.6
10.3
60.0
67.0
17.2
15.4
2.7
2.3
16.8
16.1
0.8
0.7
Visaka Industries
Neutral
163
-
259
1,158
1,272
8.6
9.5
23.7
32.7
6.9
5.0
0.7
0.6
10.1
12.5
0.4
0.3
Transport Corporation of
Neutral
283
-
2,145
2,830
3,350
8.8
9.0
14.4
18.3
19.7
15.5
3.0
2.6
15.4
17.1
0.9
0.8
India
Elecon Engineering
Accumulate
79
87
865
1,452
1,596
14.0
14.7
4.4
6.2
18.0
12.7
1.5
1.4
8.6
11.2
0.9
0.8
Surya Roshni
Buy
139
183
608
2,992
3,223
8.3
8.5
14.7
18.3
9.4
7.6
0.9
0.8
9.8
11.0
0.5
0.5
MT Educare
Accumulate
129
141
514
275
355
18.3
17.3
7.4
8.8
17.5
14.7
3.5
3.1
20.2
21.1
1.8
1.3
Radico Khaitan
Buy
94
112
1,253
1,565
1,687
11.9
12.4
5.4
6.6
17.4
14.3
1.4
1.3
8.0
9.0
1.3
1.2
Garware Wall Ropes
Buy
298
390
652
875
983
10.4
10.6
23.1
27.8
12.9
10.7
1.8
1.6
14.1
14.8
0.9
0.7
Source: Company, Angel Research; Note: *December year end; #September year end; &October year end; Price as on August 17, 2015
Market Outlook
August 18, 2015
Research Team Tel: 022 - 39357800
DISCLAIMER
Angel Broking Private Limited (hereinafter referred to as “Angel”) is a registered Member of National Stock Exchange of India Limited,
Bombay Stock Exchange Limited and MCX Stock Exchange Limited. It is also registered as a Depository Participant with CDSL and
Portfolio Manager with SEBI. It also has registration with AMFI as a Mutual Fund Distributor. Angel Broking Private Limited is a registered
entity with SEBI for Research Analyst in terms of SEBI (Research Analyst) Regulations, 2014 vide registration number INH000000164.
Angel or its associates has not been debarred/ suspended by SEBI or any other regulatory authority for accessing /dealing in securities
Market. Angel or its associates including its relatives/analyst do not hold any financial interest/beneficial ownership of more than 1% in
the company covered by Analyst. Angel or its associates/analyst has not received any compensation / managed or co-managed public
offering of securities of the company covered by Analyst during the past twelve months. Angel/analyst has not served as an officer,
director or employee of company covered by Analyst and has not been engaged in market making activity of the company covered by
Analyst.
This document is solely for the personal information of the recipient, and must not be singularly used as the basis of any investment
decision. Nothing in this document should be construed as investment or financial advice. Each recipient of this document should make
such investigations as they deem necessary to arrive at an independent evaluation of an investment in the securities of the companies
referred to in this document (including the merits and risks involved), and should consult their own advisors to determine the merits and
risks of such an investment.
Reports based on technical and derivative analysis center on studying charts of a stock's price movement, outstanding positions and
trading volume, as opposed to focusing on a company's fundamentals and, as such, may not match with a report on a company's
fundamentals.
The information in this document has been printed on the basis of publicly available information, internal data and other reliable sources
believed to be true, but we do not represent that it is accurate or complete and it should not be relied on as such, as this document is for
general guidance only. Angel Broking Pvt. Limited or any of its affiliates/ group companies shall not be in any way responsible for any
loss or damage that may arise to any person from any inadvertent error in the information contained in this report. Angel Broking Pvt.
Limited has not independently verified all the information contained within this document. Accordingly, we cannot testify, nor make any
representation or warranty, express or implied, to the accuracy, contents or data contained within this document. While Angel Broking
Pvt. Limited endeavors to update on a reasonable basis the information discussed in this material, there may be regulatory, compliance,
or other reasons that prevent us from doing so.
This document is being supplied to you solely for your information, and its contents, information or data may not be reproduced,
redistributed or passed on, directly or indirectly.
Neither Angel Broking Pvt. Limited, nor its directors, employees or affiliates shall be liable for any loss or damage that may arise from or
in connection with the use of this information.
Note: Please refer to the important ‘Stock Holding Disclosure' report on the Angel website (Research Section). Also, please refer to the
latest update on respective stocks for the disclosure status in respect of those stocks. Angel Broking Pvt. Limited and its affiliates may have
investment positions in the stocks recommended in this report.